sách hướng dẫn sử dụng phần mềm IHSDM
Bạn đang xem bản rút gọn của tài liệu. Xem và tải ngay bản đầy đủ của tài liệu tại đây (2.51 MB, 154 trang )
EVALUATION OF THE APPLICABILITY OF THE INTERACTIVE
HIGHWAY SAFETY DESIGN MODEL TO SAFETY AUDITS OF
TWO-LANE RURAL HIGHWAYS
by
Kaitlin Chuo
A thesis submitted to the faculty of
Brigham Young University
in partial fulfillment of the requirements for the degree of
Master of Science
Department of Civil and Environmental Engineering
Brigham Young University
April 2008
BRIGHAM YOUNG UNIVERSITY
GRADUATE COMMITTEE APPROVAL
of a thesis submitted by
Kaitlin Chuo
This thesis has been read by each member of the following graduate committee and by
majority vote has been found to be satisfactory.
Date
Mitsuru Saito, Chair
Date
Grant G. Schultz
Date
E. James Nelson
BRIGHAM YOUNG UNIVERSITY
As chair of the candidate’s graduate committee, I have read the thesis of Kaitlin Chuo
in its final form and have found that (1) its format, citations, and bibliographical style
are consistent and acceptable and fulfill university and department style requirements;
(2) its illustrative materials including figures, tables, and charts are in place; and (3)
the final manuscript is satisfactory to the graduate committee and is ready for
submission to the university library.
Date
Mitsuru Saito
Chair, Graduate Committee
Accepted for the Department
E. James Nelson
Graduate Coordinator
Accepted for the College
Alan R. Parkinson
Dean, Ira A. Fulton College of Engineering
and Technology
ABSTRACT
EVALUATION OF THE APPLICABILITY OF THE INTERACTIVE
HIGHWAY SAFETY DESIGN MODEL TO SAFETY AUDITS OF
TWO-LANE RURAL HIGHWAYS
Kaitlin Chuo
Department of Civil and Environmental Engineering
Master of Science
The Interactive Highway Safety Design Model (IHSDM) is a suite of software
developed by the Federal Highway Administration (FHWA) for monitoring and
analyzing two-lane rural highways in the United States. As IHSDM is a fairly “young”
program a limited amount of research has been conducted to evaluate its practicability
and reliability. To determine if IHSDM can be adopted into the engineering decision
making process in Utah, a study was conducted under the supervision of the Utah
Department of Transportation (UDOT) to evaluate its applicability to audit safety of twolane rural highways in Utah.
IHSDM consists of six modules: Policy Review Module (PRM), Crash Prediction
Module (CPM), Design Consistency Module (DCM), Traffic Analysis Module (TAM),
Intersection Review Module (IRM), and Driver/Vehicle Module (DVM) (still under
construction). Among the six modules, two were chosen for evaluation because of their
applicability to audit safety of the two-lane rural highways in Utah, namely CPM and
IRM.
For the evaluation of the CPM, three two-lane rural highway sections were
selected. The results of this evaluation show that the CPM can produce reasonably
reliable crash predictions if appropriate input data, especially alignment data, reflect the
existing conditions at reasonable accuracy and engineering judgment is used. Using
crash records available from UDOT’s crash database and CPM’s crash prediction
capability, UDOT’s traffic and safety engineers can locate “hot spots” for detailed safety
audit, thus making the safety audit task more focused and effective.
Unlike the CPM, the outputs of the IRM are qualitative and include primarily
suggestions and recommendations. They will help the traffic and safety engineers
identify what to look for as they visit the sites, such as a lack of stopping sight distance
and a lack of passing sight distance. The interpretation of the IRM requires knowledge of
various aspects of highway design, familiarity with A Policy on Geometric Design of
Highways and Streets by the American Association of State Highway and Transportation
Officials (AASHTO), and experience in traffic engineering.
Based on the findings of the study, it is concluded that the CPM and IRM of
IHSDM could be a useful tool for engineering decision-making during safety audits of
two-lane rural highways. But the outputs from these modules demand knowledge and
experience in highway design. It is recommended that the other modules of IHSDM be
tested to fully appreciate the capability of IHSDM. The software can be a knowledgebased program that can help novice engineers to learn how to design safe two-lane rural
highways.
ACKNOWLEDGMENTS
First of all I wish to thank my dear parents, Sherry and Jefferson, who helped me
to pursue my education and my dreams. They have been great examples for me both
professionally and ethically throughout my life. A special thanks goes to my advisor, Dr.
Mitsuru Saito, who supervised me throughout the research, and made a tremendous effort
in helping me write my thesis.
I am grateful for Mr. Mike Dimaiuta, the IHSDM program manager at FHWA,
and his co-workers for providing me the training in the software and patiently answering
all my questions concerning IHSDM. I also appreciate the suggestions,
recommendations, and help from several UDOT engineers, including Doug Anderson,
Troy Peterson, Robert Hull, John Leonard, Tam Southwick, Doug Bassett, Troy
Torgersen, Darin Duersch, and Danielle Herrscher. I especially want to express my
gratitude to Johanna Howard of UDOT Region 3, who helped me to overcome the
difficulties in creating alignments for study sections using the InRoads software, and
Monte Warr and Jeff Ericson, UDOT’s photolog specialists, for providing me the GPS
data necessary for the research.
I also thank the members of my committee: Dr. Grant G. Schultz, who was
always willing to provide me guidance, and Dr. E. James Nelson, who taught me about
converting GPS data into the format that was readable by InRoads. Additionally, I thank
Michael Mosley for writing the manual for creating alignments using limited terrain data
by InRoads, which had helped me to create surrogate centerline alignments for the study
sections whose design plans were not available.
Finally, but not the least, I would also like to thank my classmates and friends
who offered me help when I encountered obstacles and gave me much needed moral
support.
TABLE OF CONTENTS
LIST OF TABLES............................................................................................................. xi
LIST OF FIGURES ......................................................................................................... xiii
1
2
Introduction................................................................................................................. 1
1.1
Purpose and Scope of the Study ......................................................................... 1
1.2
The Current Application of IHSDM ................................................................... 2
1.3
Organization of the Thesis.................................................................................. 4
Literature Research ..................................................................................................... 5
2.1
3
The Overview of IHSDM ................................................................................... 6
2.1.1
Policy Review Module (PRM)........................................................................ 7
2.1.2
Crash Predication Module (CPM) .................................................................. 7
2.1.3
Design Consistency Module (DCM) ............................................................ 10
2.1.4
Traffic Analysis Module (TAM) .................................................................. 10
2.1.5
Intersection Review Module (IRM).............................................................. 11
2.1.6
Driver/Vehicle Module (DVM) .................................................................... 11
2.2
Literature Research ........................................................................................... 12
2.3
Chapter Summary ............................................................................................. 12
Analysis Procedure ................................................................................................... 15
3.1
Data Collection ................................................................................................. 16
3.2
Obtaining Geometric Data ................................................................................ 17
3.3
Other Required Data for CPM .......................................................................... 17
vii
4
3.4
Entering Data into IHSDM ............................................................................... 18
3.5
Chapter Summary ............................................................................................. 20
Application of CPM to Selected Highway Sections ................................................. 21
4.1
4.1.1
Current Conditions of the US-40 Study Section........................................... 23
4.1.2
Centerline Alignments of the US-40 Study section ...................................... 25
4.1.3
Crash Prediction Results of the US-40 Study Section .................................. 27
4.1.4
Analysis of Crash Prediction Results of the US-40 Study Section............... 37
4.2
US-6 Study Section........................................................................................... 45
4.2.1
Current Condition of the US-6 Study Section .............................................. 46
4.2.2
Centerline Alignments of the US-6 Study Section ....................................... 47
4.2.3
Crash Prediction Results of the US-6 Study Section .................................... 49
4.2.4
Analysis of Crash Prediction Results of the US-6 Study Section................. 57
4.3
SR-150 Study Section ....................................................................................... 59
4.3.1
Current Condition of the SR-150 Study Section........................................... 59
4.3.2
Centerline Alignments of SR-150 Study Section ......................................... 61
4.3.3
Crash Prediction Results of the SR-150 Study Section ................................ 68
4.3.4
Analysis of Crash Prediction Results of the SR-150 Study Section ............. 80
4.4
5
US-40 Study Section......................................................................................... 23
Chapter Summary ............................................................................................. 82
Application of IRM to Selected Intersections........................................................... 85
5.1
Need for IRM.................................................................................................... 85
5.2
Application of IRM to the Intersections of US-6, SR-174, and SR-136 .......... 85
5.2.1
Current Conditions of the Intersections ........................................................ 87
5.2.2
Alignments of US-6, SR-174, and SR-136 ................................................... 88
5.2.3
Analysis of the IRM Results ......................................................................... 93
viii
5.3
6
Chapter Summary ............................................................................................. 96
Conclusions and Recommendation........................................................................... 97
6.1
Conclusions....................................................................................................... 98
6.2
Recommendations............................................................................................. 99
References....................................................................................................................... 101
Appendix......................................................................................................................... 103
ix
x
LIST OF TABLES
Table 1-1: Engineering Projects that Adopted IHSDM .....................................................3
Table 4-1: Three Highway Sections Selected for Analysis .............................................21
Table 4-2: The Horizontal Alignment of the US-40 Study Section
(MP 35 to MP 45)...........................................................................................26
Table 4-3: Vertical Alignment of the US-40 Study Section (MP 35 to MP 45)..............27
Table 4-4: Crash Prediction Results for the US-40 Study section (Number of
Crashes) ..........................................................................................................28
Table 4-5: Statistical Summary of the Difference between the CPM Results in
Number of Crashes Analyzed With and Without Crash History of US-40
Study Section..................................................................................................32
Table 4-6: Crash Prediction Results for the US-40 Study Section (Crashes/MVMT) ....33
Table 4-7: Statistics Summary of the Difference between the CPM Results in
Crashes/MVMT Analyzed With and Without Crash History of US-40
Study Section..................................................................................................36
Table 4-8: Crash History Summary of the US-40 Study Section, MP 35-MP 45
(2003-2005) ....................................................................................................38
Table 4-9: Horizontal Alignment of the US-6 Study Section..........................................47
Table 4-10: Vertical Alignments of US-6 Study Section ..................................................48
Table 4-11: Crash Prediction Results for the US-6 Study Section (Number of
Crashes) ..........................................................................................................50
Table 4-12: Statistics Summary of the Difference between the CPM Results in
Number of Crashes Analyzed With and Without Crash History of US-6
Study Section..................................................................................................53
Table 4-13: Crash Prediction Results for US-6 Study Sections, MP 22-MP 28
(crashes/MVMT) ............................................................................................53
xi
Table 4-14: Statistics Summary of the Difference between the CPM Results in
Crashes/MVMT Analyzed With and Without Crash History of US-6
Study Section..................................................................................................57
Table 4-15: Crash History Summary of the US-6 Study Section, MP 22-MP28
(2003-2005) ....................................................................................................58
Table 4-16: Horizontal Alignment of the SR-150 Study Section ......................................61
Table 4-17: Vertical Alignment of the SR-150 Study Section ..........................................63
Table 4-18: Crash Prediction Results for SR-150 Study Section, MP 0.7-MP 16.4
(Number of Crashes) ......................................................................................68
Table 4-19: Statistics Summary of the Difference between the CPM Results in
Number of Crashes Analyzed With and Without Crash History of
SR-150 Study Section ....................................................................................74
Table 4-20: Crash Prediction Results for SR-150 MP 0.7-MP 16.4 (Crashes/MVMT)....74
Table 4-21: Statistics Summary of the Difference between the CPM Results in
Crashes/MVMT Analyzed With and Without Crash History of SR-150
Study Section..................................................................................................80
Table 4-22: Crash History Summary of the US-150 Study Section, MP 0.7-MP 16.4
(2003-2005) ....................................................................................................81
Table 5-1: Alignments of US-6 MP 90-MP 108, SR-174 MP 0-MP 8.1, and SR-136
MP 0-MP 3.1 ..................................................................................................89
Table 5-2: Vertical Alignments of US-6 MP 90-MP 108, SR-174 MP 0-MP 8.1,
and SR-136 MP 0-MP 3.1 ..............................................................................90
Table 5-3: Diagnostic Summary of the Intersection at US-6 and SR-174.......................93
Table 5-4: Diagnostic Summary of the Intersection at US-6 and SR-136.......................94
xii
LIST OF FIGURES
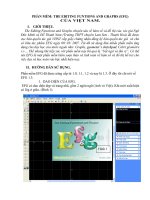
Figure 2-1: IHSDM Screenshot .........................................................................................6
Figure 2-2: Summary Chart of IHSDM’s Six Modules...................................................13
Figure 3-1: Flowchart of Analysis Steps .........................................................................16
Figure 3-2: Illustration of a Data-Collecting Vehicle (Mandli 2007)..............................17
Figure 3-3: Screen Shot Showing the Location of the Geometric Alignment
Assistant Spreadsheets ..................................................................................18
Figure 3-4: Data Entry Assistant Pop-Up Window .........................................................19
Figure 3-5: Screenshot of the Highway Editor of IHSDM..............................................20
Figure 4-1: Locations of the Three Selected Two-Lane Rural Highway Sections..........22
Figure 4-2: Photos of the US-40 Study Section in Summer 2005 ...................................23
Figure 4-3: Photos of the US-40 Study Section in Winter 2006 .....................................24
Figure 4-4: Location of the US-40 Study Section ...........................................................24
Figure 4-5: Surrogate Horizontal Alignment of the US-40 Study Section with
Mileposts.......................................................................................................25
Figure 4-6: Plot of CPM Prediction Results of the US-40 Study Section (Number of
Crashes), MP 35-MP 45 (2006-2008), Analyzed with Crash History..........30
Figure 4-7: Plot of CPM Prediction Results of US-40 Study Section (Number of
Crashes), MP 35-MP 45 (2006-2008), Analyzed without Crash History.....30
Figure 4-8: Plot of Crash History of US-40 Study Section (Number of Crashes),
MP 35-MP 45 (2003-2005)...........................................................................31
Figure 4-9: Plot of the Difference Between the CPM Results of US-40 Study
Section in Number of Crashes Analyzed With and Without Crash
History...........................................................................................................31
xiii
Figure 4-10: Plot of CPM Prediction Results of the US-40 Study Section
(Crashes/MVMT), MP 35-MP 45 (2006-2008), Analyzed with Crash
History...........................................................................................................34
Figure 4-11: Plot of CPM Prediction Results of the US-40 Study Section
(Crashes/MVMT), MP 35-MP 45 (2006-2008), Analyzed without
Crash History ................................................................................................35
Figure 4-12: Plot of Crash History of US-40 Study Section (Crashes/MVMT),
MP 35-MP 45 (2003-2005)...........................................................................35
Figure 4-13: Plot of the Difference Between the CPM Results of US-40 Study
Section in Crashes/MVMT Analyzed With and Without Crash History......36
Figure 4-14: Plot of Crashes with Wild Animals in the US-40 Study Section from
2003 to 2005 .................................................................................................42
Figure 4-15: Plot of Non-Animal Crashes in the US-40 Study Section, From 2003 to
2005...............................................................................................................43
Figure 4-16: Plot of Non-Animal Crashes by Direction in the US-40 Study Section,
2003 to 2005 .................................................................................................43
Figure 4-17: Vertical Alignment of the US-40 Study Section...........................................44
Figure 4-18: “Hot Spots" of US-40 Study Section ............................................................45
Figure 4-19: Photos of the US-6 Study Section in Summer 2005 .....................................46
Figure 4-20: Photos of the US-40 Study Section in Fall 2007 ..........................................47
Figure 4-21: Location of the US-6 Study Section .............................................................47
Figure 4-22: Surrogate Horizontal Alignment of the US-6 Study Section with
Mileposts.......................................................................................................49
Figure 4-23: Plot of CPM Prediction Results of the US-6 Study Section (Number of
Crashes), MP 22-MP 28 (2006-2008), Analyzed with Crash History..........51
Figure 4-24: Plot of CPM Prediction Results of the US-6 Study Section (Number of
Crashes), MP 22-MP 28 (2006-2008), Analyzed without Crash History.....51
Figure 4-25: Plot of Crash History of US-6 Study Section (Number of Crashes),
MP 22-MP 28 (2003-2005)...........................................................................52
Figure 4-26: Plot of the Difference Between the CPM Results of US-6 Study
Section in Number of Crashes Analyzed With and Without Crash
History...........................................................................................................52
xiv
Figure 4-27: Plot of CPM Prediction Results of the US-6 Study Section
(Crashes/MVMT), MP 22-MP 28 (2006-2008), Analyzed with Crash
History...........................................................................................................55
Figure 4-28: Plot of CPM Prediction Results of the US-6 Study Section
(Crashes/MVMT), MP 22-MP 28 (2006-2008), Analyzed without
Crash History ................................................................................................55
Figure 4-29: Plot of Crash History of US-6 Study Section (Crashes/MVMT),
MP 22-MP 28 (2003-2005)...........................................................................56
Figure 4-30: Plot of the Difference Between the CPM Results of US-6 Study Section
in Crashes/MVMT Analyzed With and Without Crash History...................56
Figure 4-31: Photos of the SR-150 Study Section in Summer 2005 .................................60
Figure 4-32: Photos of the SR-150 Study Section in Fall 2007.........................................60
Figure 4-33: Location of the SR-150 Study Section..........................................................60
Figure 4-34: Surrogate horizontal Alignment of the SR-150 Study Section with
Mileposts.......................................................................................................68
Figure 4-35: Plot of CPM Prediction Results of the SR-150 Study Section
(Number of Crashes), MP 0.7-MP 16.4 (2006-2008), Analyzed with
Crash History ................................................................................................72
Figure 4-36: Plot of CPM Prediction Results of the SR-150 Study Section
(Number of Crashes), MP 0.7-MP 16.4 (2006-2008), Analyzed without
Crash History ................................................................................................72
Figure 4-37: Plot of Crash History of SR-150 Study Section (Number of Crashes),
MP 0.7-MP 16.4 (2003-2005).......................................................................73
Figure 4-38: Plot of the Difference Between the CPM Results of SR-150 Study
Section in Number of Crashes Analyzed With and Without Crash
History...........................................................................................................73
Figure 4-39: Plot of CPM Prediction Results of the SR-150 Study Section
(Crashes/MVMT), MP 0.7-MP 16.4 (2006-2008), Analyzed with Crash
History...........................................................................................................78
Figure 4-40: Plot of CPM Prediction Results of the SR-150 Study Section
(Crashes/MVMT), MP 0.7-MP 16.4 (2006-2008), Analyzed without
Crash History ................................................................................................78
Figure 4-41: Plot of Crash History of SR-150 Study Section (Crashes/MVMT),
MP 0.7-MP 16.4 (2003-2005).......................................................................79
xv
Figure 4-42: Plot of the Difference Between the CPM Results of SR-150 Study
Section in Crashes/MVMT Analyzed With and Without Crash History......79
Figure 5-1: Location of the Intersections of US-6, SR-174, and SR-136........................86
Figure 5-2: Plot of the Intersections of US-6, SR-174, and SR-136 ...............................87
Figure 5-3: Photos of the Intersections, during summer 2005.........................................88
Figure 5-4: Photos of the Intersections, during winter 2007 ...........................................88
xvi
1 Introduction
Due to the importance of rural highways and the role they play in state’s highway
network, monitoring their safety has been a major task for transportation engineers in the
United States. Throughout time, transportation engineers have been using different
methods available to them to conduct safety audits of rural highways. As the population
grows and as the trips made on rural highways increases, a more advanced, systematic
method of monitoring the safety of rural highways is urgently needed. The Federal
Highway Administration (FHWA) recognized this need and developed a suite of software
programs called the Interactive Highway Safety Design Model (IHSDM) in order to
provide digital assistance for analyzing safety problems of existing and planned rural
two-lane highways.
1.1
Purpose and Scope of the Study
Reducing crashes on highways has always been one of the most important tasks
for transportation engineers while they are in the process of planning, design,
construction, and maintenance. Providing a safe driving environment is indeed not only a
responsibility, but also the highest priority for all highway projects.
Traditionally transportation engineers have to manually check their design to see
if all the values used for design are in compliance with all the federal, state, and local
policies, or if average drivers and pedestrians could comprehend their design. FHWA
recognized the deficiency of the traditional method and the need for a more systematic
method that assists transportation engineers using modern technologies, and began
developing IHSDM in 1995. A concise description of IHSDM is posted in its official
website, “IHSDM is a decision-support tool. It checks existing or proposed two-lane rural
1
highway designs against relevant design policy values and provides estimates of a
design’s expected safety and operational performance. IHSDM results support decision
making in the highway design process,” (FHWA 2006). As IHSDM was further
developed, the Utah Department of Transportation (UDOT) decided to evaluate IHSDM
to see if it could be incorporated in their safety audit program for two-lane rural
highways.
A Road Safety Audit (RSA) is “the formal safety performance examination of an
existing or future road or intersection by an independent, multidisciplinary team. It
qualitatively estimates and reports on potential road safety issues and identifies
opportunities for improvements in safety for all road users,” (FHWA 2008). The goal of
an RSA is to answer the following two questions (FHWA 2008):
•
What elements of the road may present a safety concern: to what extent, to
which road users, and under what circumstances?
•
What opportunities exist to eliminate or mitigate identified safety concerns?
The purpose for this research is to evaluate the capability of IHSDM in helping
transportation engineers to locate highway segments with high crash rates and to predict
crash rates for improvement alternatives. After discussing the research with the members
of the Technical Advisory Committee (TAC), which was set up for the study and
consisted of selected UDOT engineers, two IHSDM modules were selected for
evaluation: the Crash Prediction Module (CPM) and the Intersection Review Module
(IRM).
The scope of this study includes the analysis of three two-lane rural highway
sections by CPM and two intersections by IRM in order to test their applicability to
UDOT’s safety audit process. Some of the selected highway segments have had
significantly high crash rates; therefore, this study also provides UDOT engineers an
evaluation of these problematic highway sections.
1.2
The Current Application of IHSDM
UDOT is not the first public agency to recognize the potential use of IHSDM.
There have been several engineering projects that have adopted IHSDM in their safety
2
evaluations. Mike Dimaiuta, the IHSDM development project manager at the TurnerFairbank Highway Research Center in McLean, Virginia (Dimaiuta 2006), provided the
author of this thesis a list of state DOTs and other organizations that have already utilized
IHSDM to enhance the safety of two-lane rural highways. Table 1-1 lists some of the
engineering projects that have used IHSDM.
Table 1-1: Engineering Projects that Adopted IHSDM
Project Name
Fernan Lake Road
Improvement Project
US 119 Pine Mountain
Improvements
Statewide Projects
Indian Reservation Roads
(IRR) Database and
Model Development,
Task 7
Road Safety Audits: The
FHWA Case Study
Program
Application of the
IHSDM: A Case Study
Highway 26 Road Safety
and Operational Review
Organization(s)
FHWA Western
Federal Land
Kentucky
Transportation Center
for the Kentucky
Transportation
Cabinet
Washington
Department of
Transportation
Web Address
/>jects/fernan/
/>KTC_04_31_FR121_02_2I.pdf
/>esign/ihsdm/
Mountain-Plains
Consortium (MPC)
/>ex.php?proj=MPC-3
Hamilton Associates,
BMI and FHWA
/>urces/TRB06.pdf
Kittelson &
Associates, Inc.
/>t/view/default.asp?lbid=760602
/>hpro/index.php?q=IHSDM&sear
ch=Search
Delphi-MRC
In these projects, IHSDM was used mostly to evaluate road geometric design and
perform crash prediction analysis. For example, the US-119 Pine Mountain
Improvements Project used IHSDM to evaluate the safety of the road after implementing
changes in alignments, and the road safety audits conducted by the FHWA Case Study
Program also utilized the features of IHSDM to conduct safety audits.
3