An indoor navigation systems for smartphones
Bạn đang xem bản rút gọn của tài liệu. Xem và tải ngay bản đầy đủ của tài liệu tại đây (17.54 MB, 80 trang )
An Indoor Navigation System For
Smartphones
Abhijit Chandgadkar
Department of Computer Science
Imperial College London
June 18, 2013
Abstract
Navigation entails the continuous tracking of the user’s position and his
surroundings for the purpose of dynamically planning and following a route
to the user’s intended destination. The Global Positioning System (GPS)
made the task of navigating outdoors relatively straightforward, but due to
the lack of signal reception inside buildings, navigating indoors has become
a very challenging task. However, increasing smartphone capabilities have
now given rise to a variety of new techniques that can be harnessed to solve
this problem of indoor navigation.
In this report, we propose a navigation system for smartphones capable
of guiding users accurately to their destinations in an unfamiliar indoor environment, without requiring any expensive alterations to the infrastructure
or any prior knowledge of the site’s layout.
We begin by introducing a novel optical method to represent data in
the form of markers that we designed and developed with the sole purpose
of obtaining the user’s position and orientation. Our application incorporates the scanning of these custom-made markers using various computer
vision techniques such as the Hough transform and the Canny edge detection. In between the scanning of these position markers, our application uses
dead reckoning to continuously calculate and track the user’s movements.
We achieved this by developing a robust step detection algorithm, which
processes the inertial measurements obtained from the smartphone’s motion
and rotation sensors. Then we programmed a real-time obstacle detector using the smartphone camera in an attempt to identify all the boundary edges
ahead and to the side of the user. Finally, we combined these three components together in order to compute and display easy-to-follow navigation
hints so that our application can effectively direct the user to their desired
destination.
Extensive testing of our prototype in the Imperial College library revealed
that, on most attempts, users were successfully navigated to their destinations within an average error margin of 2.1m.
Acknowledgements
I would like to thank Dr. William J. Knottenbelt for his continuous support
and guidance throughout the project. I would also like to thank Prof. Duncan
Gillies for his initial feedback and assistance on computer vision. I would
also like to thank Tim Wood for his general advice on all aspects of the
project. I would also like to thank all the librarians on the third floor of the
Imperial College central library for allowing me to use their area to conduct
my experiments. Finally, I would like to thank all my family and friends who
helped me test my application.
Contents
1 Introduction
1.1 Motivation . .
1.2 Objectives . .
1.3 Contributions
1.4 Report outline
.
.
.
.
.
.
.
.
.
.
.
.
.
.
.
.
.
.
.
.
.
.
.
.
.
.
.
.
.
.
.
.
.
.
.
.
.
.
.
.
.
.
.
.
.
.
.
.
.
.
.
.
.
.
.
.
.
.
.
.
.
.
.
.
.
.
.
.
.
.
.
.
.
.
.
.
.
.
.
.
.
.
.
.
.
.
.
.
.
.
.
.
.
.
.
.
.
.
.
.
.
.
.
.
.
.
.
.
3
3
4
5
6
2 Background
2.1 Smartphone development overview
2.2 Related work . . . . . . . . . . . .
2.3 Computer vision . . . . . . . . . .
2.3.1 Hough Transform . . . . . .
2.3.2 Gaussian smoothing . . . .
2.3.3 Canny edge detection . . . .
2.3.4 Colour . . . . . . . . . . . .
2.3.5 OpenCV . . . . . . . . . . .
2.4 Positioning . . . . . . . . . . . . .
2.4.1 Barcode scanning . . . . . .
2.4.2 Location fingerprinting . . .
2.4.3 Triangulation . . . . . . . .
2.4.4 Custom markers . . . . . . .
2.5 Obstacle detection . . . . . . . . .
2.6 Dead reckoning . . . . . . . . . . .
2.6.1 Inertial sensors . . . . . . .
2.6.2 Ego-motion . . . . . . . . .
2.7 Digital signal filters . . . . . . . . .
.
.
.
.
.
.
.
.
.
.
.
.
.
.
.
.
.
.
.
.
.
.
.
.
.
.
.
.
.
.
.
.
.
.
.
.
.
.
.
.
.
.
.
.
.
.
.
.
.
.
.
.
.
.
.
.
.
.
.
.
.
.
.
.
.
.
.
.
.
.
.
.
.
.
.
.
.
.
.
.
.
.
.
.
.
.
.
.
.
.
.
.
.
.
.
.
.
.
.
.
.
.
.
.
.
.
.
.
.
.
.
.
.
.
.
.
.
.
.
.
.
.
.
.
.
.
.
.
.
.
.
.
.
.
.
.
.
.
.
.
.
.
.
.
.
.
.
.
.
.
.
.
.
.
.
.
.
.
.
.
.
.
.
.
.
.
.
.
.
.
.
.
.
.
.
.
.
.
.
.
.
.
.
.
.
.
.
.
.
.
.
.
.
.
.
.
.
.
.
.
.
.
.
.
.
.
.
.
.
.
.
.
.
.
.
.
.
.
.
.
.
.
.
.
.
.
.
.
.
.
.
.
.
.
.
.
.
.
.
.
.
.
.
.
.
.
.
.
.
.
.
.
.
.
.
.
.
.
.
.
.
.
.
.
.
.
.
.
.
.
7
7
8
9
9
10
11
12
13
14
14
15
15
15
16
17
17
19
20
3 Position markers
3.1 Alternate positioning systems
3.2 Marker design . . . . . . . . .
3.3 Image gathering . . . . . . . .
3.4 Circle detection . . . . . . . .
.
.
.
.
.
.
.
.
.
.
.
.
.
.
.
.
.
.
.
.
.
.
.
.
.
.
.
.
.
.
.
.
.
.
.
.
.
.
.
.
.
.
.
.
.
.
.
.
.
.
.
.
.
.
.
.
.
.
.
.
21
21
22
25
25
1
.
.
.
.
.
.
.
.
.
.
.
.
3.5
3.6
Angular shift . . . . . . . . . . . . . . . . . . . . . . . . . . . 27
Data extraction . . . . . . . . . . . . . . . . . . . . . . . . . . 30
4 Obstacle detection
32
4.1 Boundary detection . . . . . . . . . . . . . . . . . . . . . . . . 32
4.2 Obstacle detection . . . . . . . . . . . . . . . . . . . . . . . . 33
5 Dead reckoning
5.1 Initial approach . . . . . . . . .
5.2 Sensors . . . . . . . . . . . . . .
5.2.1 Linear acceleration . . .
5.2.2 Rotation vector . . . . .
5.3 Signal filtering . . . . . . . . . .
5.4 Footstep detection . . . . . . .
5.5 Distance and direction mapping
6 Integration of navigation
6.1 Location setup . . . .
6.2 Final integration . . .
6.3 System architecture . .
.
.
.
.
.
.
.
.
.
.
.
.
.
.
.
.
.
.
.
.
.
.
.
.
.
.
.
.
.
.
.
.
.
.
.
.
.
.
.
.
.
.
.
.
.
.
.
.
.
.
.
.
.
.
.
.
.
.
.
.
.
.
.
.
.
.
.
.
.
.
.
.
.
.
.
.
.
.
.
.
.
.
.
.
.
.
.
.
.
.
.
.
.
.
.
.
.
.
.
.
.
.
.
.
.
.
.
.
.
.
.
.
.
.
.
.
.
.
.
38
38
41
42
42
44
45
47
system
48
. . . . . . . . . . . . . . . . . . . . . . 48
. . . . . . . . . . . . . . . . . . . . . . 49
. . . . . . . . . . . . . . . . . . . . . . 52
7 Evaluation
7.1 Evaluating position markers . . . . . . . . . . .
7.2 Evaluating our obstacle detection algorithm . .
7.3 Evaluating our dead reckoning algorithm . . . .
7.3.1 Pedometer accuracy . . . . . . . . . . .
7.3.2 Positioning accuracy . . . . . . . . . . .
7.4 Evaluating the integration of navigation system
7.4.1 Test location setup . . . . . . . . . . . .
7.4.2 Quantitative analysis . . . . . . . . . . .
7.4.3 Qualitative analysis . . . . . . . . . . . .
7.5 Summary . . . . . . . . . . . . . . . . . . . . .
.
.
.
.
.
.
.
.
.
.
.
.
.
.
.
.
.
.
.
.
.
.
.
.
.
.
.
.
.
.
.
.
.
.
.
.
.
.
.
.
.
.
.
.
.
.
.
.
.
.
.
.
.
.
.
.
.
.
.
.
.
.
.
.
.
.
.
.
.
.
.
.
.
.
.
.
.
.
.
.
55
55
58
59
59
61
63
63
64
66
67
8 Conclusion
69
8.1 Summary . . . . . . . . . . . . . . . . . . . . . . . . . . . . . 69
8.2 Future work . . . . . . . . . . . . . . . . . . . . . . . . . . . . 70
A Hough line transform example
2
76
Chapter 1
Introduction
Navigation is the process of accurately establishing the user’s position and
then displaying directions to guide them through feasible paths to their desired destination. The Global Positioning System (GPS) is the most common
and the most utilised satellite navigation system. Almost every aircraft and
ship in the world employs some form of GPS technology. In the past few
years, smartphones have evolved to contain a GPS unit, and this has given
rise to location-based mobile applications such as geofencing and automotive navigation for the common user. However, GPS has its limitations. In
particular we are concerned with the lack of GPS signal reception in indoor
environments. GPS satellites fail to deliver a signal to a device if there is
a direct obstruction on its path. Therefore we have to consider alternate
methods of achieving indoor navigation on a smartphone.
1.1
Motivation
Our motivation for this project stems from the fact that people are increasingly relying upon their smartphones to solve some of their common daily
problems. One such problem that smartphones have not yet completely
solved is indoor navigation. At the time of writing, there is not a single lowcost scalable mobile phone solution available in the market that successfully
navigated a user from one position to another indoors.
An indoor navigation app would certainly benefit users who are unfamiliar with a place. Tourists, for instance, would have a better experience if
they could navigate confidently inside a tourist attraction without any assistance. In places such as museums and art galleries, the application could
be extended to plan for the most optimal or ‘popular’ routes. Such a system
could also be integrated at airports to navigate passengers to their boarding
3
gates. Similarly an indoor navigation system could also benefit local users
who have previously visited the location but are still unaware of the whereabouts of some of the desired items. These include supermarkets, libraries
and shopping malls. The application could also benefit clients who install the
system by learning user behaviours and targeting advertisements at specific
locations.
1.2
Objectives
The objective of this project was to build a robust and flexible smartphone
based indoor navigation system that met the following four criteria:
• High accuracy: The application should consistently guide users to their
destinations within a reasonable distance.
• Low-cost: The application should not require any expensive infrastructural changes to obtain accurate positioning data. Clients will not be
interested in large investments unless they financially benefit from it.
Future maintenance costs on these equipment may further deter the
choice of this solution.
• No pre-loaded indoor maps: The application should be able to navigate
the user without requiring a pre-loaded map of the environment. Plotting the layout of a site is cumbersome and can diminish the flexibility
of a solution. Only the position of the items/point of interests may be
stored with respect to a site’s frame of reference.
• Intuitive user interface (UI): The application should have an easy-to-use
UI that displays navigation hints correctly based on the user’s current
state. The application should also take into account the obstacles surrounding the user to avoid displaying any incorrect hints. For instance,
it should not tell users to go straight if there is an obstacle immediately
ahead of them.
From our research we realised that various smartphone based solutions
exist that accurately determine a user’s current position. Some of them
require no additional infrastructural changes while some even display navigation hints to the user. However none of these solutions integrate all the
desired aspects of an indoor navigation system to meet the four criteria mentioned above.
4
1.3
Contributions
In this report we present an indoor navigation system for smartphones, which
uses a combination of computer vision based techniques and inertial sensors
to accurately guide users to their desired destinations. Our solution entails
the scanning of custom-made markers in order to calibrate the user’s position
during navigation. Then it employs a dead reckoning algorithm to approximate user movements from the last known point. Finally our application
uses this information along with an integrated vision based obstacle detector
to display correct directions in real-time leading to the user’s destination.
Our indoor navigation solution required the study and development of
three individual components prior to their integration:
1. Position markers: These are custom markers that our application is capable of scanning from any angle using the smartphone camera. Colour
is used to encode position data along with a direction indicator to obtain the angle of scanning. These markers were used to calibrate the
user’s position and orientation. OpenCV functions were used to detect
circles and other features from the camera preview frames to decode
these markers.
2. Obstacle detection: Our application detects obstacles in the environment in real-time using the smartphone camera. The purpose of this
task was to avoid giving users directions towards a non-feasible path.
The Hough line transform was primarily used for detecting all the
boundary edges from the incoming preview frames.
3. Dead reckoning: Our application uses inertial dead reckoning to estimate the position and orientation of the user from the last scanned
position marker. This enabled the application to always keep track of
the user’s position and also notify them if they reach their destination.
To achieve this, the accelerometer signal was first pre-processed to reduce noise and then analysed for step detection. This was combined
with the device’s orientation to develop our algorithm.
The final application features the integration of these three components,
as shown in figure 1.1, in order to calculate and correctly navigate the user
to the next best position that would eventually lead them to their desired
destination. Results from our evaluation demonstrated that our end product
achieved just over 2m accuracy with the help of only eight position markers
over a testing area of 25mx15m. In addition, we did not have to provide our
application with an indoor map of the site.
5
Figure 1.1: The image shows how all the main components integrate to
make the final indoor navigation system
1.4
Report outline
Our entire report is structured on the basis of the three individual components mentioned in section 1.3 and their integration. Chapter 2 describes
some of the related work in this domain and provides a technical background
analysis of the various concepts required to achieve our solution. Chapters 3, 4 and 5 provide an in-depth explanation of our implementation for
the position markers, our vision based obstacle detection mechanism and our
dead reckoning algorithm respectively. Chapter 6 describes our approach to
integrating these three components together as well as gives an overview of
the entire system. Chapter 7 evaluates each of the individual components
separately and then follows it up with a quantitative and qualitative analysis
of the final product.
6
Chapter 2
Background
In this chapter, we begin by giving a brief overview on our choice of smartphone platform. Then we discuss some of the existing state-of-the-art research carried out in the domain of indoor navigation. We also assess why
none of the current proposals meet our objective criteria. After that, we study
various computer vision concepts that will be relevant across this entire report. Finally, we assess individually some of the related work conducted for
the three components mentioned in section 1.3.
2.1
Smartphone development overview
We chose to develop the application on the Android platform due to the
increasing number of Android users across the globe, the strong online community and fewer developer restrictions. In addition we also had previous
programming experience on Android, and therefore we were familiar with
most of their APIs. The prototype for our proposed solution would be developed and tested on the Samsung Galaxy S4. The smartphone’s 13-megapixel
camera and its two quad-core central processing units (CPU) further enhanced the performance of our application.
Sensors would also be crucial for our application. Most Android-powered
devices have built-in sensors that measure the motion and the orientation
of the device. In particular, we analysed the raw data retrieved from the
accelerometer and the rotation vector. The accelerometer gives us a measure
of the acceleration force in m/s2 applied to the device on all the three physical
axes (x, y, z). The rotation vector fuses the accelerometer, magnetic field and
gyroscope sensors to calculate the degree of rotation on all the three physical
axes (x, y, z)[10].
7
2.2
Related work
In the past few years, a great amount of interest has been shown to develop
indoor navigation systems for the common user. Researchers have explored
possibilities of indoor positioning systems that use Wi-Fi signal intensities
to determine the subjects position[14][4]. Other wireless technologies, such
as bluetooth[14], ultra-wideband (UWB)[9] and radio-frequency identification (RFID)[31], have also been proposed. Another innovative approach uses
geo-magnetism to create magnetic fingerprints to track position from disturbances of the Earths magnetic field caused by structural steel elements in the
building[7]. Although some of these techniques have achieved fairly accurate
results, they are either highly dependent on fixed-position beacons or have
been unsuccessful in porting the implementation to a ubiquitous hand-held
device.
Many have approached the problem of indoor localisation by means of
inertial sensors. A foot-mounted unit has recently been developed to track
the movement of a pedestrian[35]. Some have also exploited the smartphone accelerometer and gyroscope to build a reliable indoor positioning
system. Last year, researchers at Microsoft claim they have achieved metrelevel positioning accuracy on a smartphone device without any infrastructure
assistance[17]. However, this system relies upon a pre-loaded indoor floor
map and does not yet support any navigation.
An altogether different approach applies vision. In robotics, simultaneous
localisation and mapping (SLAM) is used by robots to navigate in unknown
environments[8]. In 2011, a thesis considered the SLAM problem using inertial sensors and a monocular camera[32]. It also looked at calibrating an
optical see-through head mounted display with augmented reality to overlay
visual information. Recently, a smartphone-based navigation system was developed for wheelchair users and pedestrians using a vision concept known
as ego-motion[19]. Ego-motion estimates a cameras motion by calculating
the displacement in pixels between two image frames. Besides providing the
application with an indoor map of the location, the method works well under
the assumption that the environment has plenty of distinct features.
Localisation using markers have also been proposed. One such technique
uses QR codes1 to determine the current location of the user[13]. There is
also a smartphone solution, which scans square fiducial markers in real time
to establish the user’s position and orientation for indoor positioning[24].
Some have even looked at efficient methods to assign markers to locations
for effective navigation[6]. Although, scanning markers provide high precision
1
www.qrcode.com
8
positioning information, none of the existing techniques have exploited the
idea for navigation.
Finally, we also looked at existing commercial indoor navigation systems
available on the smartphone. Aisle411 (aisle411.com) provided a scalable
indoor location and commerce platform for retailers, but only displayed indoor store maps of where items were located to the users without any sort
of navigation hints. The American Museum of Natural History also released
a mobile app (amnh.org/apps/explorer) for visitors to act as their personal
tour guide. Although, the application provides the user with turn-by-turn
directions, it uses expensive Cisco mobility services engines to triangulate
the device’s position.
2.3
Computer vision
Computer vision is the study of concepts behind computer-based recognition
as well as acquiring images and extracting key features from them. Our
application heavily relies on some of these concepts. In particular, we are
concerned with shape identification, edge detection, noise reduction, motion
analysis and colour.
2.3.1
Hough Transform
The Hough transform is used to detect curves such as lines, circles, ellipses,
etc. in an image. The idea behind Hough line transform is that every point
in a binary image is treated as a point on a line that we are trying to detect.
Therefore, it models all the different line equations that pass through that
point and finds the line equation that has the most number of binary points.
Hough line transform
An equation of a line expressed in the Cartesian system looks as follows.
y = mx + c
In the polar coordinate system, we use the parameters r and θ to write
the line equation as follows.
r = xcos(θ) + ysin(θ)
Then for every non-zero pixel in the binary image, we model all the possible
line equations that pass through that point between r > 0 and 0 ≤ θ ≤ 2
A simple mathematical calculation of how a Hough line transform finds
the equation of a detected line is given in Appendix A.
9
Hough circle transform
The Hough circle transform is similar to the Hough transform for detecting straight lines. An equation of a circle is characterised by the following
equation.
(x − xc )2 + (y − yc )2 = r2
In order to detect circles in a given image, the centre coordinate (xc , yc ) of
the circle and its radius r have to be identified. As three different parameters,
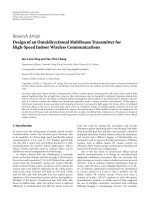
xc , yc and r, are modelled, the graph would have 3-dimensions. Each nonzero pixel in the binary image will produce a conical surface as shown in
figure 2.12 .
Figure 2.1: The image shows a cone formed by modelling all the possible
radius of a circle with the centre point at a 2D coordinate
Once again, this process will be repeated for every non-zero pixel point
and will result in several such cones plotted on the graph. This can conveniently be represented in a three-dimensional matrix. When the number
of intersections exceeds a certain threshold, we consider the detected threedimensional coordinate as our centre and radius.
2.3.2
Gaussian smoothing
Smoothing is an image processing operation primarily used to reduce noise.
Filters are generally used to smooth (blur) an image. A filter uses a matrix
of coefficients, called the kernel, and neighbouring pixel values to calculate
the new intensity for every pixel in a given image. Amongst many different
2
The image is taken from
talkHough/HoughLecCircles.html
/>
10
filters, Gaussian filters are perhaps the most useful in our application. They
are typically used to reduce image noise prior to edge detection.
The theory behind Gaussian filters stem from the following two-dimensional
Gaussian function, studied in statistics, where µ is the mean and σ is the
variance for variables x and y.
−
f (x, y) = Ae
(x − µx )2 (y − σy )2
+
2µ2x
2σy2
This formula produces a convolution matrix, called the Gaussian kernel,
with values that decrease as the spatial distance increases from the centre
point. Figure 2.2 can help to visualise the spread of the weights for a given
pixel and its neighbours.
Figure 2.2: The image shows a plot of a two dimensional Gaussian function
When a Gaussian filter is applied to an image, each pixel intensity is
convoluted with the Gaussian kernel and then added together to output the
new filtered value for that pixel. This filter can be applied with different
kernel sizes resulting in different levels of blurring. The larger the kernel
size, the more influence the neighbouring pixels will have on the final image.
2.3.3
Canny edge detection
To detect edges, the intensity gradient of each pixel is examined to see if
an edge passes through it or close to it. The most “optimal” edge detection
technique was developed by John Canny in 1986[5]. The algorithm consists
of four key stages.
1. Noise reduction - The Canny edge detector is highly sensitive to
noisy environments. Therefore, a Gaussian filter is initially applied to
the raw image before further processing.
11
2. Finding the intensity gradient - To determine the gradient strength
and direction, convolution masks used by edge detection operators such
as Sobel (shown below) are applied to every pixel in the image. This
yields the approximate gradient in the horizontal and vertical directions.
−1 0 1
1
2
1
0
0
Gx = −2 0 2 Gy = 0
−1 0 1
−1 −2 −1
The gradient strength/magnitude can then be calculated using the law
of Pythagoras.
G = G2x + G2y
The direction of the edge can also be quickly determined.
θ = tan−1
Gy
Gx
This angle is then rounded to one of 0◦ , 45◦ , 90◦ or 135◦ corresponding
to horizontal, vertical and diagonal edges.
3. Non-maximum suppression - The local maxima from the calculated
gradient magnitudes and directions are preserved whereas the remaining pixels are removed. This has the effect of sharpening blurred edges.
4. Edge tracking using hysteresis thresholding - Double thresholding is used to distinguish between strong, weak and rejected edge pixels.
Pixels are considered to be strong if their gradient lies above the upper
threshold. Similarly, pixels are suppressed if their gradient is below the
lower threshold. The weak edge pixels have intensities between the two
thresholds. The result is a binary image with edges preserved if they
contain either strong pixels or weak pixels connected to strong pixels.
2.3.4
Colour
Colours have been previously used to encode data. Microsoft’s High Capacity
Color Barcode (HCCB) technology encodes data using clusters of coloured
triangles and is capable of decoding them in real-time from a video stream[36].
Although their implementation is very complex, we can use the basic concept
behind HCCB in our application.
12
Each distinct colour can be used to represent a certain value. Colours can
be grouped together in a set format to encode a series of values. We have to
take into account that smartphone cameras cannot distinguish between small
variations of a certain colour in non-ideal situations, such as light green or
dark green. Therefore we would be limited on the number of discrete values
we can encode. Colour is typically defined using the “Hue Saturation Value”
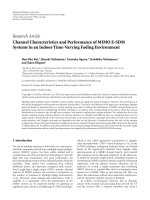
(HSV) model or the “Red Green Blue” (RGB) model.
Figure 2.3: The left image shows the HSV model and the right image shows
the RGB model. They both describe the same thing but with different
parameters
The HSV model is more appropriate for the identification and comparison
of colours. The difference in the hue component makes it easier to determine
which range a colour belongs to. For example, the colour red has a hue
component of 0 ± 15 while green has a hue component of 120 ± 15.
2.3.5
OpenCV
Open Source Computer Vision (OpenCV) is a library of programming functions for real time computer vision. It is released under a BSD license allowing
us to use many of their optimised algorithms for academic and commercial
purposes[27]. The library is cross-platform and ports to all the major mobile
operating systems. For Android, the OpenCV manager app needs to be installed on the testing device prior to development. It is an Android service
targeted to manage OpenCV library binaries on end users devices[26].
The library supports the calculation of Hough transforms, Canny edge
detection and optical flow. It also provides various smoothing operations
including Gaussian smoothing, as well as image conversion between RGB,
HSV and grayscale. These algorithms are highly optimised and efficient, but
they only produce real-time performance for low resolution images.
13
2.4
Positioning
In order to develop a navigation system, the application needs to be aware
of the user’s position. There are numerous methods available that solve
the indoor positioning problem but we had to only consider those that were
accessible on a smartphone device, and would minimise the number of infrastructure changes.
2.4.1
Barcode scanning
Barcodes could be placed in various locations across the building, encoded
with their respective grid coordinates. The smartphone camera could then
be used to take a picture of the barcode and decode the encoded data.
The simplest type of linear barcode is Code 39. To encode a given piece of
data, a Code 39 encoding table is used. It contains the mapping between the
43 accepted symbols and their unique 12-bit binary code where ‘1’ stands for
a black bar and ‘0’ stands for a white space of equivalent width. The same
symbol can be described using another format based on width encoding. So
narrow (N) represents a thinner bar/space (1/0) while wide (W) represents
a broader bar/space (11/00). The barcode encoding for the ‘*’ symbol is
always used as the start and stop character to determine the direction of the
barcode. In addition, a white space is always encoded between the characters
in a barcode.
Users can regularly scan these position barcodes to keep the application up to date with the user’s last position. Open-source barcode scanning libraries are available for smartphones and support the scanning of
Code 39 barcodes. ZXing is very popular amongst the Android and iPhone
developers[33]. It has a lot of support online and it is well documented. The
other major advantage of using barcodes is that they are cheap to produce
and can store any type of static data. However, for a navigation application,
directions needed to be provided from the moment a user scans a barcode.
Therefore, we would need to determine the user’s orientation at the point
of scanning. We cannot encode such information in any type of barcode.
Another drawback with using barcode scanning libraries is their integration
with the rest of the application. If our application has to scan barcodes, detect obstacles and provide users with correct directions all at the same time,
we would need to thoroughly understand and modify the barcode scanning
library to be able to extend and integrate it.
14
2.4.2
Location fingerprinting
Location fingerprinting is a technique that compares the received signal
strength (RSS) from each wireless access point in the area with a set of
pre-recorded values taken from several locations. The location with the closest match is used to calculate the position of the mobile unit. This technique
is usually broken down in to two phases[36]:
1. Offline sampling - Measuring and storing the signal strength from
different wireless routers at selected locations in the area
2. Online locationing - Collecting signal strength during run time and
using data from the offline samples to determine the location of the
mobile device
With a great deal of calibration, this solution can yield very accurate
results. However, this process is time-consuming and has to be repeated at
every new site.
2.4.3
Triangulation
Location triangulation involves calculating the relative distance of a mobile
device from a base station and using these estimates to triangulate the user’s
position[16]. Distance estimates are made based on the signal strength received from each base station. In order to resolve ambiguity, a minimum of
three base stations are required.
In free space, the received signal strength (s) is inversely proportionate
to the square of the distance (d) from the station to the device.
1
d2
Signal strength is affected by numerous factors such as interference from
objects in the environment, walking, multipath propagation3 , etc. Therefore, in non-ideal conditions, different models of path attenuation need to be
considered.
s∝
2.4.4
Custom markers
Markers can be designed tailored to meet our application requirements. Besides encoding the position coordinates, they could be extended to encode
fiducial objects that allow the calculation of the user’s orientation at the
3
Multipath propagation causes signal to be received from two or more paths
15
Figure 2.4: The image shows the trilateration of a device using the signal
strength from three nearby cell towers
point of scanning. We would need to define our own encoding technique as
well as develop a scanning application to decode the marker data. In order
to extract key features and interpret the scanned image, we would need to
apply some of the computer vision concepts mentioned in section 2.3
2.5
Obstacle detection
Our application needs to detect free space around the user in real-time in
order to make a decision on which path (left, right, straight or backwards)
to take in the short-term to reach the destination. For a smartphone implementation, the camera is the only self-contained technology available that
we can exploit for this purpose.
Depth sensors are commonly used in Robotics[23] to avoid obstructions
but very few have explored the problem using vision. A popular application
of this problem is in road detection to aid autonomous driving. The approach
taken by[30] computes the vanishing point to give a rough indication of the
road geometry. Offline machine learning techniques have also been developed
that use geometrical information to identify the drivable area[2]. However,
the idea behind outdoor free space detection does not work well indoors due
16
to the absence of a general geometric pattern and the irregular positioning
of challenging structures.
An interesting approach taken by a group in the 2003 RoboCup involved
avoiding obstacles using colour[12]. Although this is a relatively straightforward solution and achieves a fast and accurate response, it restricts the
use of an application to a certain location and is prone to ambiguous errors caused by other similar coloured objects in the environment. Another
impressive piece of work combines three visual cues from a mobile robot to
detect horizontal edges in a corridor to determine whether they belong to a
wall-floor boundary[18]. However, the algorithm fails when strong textures
and patterns are present on the floor.
There has been very little emphasis on solving the problem on a smartphone mainly due to the high computational requirements. There is nevertheless one mobile application tailored for the visually impaired that combines
colour histograms, edge cues and pixel-depth relationship but works with the
assumption that the floor is defined as a clear region without any similarities
present in the surrounding environment[29].
There is currently a vast amount of research being conducted in this area.
However, our focus was driven towards building a navigation system and not
a well-defined free space detector. Therefore, for our application, we have
adopted some of the vision concepts mentioned in literature such as boundary
detection.
2.6
Dead reckoning
Given the initial position, our application needs to be aware of the user’s
displacement and direction to be able to navigate them to their destination.
This process is known as dead reckoning. On a smartphone, there are two
possible ways to accomplish this task without being dependent on additional
hardware components.
2.6.1
Inertial sensors
The accelerometer sensor provides a measure of the acceleration force on all
the three physical axes (x, y, z). Double integration of this acceleration data
yields displacement as follows
vf = vi + a · t
d = vf · t − 0.5 · a · t2
17
However, due to the random fluctuations in the sensor readings, it is not
yet possible to get an accurate measure of displacement even with filtering4 .
Nevertheless, the accelerometer data can be analysed to detect the number
of footsteps. In that case, a rough estimate of the distance travelled can be
made, provided the user’s stride length is known. Furthermore, the orientation sensor can be employed simultaneously to determine the direction the
user is facing. Using this information, the new position of the user can be
calculated on each step as follows:
xnew = xold + cos(orientation) × stridelength
ynew = yold + sin(orientation) × stridelength
Inertial positioning systems have been very popular in literature. A dead
reckoning approach using foot-mounted inertial sensors has been developed to
monitor pedestrians accurately using zero velocity corrections[35]. A slightly
different solution uses a combination of inertial sensors and seed nodes, arranged in a static network, to achieve real-time indoor localisation[15]. A
smartphone-based pedestrian tracking system has also been proposed in indoor corridor environments with corner detection to correct error drifts[28].
Microsoft also recently developed a reliable step detection technique for indoor localisation[17] using dynamic time warping (DTW). DTW is an efficient way to measure the similarity between two waveforms. Over 10,000
real step data points were observed offline to define the characteristic of a
‘real’ step. A DTW validation algorithm was then applied to the incoming
accelerometer data to see whether it formed a similar waveform to a ‘real’
step.
There are also several pedometer applications available on Android such
as Accupedo[21] and Runtastic[22] but since we do not have access to their
algorithms, we cannot reproduce the same results. However, we did find an
open source pedometer project[3] which calculated distance from the user’s
step length but their implementation was neither efficient nor accurate.
Signal processing is the underlying principle behind any pedometer algorithm. Data received from the accelerometer forms a signal which would
be needs in real-time to accurately detect user movements. This process
initially involves noise filtering in order to cancel out any random fluctuations that may affect processing later on. Refer to section 2.7 for further
details on digital filters. The next step involves detecting peaks and valleys
from the acceleration waveform that correspond to footsteps. Then heuristic
4
/url />
18
constrains and cross-correlation validations need to be applied to eliminate
erroneous detections.
To calculate the direction of movement, we need to also consider the
orientation of the device. This can be calculated using geo-magnetic field
sensors and gyroscopes. However, we need to also convert this orientation
from the world’s frame of reference to the site’s frame of reference.
2.6.2
Ego-motion
An alternate solution to dead reckoning uses a vision concept known as egomotion. It is used to estimate the three-dimensional motion relative to the
static environment from a given sequence of images. Our application can
use the smartphone camera to feed in the live images and process them in
real-time to derive an estimate of the distance travelled.
There has been some interesting work published, in recent times, relating to the application of ego-motion in the field of navigation. A robust
method for calculating the ego-motion of the vehicle relative to the road has
been developed for the purpose of autonomous driving and assistance[34]. It
also integrates other vision based algorithms for obstacle and lane detection.
Ego-motion has also been employed in robotics. A technique that combines
stereo ego-motion and a fixed orientation sensor has been proposed for long
distance robot navigation[25]. The orientation sensor attempts to reduce the
error growth to a linear complexity as the distance travelled by the robot
increases. However there has not been a great amount of work in this topic
using smartphone technology. The only published work that we came across
proposed a self-contained navigation system for wheelchair users with the
smartphone attached to the armrest[19]. For pedestrians it uses step detection instead of ego-motion to measure their movement.
Technically, to compute the ego-motion of the camera, we first estimate
the two-dimensional motion taken from two consecutive image frames. This
process is known as the optical flow. We can use this information to extract
motion in the real-world coordinates. There are several methods to estimate
optical flow amongst which the LucasKanade method[20] is widely used.
In our application, the smartphone camera will be used to take a series of
images for feature tracking. This typically involves detecting all the strong
corners in a given image. Then the optical flow will be applied to find these
corners in the next frame. Usually the corner points do not remain in the
same position and a new variable has to be introduce, which models all the
points within a certain distance of the corner. The point with the lowest is
then regarded as that corner in the second image. Template matching will
then be applied to compare and calculate the relative displacement between
19
the set of corners in the two images. This information can be used to roughly
estimate the distance travelled by the user.
2.7
Digital signal filters
Raw sensor data received from smartphone devices contain random variations caused by interference (noise). In order to retrieve the meaningful
information, digital filters need to be applied to the signal.
A low-pass filter is usually applied to remove high frequencies from a
signal. Similarly, a high-pass filter is used to remove low frequency signals
by attenuating frequencies lower than a cut-off frequency. A band-pass filter
combines a low-pass filter and a high-pass filter to pass signal frequencies
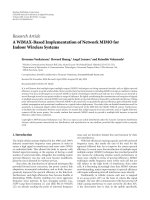
within a given range.
Figure 2.5: The image shows the three types of digital signal filters
Signal data can be analysed in the temporal domain to see the variation in
signal amplitude with time. Alternatively, a signal can be represented in the
frequency-domain to analyse all the frequencies that make up the signal. This
can be useful for filtering certain frequencies of a signal. The transformation
from the time-domain to the frequency-domain is typically obtained using
the discrete Fourier transform (DFT). The fast Fourier transform (FFT) is
an algorithm to compute the DFT and the inverse DFT.
20
Chapter 3
Position markers
We decided to develop our own custom markers with the purpose of obtaining
the position of the user. Several of these markers would be placed on the floor
and spread across the site. In particular, they would be situated at all the
entrances and other points of interest such that application can easily identify
them. Upon scanning, the application would start displaying directions from
that position to their destination.
In this chapter, we start by discussing some of the other alternatives we
considered before deciding to use custom markers and detail our reason as
to why we did not choose any of these options. Then we proceed to describe
the design of the marker specifying what data it encodes and how this data
is represented. Then we start explaining our implementation for the smartphone scanner. Firstly, we explain how we detect the marker boundary using
the Hough circle transform. Then we describe how the angular shift encoded
in the marker helps us to calculate the orientation of the user. Finally, we
explain the process of extracting the position data from the marker.
3.1
Alternate positioning systems
From our background research, we identified four smartphone-based solutions (triangulation, fingerprinting, barcodes and custom markers) that our
application could have used to determine the position of the user, without
requiring any expensive equipment.
A Wi-Fi based triangulation solution would have enabled our application to always keep track of the user’s position without any form of user
interaction, which follows for marker scanning techniques. However, Wi-Fi
signals are susceptible to signal loss due to indoor obstructions, resulting
in an imprecise reading. To overcome this problem, all the different types
21
of interference need to be considered along with the position of each access
point. Since every site is structured differently, complex models for signal
attenuation would need to be developed independently. [1] describes some
further problems with triangulation.
The advantages of location fingerprinting are similar to triangulation.
However, to achieve accurate results, fingerprinting requires a great amount
of calibration work. This is a tedious process and would need to be replicated
on every new site. In addition, several people have already raised privacy
concerns for Wi-Fi access points[11].
At first, we strongly considered the option of placing barcodes around
the site encoded with their respective positions. We even tested a few opensource barcode scanning libraries available on Android. However, we quickly
realised that using an external library would affect its future integration with
other features. Since Android only permits the use of the camera resource
to one single view, we would have been unable to execute the obstacle detection mechanism simultaneously, unless we developed our own scanner. We
could have also potentially extended the barcode scanning library by further
studying and modifying a considerable amount of their codebase. The other
major drawback with using barcodes was the inability to encode direction
data needed to calibrate our application with the site’s frame of reference.
See section 3.2 for further information on this requirement.
Developing custom markers would give us complete control over the design of the marker, the scanning and its integration with the rest of the
system. These custom markers would not only be designed to encode position data but also the direction. The only drawback would be that it takes a
considerable amount of time to develop a bespoke scanner that gives highly
accurate results. Nevertheless, we decided to take this approach as the benefits outweighed the disadvantages.
3.2
Marker design
For our design, we had to ensure that the marker encoded data relating to
its position. We had to also ensure that the scanner was able to calculate
the orientation of the user from the marker. Finally, the marker should be
designed such that it could be scanned from any angle.
We achieved these criteria by encoding two pieces of information in our
position markers:
1. A unique identifier (UID) - This UID will correspond to the coordinate
position of the marker with respect to the site’s Cartesian frame of
reference. A map of UIDs to coordinate positions would be stored
22