Sổ tay kết cấu thép - Section 1
Bạn đang xem bản rút gọn của tài liệu. Xem và tải ngay bản đầy đủ của tài liệu tại đây (298 KB, 40 trang )
1.1
SECTION 1
PROPERTIES OF STRUCTURAL
STEELS AND EFFECTS OF
STEELMAKING AND FABRICATION
R. L. Brockenbrough, P.E.
President, R. L. Brockenbrough & Associates, Inc.,
Pittsburgh, Pennsylvania
This section presents and discusses the properties of structural steels that are of importance
in design and construction. Designers should be familiar with these properties so that they
can select the most economical combination of suitable steels for each application and use
the materials efficiently and safely.
In accordance with contemporary practice, the steels described in this section are given
the names of the corresponding specifications of ASTM, 100 Barr Harbor Dr., West Con-
shohocken, PA, 19428. For example, all steels covered by ASTM A588, ‘‘Specification for
High-strength Low-alloy Structural Steel,’’ are called A588 steel.
1.1 STRUCTURAL STEEL SHAPES AND PLATES
Steels for structural uses may be classified by chemical composition, tensile properties, and
method of manufacture as carbon steels, high-strength low-alloy steels (HSLA), heat-treated
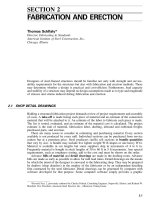
carbon steels, and heat-treated constructional alloy steels. A typical stress-strain curve for a
steel in each classification is shown in Fig. 1.1 to illustrate the increasing strength levels
provided by the four classifications of steel. The availability of this wide range of specified
minimum strengths, as well as other material properties, enables the designer to select an
economical material that will perform the required function for each application.
Some of the most widely used steels in each classification are listed in Table 1.1 with
their specified strengths in shapes and plates. These steels are weldable, but the welding
materials and procedures for each steel must be in accordance with approved methods. Weld-
ing information for each of the steels is available from most steel producers and in
publications of the American Welding Society.
1.1.1 Carbon Steels
A steel may be classified as a carbon steel if (1) the maximum content specified for alloying
elements does not exceed the following: manganese—1.65%, silicon—0.60%, copper—
1.2
SECTION ONE
FIGURE 1.1 Typical stress-strain curves for structural steels. (Curves have
been modified to reflect minimum specified properties.)
0.60%; (2) the specified minimum for copper does not exceed 0.40%; and (3) no minimum
content is specified for other elements added to obtain a desired alloying effect.
A36 steel is the principal carbon steel for bridges, buildings, and many other structural
uses. This steel provides a minimum yield point of 36 ksi in all structural shapes and in
plates up to 8 in thick.
A573, the other carbon steel listed in Table 1.1, is available in three strength grades for
plate applications in which improved notch toughness is important.
1.1.2 High-Strength Low-Alloy Steels
Those steels which have specified minimum yield points greater than 40 ksi and achieve that
strength in the hot-rolled condition, rather than by heat treatment, are known as HSLA steels.
Because these steels offer increased strength at moderate increases in price over carbon steels,
they are economical for a variety of applications.
A242 steel is a weathering steel, used where resistance to atmospheric corrosion is of
primary importance. Steels meeting this specification usually provide a resistance to atmos-
pheric corrosion at least four times that of structural carbon steel. However, when required,
steels can be selected to provide a resistance to atmospheric corrosion of five to eight times
that of structural carbon steels. A specified minimum yield point of 50 ksi can be furnished
in plates up to
3
⁄
4
in thick and the lighter structural shapes. It is available with a lower yield
point in thicker sections, as indicated in Table 1.1.
A588 is the primary weathering steel for structural work. It provides a 50-ksi yield point
in plates up to 4 in thick and in all structural sections; it is available with a lower yield point
in thicker plates. Several grades are included in the specification to permit use of various
compositions developed by steel producers to obtain the specified properties. This steel pro-
vides about four times the resistance to atmospheric corrosion of structural carbon steels.
PROPERTIES OF STRUCTURAL STEELS AND EFFECTS OF STEELMAKING AND FABRICATION
1.3
TABLE 1.1
Specified Minimum Properties for Structural Steel Shapes and Plates*
ASTM
designation
Plate-thickness
range, in
ASTM
group for
structural
shapes†
Yield
stress,
ksi‡
Tensile
strength,
ksi‡
Elongation, %
In 2
in§
In
8in
A36 8 maximum 1–5 36 58–80 23–21 20
over 8 1–5 32 58–80 23 20
A573
Grade 58 1
1
⁄
2
maximum
ن
32 58–71 24 21
Grade 65 1
1
⁄
2
maximum
ن
35 65–77 23 20
Grade 70 1
1
⁄
2
maximum
ن
42 70–90 21 18
High-strength low-alloy steels
A242
3
⁄
4
maximum 1 and 2 50 70 21 18
Over
3
⁄
4
to 1
1
⁄
2
max 3 46 67 21 18
Over 1
1
⁄
2
to 4 max 4 and 5 42 63 21 18
A588 4 maximum 1–5 50 70 21 18
Over 4 to 5 max 1–5 46 67 21 —
Over 5 to 8 max 1–5 42 63 21 —
A572
Grade 42 6 maximum 1–5 42 60 24 20
Grade 50 4 maximum 1–5 50 65 21 18
Grade 60 1
1
⁄
4
maximum 1–3 60 75 18 16
Grade 65 1
1
⁄
4
maximum 1–3 65 80 17 15
A992
ن
1–5 50–65 65 21 18
Heat-treated carbon and HSLA steels
A633
Grade A 4 maximum
ن
42 63–83 23 18
Grade C, D 2
1
⁄
2
maximum
ن
50 70–90 23 18
Over 2
1
⁄
2
to 4 max
ن
46 65–85 23 18
Grade E 4 maximum
ن
60 80–100 23 18
Over 4 to 6 max
ن
55 75–95 23 18
A678
Grade A 1
1
⁄
2
maximum
ن
50 70–90 22 —
Grade B 2
1
⁄
2
maximum
ن
60 80–100 22 —
Grade C
3
⁄
4
maximum
ن
75 95–115 19 —
Over
3
⁄
4
to 1
1
⁄
2
max
ن
70 90–110 19 —
Over 1
1
⁄
2
to 2 max
ن
65 85–105 19 —
Grade D 3 maximum
ن
75 90–110 18 —
A852 4 maximum
ن
70 90–110 19 —
A913
ن
1–5 50 65 21 18
ن
1–5 60 75 18 16
ن
1–5 65 80 17 15
ن
1–5 70 90 16 14
1.4
SECTION ONE
TABLE 1.1
Specified Minimum Properties for Structural Steel Shapes and Plates* (Continued )
ASTM
designation
Plate-thickness
range, in
ASTM
group for
structural
shapes†
Yield
stress,
ksi‡
Tensile
strength,
ksi‡
Elongation, %
In 2
in§
In
8in
Heat-treated constructional alloy steels
A514 2
1
⁄
2
maximum
ن
100 110–130 18 —
Over 2
1
⁄
2
to 6 max
ن
90 100–130 16 —
* The following are approximate values for all the steels:
Modulus of elasticity—29
ϫ
10
3
ksi.
Shear modulus—11
ϫ
10
3
ksi.
Poisson’s ratio—0.30.
Yield stress in shear—0.57 times yield stress in tension.
Ultimate strength in shear—
2
⁄
3
to
3
⁄
4
times tensile strength.
Coefficient of thermal expansion—6.5
ϫ
10
Ϫ
6
in per in per deg F for temperature range
Ϫ
50 to
ϩ
150
Њ
F.
Density—490 lb / ft
3
.
† See ASTM A6 for structural shape group classification.
‡ Where two values are shown for yield stress or tensile strength, the first is minimum and the second is maximum.
§ The minimum elongation values are modified for some thicknesses in accordance with the specification for the
steel. Where two values are shown for the elongation in 2 in, the first is for plates and the second for shapes.
ن
Not applicable.
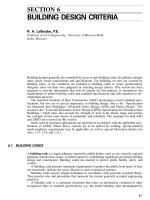
These relative corrosion ratings are determined from the slopes of corrosion-time curves
and are based on carbon steels not containing copper. (The resistance of carbon steel to
atmospheric corrosion can be doubled by specifying a minimum copper content of 0.20%.)
Typical corrosion curves for several steels exposed to industrial atmosphere are shown in
Fig. 1.2.
For methods of estimating the atmospheric corrosion resistance of low-alloy steels based
on their chemical composition, see ASTM Guide G101. The A588 specification requires that
the resistance index calculated according to Guide 101 shall be 6.0 or higher.
A588 and A242 steels are called weathering steels because, when subjected to alternate
wetting and drying in most bold atmospheric exposures, they develop a tight oxide layer
that substantially inhibits further corrosion. They are often used bare (unpainted) where the
oxide finish that develops is desired for aesthetic reasons or for economy in maintenance.
Bridges and exposed building framing are typical examples of such applications. Designers
should investigate potential applications thoroughly, however, to determine whether a weath-
ering steel will be suitable. Information on bare-steel applications is available from steel
producers.
A572 specifies columbium-vanadium HSLA steels in four grades with minimum yield
points of 42, 50, 60, and 65 ksi. Grade 42 in thicknesses up to 6 in and grade 50 in
thicknesses up to 4 in are used for welded bridges. All grades may be used for riveted or
bolted construction and for welded construction in most applications other than bridges.
A992 steel was introduced in 1998 as a new specification for rolled wide flange shapes
for building framing. It provides a minimum yield point of 50 ksi, a maximum yield point
of 65 ksi, and a maximum yield to tensile ratio of 0.85. These maximum limits are considered
desirable attributes for seismic design. To enhance weldability, a maximum carbon equivalent
is also included, equal to 0.47% for shape groups 4 and 5 and 0.45% for other groups. A
supplemental requirement can be specified for an average Charpy V-notch toughness of 40
ft
⅐
lb at 70
Њ
F.
PROPERTIES OF STRUCTURAL STEELS AND EFFECTS OF STEELMAKING AND FABRICATION
1.5
FIGURE 1.2 Corrosion curves for structural steels in an industrial atmosphere. (From R. L.
Brockenbrough and B. G. Johnston, USS Steel Design Manual, R. L. Brockenbrough & Associates,
Inc., Pittsburgh, Pa., with permission.)
1.1.3 Heat-Treated Carbon and HSLA Steels
Both carbon and HSLA steels can be heat treated to provide yield points in the range of 50
to 75 ksi. This provides an intermediate strength level between the as-rolled HSLA steels
and the heat-treated constructional alloy steels.
A633 is a normalized HSLA plate steel for applications where improved notch toughness
is desired. Available in four grades with different chemical compositions, the minimum yield
point ranges from 42 to 60 ksi depending on grade and thickness.
A678 includes quenched-and-tempered plate steels (both carbon and HSLA compositions)
with excellent notch toughness. It is also available in four grades with different chemical
compositions; the minimum yield point ranges from 50 to 75 ksi depending on grade and
thickness.
A852 is a quenched-and-tempered HSLA plate steel of the weathering type. It is intended
for welded bridges and buildings and similar applications where weight savings, durability,
and good notch toughness are important. It provides a minimum yield point of 70 ksi in
thickness up to 4 in. The resistance to atmospheric corrosion is typically four times that of
carbon steel.
A913 is a high-strength low-allow steel for structural shapes, produced by the quenching
and self-tempering (QST) process. It is intended for the construction of buildings, bridges,
and other structures. Four grades provide a minimum yield point of 50 to 70 ksi. Maximum
carbon equivalents to enhance weldability are included as follows: Grade 50, 0.38%; Grade
60, 0.40%; Grade 65, 0.43%; and Grade 70, 0.45%. Also, the steel must provide an average
Charpy V-notch toughness of 40 ft
⅐
lb at 70
Њ
F.
1.1.4 Heat-Treated Constructional Alloy Steels
Steels that contain alloying elements in excess of the limits for carbon steel and are heat
treated to obtain a combination of high strength and toughness are termed constructional
1.6
SECTION ONE
alloy steels. Having a yield strength of 100 ksi, these are the strongest steels in general
structural use.
A514 includes several grades of quenched and tempered steels, to permit use of various
compositions developed by producers to obtain the specified strengths. Maximum thickness
ranges from 1
1
⁄
4
to 6 in depending on the grade. Minimum yield strength for plate thicknesses
over 2
1
⁄
2
in is 90 ksi. Steels furnished to this specification can provide a resistance to at-
mospheric corrosion up to four times that of structural carbon steel depending on the grade.
Constructional alloy steels are also frequently selected because of their ability to resist
abrasion. For many types of abrasion, this resistance is related to hardness or tensile strength.
Therefore, constructional alloy steels may have nearly twice the resistance to abrasion pro-
vided by carbon steel. Also available are numerous grades that have been heat treated to
increase the hardness even more.
1.1.5 Bridge Steels
Steels for application in bridges are covered by A709, which includes steel in several of the
categories mentioned above. Under this specification, grades 36, 50, 70, and 100 are steels
with yield strengths of 36, 50, 70, and 100 ksi, respectively. (See also Table 11.28.)
The grade designation is followed by the letter W, indicating whether ordinary or high
atmospheric corrosion resistance is required. An additional letter, T or F, indicates that
Charpy V-notch impact tests must be conducted on the steel. The T designation indicates
that the material is to be used in a non-fracture-critical application as defined by AASHTO;
the F indicates use in a fracture-critical application.
A trailing numeral, 1, 2, or 3, indicates the testing zone, which relates to the lowest
ambient temperature expected at the bridge site. (See Table 1.2.) As indicated by the first
footnote in the table, the service temperature for each zone is considerably less than the
Charpy V-notch impact-test temperature. This accounts for the fact that the dynamic loading
rate in the impact test is more severe than that to which the structure is subjected. The
toughness requirements depend on fracture criticality, grade, thickness, and method of con-
nection.
A709-HPS70W, designated as a High Performance Steel (HPS), is also now available for
highway bridge construction. This is a weathering plate steel, designated HPS because it
possesses superior weldability and toughness as compared to conventional steels of similar
strength. For example, for welded construction with plates over 2
1
⁄
2
in thick, A709-70W
must have a minimum average Charpy V-notch toughness of 35 ft
⅐
lb at
Ϫ
10
Њ
F in Zone III,
the most severe climate. Toughness values reported for some heats of A709-HPS70W have
been much higher, in the range of 120 to 240 ft
⅐
lb at
Ϫ
10
Њ
F. Such extra toughness provides
a very high resistance to brittle fracture.
(R. L. Brockenbrough, Sec. 9 in Standard Handbook for Civil Engineers, 4th ed., F. S.
Merritt, ed., McGraw-Hill, Inc., New York.)
1.2 STEEL-QUALITY DESIGNATIONS
Steel plates, shapes, sheetpiling, and bars for structural uses—such as the load-carrying
members in buildings, bridges, ships, and other structures—are usually ordered to the re-
quirements of ASTM A6 and are referred to as structural-quality steels. (A6 does not
indicate a specific steel.) This specification contains general requirements for delivery related
to chemical analysis, permissible variations in dimensions and weight, permissible imper-
fections, conditioning, marking and tension and bend tests of a large group of structural
steels. (Specific requirements for the chemical composition and tensile properties of these
PROPERTIES OF STRUCTURAL STEELS AND EFFECTS OF STEELMAKING AND FABRICATION
1.7
TABLE 1.2
Charpy V-Notch Toughness for A709 Bridge Steels*
Grade
Maximum
thickness, in,
inclusive
Joining /
fastening
method
Minimum average
energy,
ft
⅐
lb
Test temperature,
Њ
F
Zone
1
Zone
2
Zone
3
Non-fracture-critical members
36T 4 Mech. / Weld. 15 70 40 10
50T,†
50WT†
2 Mech. / Weld. 15
2 to 4 Mechanical 15 70 40 10
2 to 4 Welded 20
70WT‡ 2
1
⁄
2
Mech. / Weld. 20
2
1
⁄
2
to 4 Mechanical 20 50 20
Ϫ
10
2
1
⁄
2
to 4 Welded 25
100T,
100WT
2
1
⁄
2
Mech. / Weld. 25
2
1
⁄
2
to 4 Mechanical 25 30 0
Ϫ
30
2
1
⁄
2
to 4 Welded 35
Fracture-critical members
36F 4 Mech. / Weld.
a
25 70 40 10
50F,† 50WF† 2 Mech. / Weld.
a
25 70 40 10
2 to 4 Mechanical
a
25 70 40 10
2 to 4 Welded
b
30 70 40 10
70WF‡ 2
1
⁄
2
Mech. / Weld.
b
30 50 20
Ϫ
10
2
1
⁄
2
to 4 Mechanical
b
30 50 20
Ϫ
10
2
1
⁄
2
to 4 Welded
c
35 50 20
Ϫ
10
100F, 100WF 2
1
⁄
2
Mech. / Weld.
c
35 30 0
Ϫ
30
2
1
⁄
2
to 4 Mechanical
c
35 30 0
Ϫ
30
2
1
⁄
2
to 4 Welded
d
45 30 0 NA
* Minimum service temperatures:
Zone 1, 0
Њ
F; Zone 2, below 0 to
Ϫ
30
Њ
F; Zone 3, below
Ϫ
30 to
Ϫ
60
Њ
F.
† If yield strength exceeds 65 ksi, reduce test temperature by 15
Њ
F for each 10 ksi above 65 ksi.
‡ If yield strength exceeds 85 ksi, reduce test temperature by 15
Њ
F for each 10 ksi above 85 ksi.
a
Minimum test value energy is 20 ft-lb.
b
Minimum test value energy is 24 ft-lb.
c
Minimum test value energy is 28 ft-lb.
d
Minimum test value energy is 36 ft-lb.
steels are included in the specifications discussed in Art. 1.1.) All the steels included in Table
1.1 are structural-quality steels.
In addition to the usual die stamping or stenciling used for identification, plates and shapes
of certain steels covered by A6 are marked in accordance with a color code, when specified
by the purchaser, as indicated in Table 1.3.
Steel plates for pressure vessels are usually furnished to the general requirements of
ASTM A20 and are referred to as pressure-vessel-quality steels. Generally, a greater number
of mechanical-property tests and additional processing are required for pressure-vessel-
quality steel.
1.8
SECTION ONE
TABLE 1.3
Identification Colors
Steels Color Steels Color
A36 None A913 grade 50 red and yellow
A242 Blue A913 grade 60 red and gray
A514 Red A913 grade 65 red and blue
A572 grade 42 Green and white A913 grade 70 red and white
A572 grade 50 Green and yellow
A572 grade 60 Green and gray
A572 grade 65 Green and blue
A588 Blue and yellow
A852 Blue and orange
1.3 RELATIVE COST OF STRUCTURAL STEELS
Because of the many strength levels and grades now available, designers usually must in-
vestigate several steels to determine the most economical one for each application. As a
guide, relative material costs of several structural steels used as tension members, beams,
and columns are discussed below. The comparisons are based on cost of steel to fabricators
(steel producer’s price) because, in most applications, cost of a steel design is closely related
to material costs. However, the total fabricated and erected cost of the structure should be
considered in a final cost analysis. Thus the relationships shown should be considered as
only a general guide.
Tension Members. Assume that two tension members of different-strength steels have the
same length. Then, their material-cost ratio C
2
/C
1
is
CAp
222
ϭ
(1.1)
CAp
111
where A
1
and A
2
are the cross-sectional areas and p
1
and p
2
are the material prices per unit
weight. If the members are designed to carry the same load at a stress that is a fixed per-
centage of the yield point, the cross-sectional areas are inversely proportional to the yield
stresses. Therefore, their relative material cost can be expressed as
F
Cp
y1
22
ϭ
(1.2)
CFp
1 y21
where F
y1
and F
y2
are the yield stresses of the two steels. The ratio p
2
/p
1
is the relative price
factor. Values of this factor for several steels are given in Table 1.4, with A36 steel as the
base. The table indicates that the relative price factor is always less than the corresponding
yield-stress ratio. Thus the relative cost of tension members calculated from Eq. (1.2) favors
the use of high-strength steels.
Beams. The optimal section modulus for an elastically designed I-shaped beam results
when the area of both flanges equals half the total cross-sectional area of the member.
Assume now two members made of steels having different yield points and designed to carry
the same bending moment, each beam being laterally braced and proportioned for optimal
PROPERTIES OF STRUCTURAL STEELS AND EFFECTS OF STEELMAKING AND FABRICATION
1.9
TABLE 1.4
Relative Price Factors*
Steel
Minimum
yield
stress, ksi
Relative
price
factor
Ratio of
minimum
yield
stresses
Relative
cost of
tension
members
A36 36 1.00 1.00 1.00
A572 grade 42 42 1.09 1.17 0.93
A572 grade 50 50 1.12 1.39 0.81
A588 grade A 50 1.23 1.39 0.88
A852 70 1.52 1.94 0.78
A514 grade B 100 2.07 2.78 0.75
* Based on plates
3
⁄
4
ϫ
96
ϫ
240 in. Price factors for shapes tend to be lower.
A852 and A514 steels are not available in shapes.
section modulus. Their relative weight W
2
/W
1
and relative cost C
2
/C
1
are influenced by the
web depth-to-thickness ratio d / t. For example, if the two members have the same d/t values,
such as a maximum value imposed by the manufacturing process for rolled beams, the
relationships are
2/3
F
W
y1
2
ϭ
(1.3)
ͩͪ
WF
1 y2
2/3
F
Cp
y1
22
ϭ
(1.4)
ͩͪ
CpF
11y2
If each of the two members has the maximum d/t value that precludes elastic web buckling,
a condition of interest in designing fabricated plate girders, the relationships are
1/2
F
W
y1
2
ϭ
(1.5)
ͩͪ
WF
1 y2
1/2
F
Cp
y1
22
ϭ
(1.6)
ͩͪ
CpF
11y2
Table 1.5 shows relative weights and relative material costs for several structural steels.
These values were calculated from Eqs. (1.3) to (1.6) and the relative price factors given in
Table 1.4, with A36 steel as the base. The table shows the decrease in relative weight with
increase in yield stress. The relative material costs show that when bending members are
thus compared for girders, the cost of A572 grade 50 steel is lower than that of A36 steel,
and the cost of other steels is higher. For rolled beams, all the HSLA steels have marginally
lower relative costs, and A572 grade 50 has the lowest cost.
Because the comparison is valid only for members subjected to the same bending moment,
it does not indicate the relative costs for girders over long spans where the weight of the
member may be a significant part of the loading. Under such conditions, the relative material
costs of the stronger steels decrease from those shown in the table because of the reduction
in girder weights. Also, significant economies can sometimes be realized by the use of hybrid
girders, that is, girders having a lower-yield-stress material for the web than for the flange.
HSLA steels, such as A572 grade 50, are often more economical for composite beams in
1.10
SECTION ONE
TABLE 1.5
Relative Material Cost for Beams
Steel
Plate girders
Relative
weight
Relative
material cost
Rolled beams
Relative
weight
Relative
material cost
A36 1.000 1.00 1.000 1.00
A572 grade 42 0.927 1.01 0.903 0.98
A572 grade 50 0.848 0.95 0.805 0.91
A588 grade A 0.848 1.04 0.805 0.99
A852 0.775 1.18
A514 grade B 0.600 1.24
the floors of buildings. Also, A588 steel is often preferred for bridge members in view of
its greater durability.
Columns. The relative material cost for two columns of different steels designed to carry
the same load may be expressed as
CFpF/ p
2 c12 c11
ϭϭ
(1.7)
CFpF/ p
1 c21 c22
where F
c1
and F
c2
are the column buckling stresses for the two members. This relationship
is similar to that given for tension members, except that buckling stress is used instead of
yield stress in computing the relative price-strength ratios. Buckling stresses can be calculated
from basic column-strength criteria. (T. Y. Galambos, Structural Stability Research Council
Guide to Design Criteria for Metal Structures, John Wiley & Sons, Inc., New York.) In
general, the buckling stress is considered equal to the yield stress at a slenderness ratio L / r
of zero and decreases to the classical Euler value with increasing L / r.
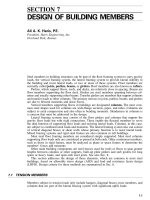
Relative price-strength ratios for A572 grade 50 and other steels, at L / r values from zero
to 120 are shown graphically in Fig. 1.3. As before, A36 steel is the base. Therefore, ratios
less than 1.00 indicate a material cost lower than that of A36 steel. The figure shows that
for L/r from zero to about 100, A572 grade 50 steel is more economical than A36 steel.
Thus the former is frequently used for columns in building construction, particularly in the
lower stories, where slenderness ratios are smaller than in the upper stories.
1.4 STEEL SHEET AND STRIP FOR STRUCTURAL APPLICATIONS
Steel sheet and strip are used for many structural applications, including cold-formed mem-
bers in building construction and the stressed skin of transportation equipment. Mechanical
properties of several of the more frequently used sheet steels are presented in Table 1.6.
ASTM A570 covers seven strength grades of uncoated, hot-rolled, carbon-steel sheets
and strip intended for structural use.
A606 covers high-strength, low-alloy, hot- and cold-rolled steel sheet and strip with en-
hanced corrosion resistance. This material is intended for structural or miscellaneous uses
where weight savings or high durability are important. It is available, in cut lengths or coils,
in either type 2 or type 4, with atmospheric corrosion resistance approximately two or four
times, respectively, that of plain carbon steel.
PROPERTIES OF STRUCTURAL STEELS AND EFFECTS OF STEELMAKING AND FABRICATION
1.11
FIGURE 1.3 Curves show for several structural steels the variation of relative price-strength
ratios, A36 steel being taken as unity, with slenderness ratios of compression members.
A607, available in six strength levels, covers high-strength, low-alloy columbium or va-
nadium, or both, hot- and cold-rolled steel sheet and strip. The material may be in either
cut lengths or coils. It is intended for structural or miscellaneous uses where greater strength
and weight savings are important. A607 is available in two classes, each with six similar
strength levels, but class 2 offers better formability and weldability than class 1. Without
addition of copper, these steels are equivalent in resistance to atmospheric corrosion to plain
carbon steel. With copper, however, resistance is twice that of plain carbon steel.
A611 covers cold-rolled carbon sheet steel in coils and cut lengths. Four grades provide
yield stress levels from 25 to 40 ksi. Also available is Grade E, which is a full-hard product
with a minimum yield stress of 80 ksi but no specified minimum elongation.
A653 covers steel sheet, zinc coated (galvanized) or zinc-iron alloy coated (galvannealed)
by the hot dip process in coils and cut lengths. Included are several grades of structural steel
(SS) and high-strength low-alloy steel (HSLAS) with a yield stress of 33 to 80 ksi. HSLAS
sheets are available as Type A, for applications where improved formability is important,
and Type B for even better formability. The metallic coating is available in a wide range of
coating weights, which provide excellent corrosion protection in many applications.
A715 provides for HSLAS, hot and cold-rolled, with improved formability over A606 an
A607 steels. Yield stresses included range from 50 to 80 ksi.
A792 covers sheet in coils and cut lengths coated with aluminum-zinc alloy by the hot
dip process. The coating is available in three coating weights, which provide both corrosion
and heat resistance.
1.12
SECTION ONE
TABLE 1.6
Specified Minimum Mechanical Properties for Steel Sheet and Strip for Structural
Applications
ASTM
designation Grade Type of product
Yield
point,
ksi
Tensile
strength,
ksi
Elongation
in 2 in, %*
A570 Hot-rolled
30 30 49 21
33 33 52 18
36 36 53 17
40 40 55 15
45 45 60 13
50 50 65 11
55 55 70 9
A606 Hot-rolled, cut length 50 70 22
Hot-rolled, coils 45 65 22
Cold-rolled 45 65 22
A607 Hot- or cold-rolled
45 45 60† 25–22
50 50 65† 22–20
55 55 70† 20–18
60 60 75† 18–16
65 65 80† 16–14
70 70 85† 14–12
A611 Cold-rolled
A254226
B304524
C334822
D405220
A653** Galvanized or galvannealed
SS 33 33 45 20
SS 37 37 52 18
SS 40 40 55 16
SS 50, class 1 50 65 12
SS 50, class 2 50 70 12
HSLAS 50 50 60 20–22
HSLAS 50 60 70 16–18
HSLAS 50 70 80 12–14
HSLAS 50 80 90 10–12
A715 Hot- and cold-rolled
50 50 60 22
60 60 70 18
70 70 80 16
80 80 90 14
A792 Aluminum-zinc alloy coated
SS 33 33 45 20
SS 37 37 52 18
SS 40 40 55 16
SS 50A 50 65 12
* Modified for some thicknesses in accordance with the specification. For A607, where two values are given, the
first is for hot-rolled, the second for cold-rolled steel. For A653, where two values are given, the first is for type A
product, the second for type B.
† For class 1 product. Reduce tabulated strengths 5 ksi for class 2.
** Also available as A875 with zinc-5% aluminum alloy coating.
PROPERTIES OF STRUCTURAL STEELS AND EFFECTS OF STEELMAKING AND FABRICATION
1.13
TABLE 1.7
Specified Minimum Mechanical Properties of Structural Tubing
ASTM
designation Product form
Yield
point,
ksi
Tensile
strength,
ksi
Elongation
in 2 in, %
A500 Shaped
Grade A 39 45 25
Grade B 46 58 23
Grade C 50 62 21
Grade D 36 58 23
A500 Round
Grade A 33 45 25
Grade B 42 58 23
Grade C 46 62 21
Grade D 36 58 23
A501 Round or shaped 36 58 23
A618 Round or shaped
Grades Ia, lb, II
Walls
Յ
3
⁄
4
in 50 70 22
Walls
Ͼ
3
⁄
4
to 1
1
⁄
2
in 46 67 22
Grade III 50 65 20
A847 Round or shaped 50 70 19
1.5 TUBING FOR STRUCTURAL APPLICATIONS
Structural tubing is being used more frequently in modern construction (Art. 6.30). It is often
preferred to other steel members when resistance to torsion is required and when a smooth,
closed section is aesthetically desirable. In addition, structural tubing often may be the ec-
onomical choice for compression members subjected to moderate to light loads. Square and
rectangular tubing is manufactured either by cold or hot forming welded or seamless round
tubing in a continuous process. A500 cold-formed carbon-steel tubing (Table 1.7) is produced
in four strength grades in each of two product forms, shaped (square or rectangular) or
round. A minimum yield point of up to 50 ksi is available for shaped tubes and up to 46
ksi for round tubes. A500 grade B and grade C are commonly specified for building con-
struction applications and are available from producers and steel service centers.
A501 tubing is a hot-formed carbon-steel product. It provides a yield point equal to that
of A36 steel in tubing having a wall thickness of 1 in or less.
A618 tubing is a hot-formed HSLA product that provides a minimum yield point of up
to 50 ksi. The three grades all have enhanced resistance to atmospheric corrosion. Grades
Ia and Ib can be used in the bare condition for many applications when properly exposed
to the atmosphere.
A847 tubing covers cold-formed HSLA tubing and provides a minimum yield point of
50 ksi. It also offers enhanced resistance to atmospheric corrosion and, when properly ex-
posed, can be used in the bare condition for many applications.
1.6 STEEL CABLE FOR STRUCTURAL APPLICATIONS
Steel cables have been used for many years in bridge construction and are occasionally used
in building construction for the support of roofs and floors. The types of cables used for
1.14
SECTION ONE
TABLE 1.8
Mechanical Properties of Steel Cables
Minimum breaking strength, kip,*
of selected cable sizes
Minimum modulus of elasticity, ksi,*
for indicated diameter range
Nominal
diameter, in
Zinc-coated
strand
Zinc-coated
rope
Nominal diameter
range, in
Minimum
modulus, ksi
1
⁄
2
30 23 Prestretched
3
⁄
4
68 52
zinc-coated strand
1 122 91.4
1
⁄
2
to 2
9
⁄
16
24,000
1
1
⁄
2
276 208 2
5
⁄
8
and over 23,000
2 490 372 Prestretched
3 1076 824
zinc-coated rope
4 1850 1460
3
⁄
8
to 4 20,000
* Values are for cables with class A zinc coating on all wires. Class B or C can be specified where additional
corrosion protection is required.
these applications are referred to as bridge strand or bridge rope. In this use, bridge is a
generic term that denotes a specific type of high-quality strand or rope.
A strand is an arrangement of wires laid helically about a center wire to produce a
symmetrical section. A rope is a group of strands laid helically around a core composed of
either a strand or another wire rope. The term cable is often used indiscriminately in referring
to wires, strands, or ropes. Strand may be specified under ASTM A586; wire rope, under
A603.
During manufacture, the individual wires in bridge strand and rope are generally galva-
nized to provide resistance to corrosion. Also, the finished cable is prestretched. In this
process, the strand or rope is subjected to a predetermined load of not more than 55% of
the breaking strength for a sufficient length of time to remove the ‘‘structural stretch’’ caused
primarily by radial and axial adjustment of the wires or strands to the load. Thus, under
normal design loadings, the elongation that occurs is essentially elastic and may be calculated
from the elastic-modulus values given in Table 1.8.
Strands and ropes are manufactured from cold-drawn wire and do not have a definite
yield point. Therefore, a working load or design load is determined by dividing the specified
minimum breaking strength for a specific size by a suitable safety factor. The breaking
strengths for selected sizes of bridge strand and rope are listed in Table 1.8.
1.7 TENSILE PROPERTIES
The tensile properties of steel are generally determined from tension tests on small specimens
or coupons in accordance with standard ASTM procedures. The behavior of steels in these
tests is closely related to the behavior of structural-steel members under static loads. Because,
for structural steels, the yield points and moduli of elasticity determined in tension and
compression are nearly the same, compression tests are seldom necessary.
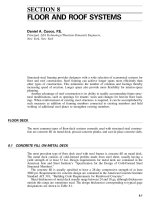
Typical tensile stress-strain curves for structural steels are shown in Fig. 1.1. The initial
portion of these curves is shown at a magnified scale in Fig. 1.4. Both sets of curves may
be referred to for the following discussion.
PROPERTIES OF STRUCTURAL STEELS AND EFFECTS OF STEELMAKING AND FABRICATION
1.15
FIGURE 1.4 Partial stress-strain curves for structural steels strained
through the plastic region into the strain-hardening range. (From R. L.
Brockenbrough and B. G. Johnston, USS Steel Design Manual, R. L. Brock-
enbrough & Associates, Inc., Pittsburgh, Pa., with permission.)
Strain Ranges. When a steel specimen is subjected to load, an initial elastic range is
observed in which there is no permanent deformation. Thus, if the load is removed, the
specimen returns to its original dimensions. The ratio of stress to strain within the elastic
range is the modulus of elasticity, or Young’s modulus E. Since this modulus is consistently
about 29
ϫ
10
3
ksi for all the structural steels, its value is not usually determined in tension
tests, except in special instances.
The strains beyond the elastic range in the tension test are termed the inelastic range.
For as-rolled and high-strength low-alloy (HSLA) steels, this range has two parts. First
observed is a plastic range, in which strain increases with no appreciable increase in stress.
This is followed by a strain-hardening range, in which strain increase is accompanied by
a significant increase in stress. The curves for heat-treated steels, however, do not generally
exhibit a distinct plastic range or a large amount of strain hardening.
The strain at which strain hardening begins (
⑀
st
) and the rate at which stress increases
with strain in the strain-hardening range (the strain-hardening modulus E
st
) have been de-
termined for carbon and HSLA steels. The average value of E
st
is 600 ksi, and the length
of the yield plateau is 5 to 15 times the yield strain. (T. V. Galambos, ‘‘Properties of Steel
for Use in LRFD,’’ Journal of the Structural Division, American Society of Civil Engineers,
Vol. 104, No. ST9, 1978.)
Yield Point, Yield Strength, and Tensile Strength. As illustrated in Fig. 1.4, carbon and
HSLA steels usually show an upper and lower yield point. The upper yield point is the value
usually recorded in tension tests and thus is simply termed the yield point.
The heat-treated steels in Fig. 1.4, however, do not show a definite yield point in a tension
test. For these steels it is necessary to define a yield strength, the stress corresponding to a
1.16
SECTION ONE
specified deviation from perfectly elastic behavior. As illustrated in the figure, yield strength
is usually specified in either of two ways: For steels with a specified value not exceeding
80 ksi, yield strength is considered as the stress at which the test specimen reaches a 0.5%
extension under load (0.5% EUL) and may still be referred to as the yield point. For higher-
strength steels, the yield strength is the stress at which the specimen reaches a strain 0.2%
greater than that for perfectly elastic behavior.
Since the amount of inelastic strain that occurs before the yield strength is reached is
quite small, yield strength has essentially the same significance in design as yield point.
These two terms are sometimes referred to collectively as yield stress.
The maximum stress reached in a tension test is the tensile strength of the steel. After
this stress is reached, increasing strains are accompanied by decreasing stresses. Fracture
eventually occurs.
Proportional Limit. The proportional limit is the stress corresponding to the first visible
departure from linear-elastic behavior. This value is determined graphically from the stress-
strain curve. Since the departure from elastic action is gradual, the proportional limit depends
greatly on individual judgment and on the accuracy and sensitivity of the strain-measuring
devices used. The proportional limit has little practical significance and is not usually re-
corded in a tension test.
Ductility. This is an important property of structural steels. It allows redistribution of
stresses in continuous members and at points of high local stresses, such as those at holes
or other discontinuities.
In a tension test, ductility is measured by percent elongation over a given gage length or
percent reduction of cross-sectional area. The percent elongation is determined by fitting the
specimen together after fracture, noting the change in gage length and dividing the increase
by the original gage length. Similarly, the percent reduction of area is determined from cross-
sectional measurements made on the specimen before and after testing.
Both types of ductility measurements are an index of the ability of a material to deform
in the inelastic range. There is, however, no generally accepted criterion of minimum ductility
for various structures.
Poisson’s Ratio. The ratio of transverse to longitudinal strain under load is known as Pois-
son’s ratio
. This ratio is about the same for all structural steels—0.30 in the elastic range
and 0.50 in the plastic range.
True-Stress–True-Strain Curves. In the stress-strain curves shown previously, stress values
were based on original cross-sectional area, and the strains were based on the original gauge
length. Such curves are sometimes referred to as engineering-type stress-strain curves.
However, since the original dimensions change significantly after the initiation of yielding,
curves based on instantaneous values of area and gage length are often thought to be of
more fundamental significance. Such curves are known as true-stress–true-strain curves.
A typical curve of this type is shown in Fig. 1.5.
The curve shows that when the decreased area is considered, the true stress actually
increases with increase in strain until fracture occurs instead of decreasing after the tensile
strength is reached, as in the engineering stress-strain curve. Also, the value of true strain
at fracture is much greater than the engineering strain at fracture (though until yielding begins
true strain is less than engineering strain).
1.8 PROPERTIES IN SHEAR
The ratio of shear stress to shear strain during initial elastic behavior is the shear modulus
G. According to the theory of elasticity, this quantity is related to the modulus of elasticity
E and Poisson’s ratio
by