Tình hình kinh tế thế giới năm 2017
Bạn đang xem bản rút gọn của tài liệu. Xem và tải ngay bản đầy đủ của tài liệu tại đây (3.17 MB, 222 trang )
and
World Economic
Situation
Prospects
2017
United Nations
World Economic Situation
and Prospects 2017
asdf
United Nations
New York, 2017
The report is a joint product of the United Nations Department of Economic and Social Affairs (UN/DESA), the United Nations Conference on Trade and Development (UNCTAD)
and the five United Nations regional commissions (Economic Commission for Africa (ECA),
Economic Commission for Europe (ECE), Economic Commission for Latin America and the
Caribbean (ECLAC), Economic and Social Commission for Asia and the Pacific (ESCAP)
and Economic and Social Commission for Western Asia (ESCWA)). The United Nations
World Tourism Organization (UNWTO) also contributed to the report.
For further information, see or contact:
DESA
Mr. Wu Hongbo, Under-Secretary-General
Department of Economic and Social Affairs
Room S-2922
United Nations
New York, NY 10017
USA
+1-212-9635958
☎
UNCTAD
Dr. Mukhisa Kituyi, Secretary-General
United Nations Conference on Trade
and Development
Room E-9042
Palais de Nations
1211 Geneva 10
Switzerland
+41-22-9175806
☎
ECA
Dr. Abdalla Hamdok, Executive Secretary
United Nations Economic Commission for Africa
Menelik II Avenue
P.O. Box 3001
Addis Ababa
Ethiopia
+251-11-5511231
☎
ECE
Mr. Christian Friis Bach, Executive Secretary
United Nations Economic Commission for Europe
Palais des Nations
CH-1211 Geneva 10
Switzerland
+41-22-9174444
☎
ECLAC
Ms. Alicia Bárcena, Executive Secretary
Economic Commission for Latin America
and the Caribbean
Av. Dag Hammarskjöld 3477
Vitacura
Santiago, Chile
Chile
+56-2-22102000
☎
ESCAP
Dr. Shamshad Akhtar, Executive Secretary
Economic and Social Commission for Asia
and the Pacific
United Nations Building
Rajadamnern Nok Avenue
Bangkok 10200
Thailand
+66-2-2881234
☎
ESCWA
Ms. Rima Khalaf, Executive Secretary
Economic and Social Commission for Western Asia
P.O. Box 11-8575
Riad el-Solh Square, Beirut
Lebanon
+961-1-981301
@ />
☎
ISBN: 978-92-1-109175-5
eISBN: 978-92-1-059945-0
United Nations publication
Sales No. E.17.II.C.2
Copyright @ United Nations, 2017
All rights reserved
Acknowledgements
The World Economic Situation and Prospects 2017 is a joint product of the United Nations
Department of Economic and Social Affairs (UN/DESA), the United Nations Conference
on Trade and Development (UNCTAD) and the five United Nations regional commissions
(Economic Commission for Africa (ECA), Economic Commission for Europe (ECE), Economic Commission for Latin America and the Caribbean (ECLAC), Economic and Social
Commission for Asia and the Pacific (ESCAP) and Economic and Social Commission for
Western Asia (ESCWA)). The United Nations World Tourism Organization (UNWTO)
contributed to the report. The report also benefited from inputs received from the national
centres of Project LINK and also from the deliberations in the Project LINK meeting held
in Toronto on 19-21 October 2016. The forecasts presented in the report draw on the World
Economic Forecasting Model (WEFM) of UN/DESA.
Under the general guidance of Lenni Montiel, Assistant Secretary-General for Economic Development in UN/DESA, and the management of Pingfan Hong, Director of
Development Policy and Analysis Division (DPAD), this publication was led by Dawn
Holland, Matthias Kempf, and Ingo Pitterle in the Global Economic Monitoring Unit of
DPAD.
The contributions of Grigor Agabekian, Helena Afonso, Hoi Wai Cheng, Peter
Chowla, Ann D’lima, Cordelia Gow, Andrea Grozdanic, Dawn Holland, Kenneth Iversen, Arend Janssen, Matthias Kempf, Erik Klok (visiting fellow), Poh Lynn Ng, Lara Palmisano, Ingo Pitterle, Gabe Scelta, Oliver Schwank, Nancy Settecasi, Krishnan Sharma,
Shari Spiegel, Alex Trepelkov, Sebastian Vergara, Qian Wan (intern) and Jie Wei from
UN/DESA; Bruno Antunes, Stephanie Blankenburg, Alfredo Calcagno, Stefan Csordas,
Samuel Gayi, Taisuke Ito, Mina Mashayekhi, Nicolas Maystre, Alessandro Nicita, Janvier
Nkurunziza, and Julia Seiermann from UNCTAD; Yesuf Mohammednur Awel, Hopestone
Chavula, Adam Elhiraika and Khaled Hussein from ECA; José Palacín from ECE; Claudia
De Camino, Michael Hanni, Daniel Titelman and Cecilia Vera from ECLAC; Hamza Ali
Malik, Jose Antonio Pedrosa Garcia, Matthew Hammill, Dorothea Lazaro, Swayamsiddha
Panda, Nyingtob Pema Norbu and Vatcharin Sirimaneetham from ESCAP; Abdallah Al
Dardari, Moctar Mohamed El Hacene, Mohamed Hedi Bchir, Nathalie Khaled, Maroun
Laoun, John Robert Sloan and Yasuhisa Yamamoto from ESCWA; Michel Julian, John
Kester and Javier Ruescas from UNWTO are duly acknowledged.
The report was edited by Carla Drysdale.
iv
World Economic Situation and Prospects 2017
Explanatory notes
The following symbols have been used in the tables throughout the report:
..
–
.
-
Two dots indicate that data are not available
or are not separately reported.
A dash indicates that the amount is nil or negligible.
A full stop is used to indicate decimals.
A hyphen indicates that the item is not applicable.
/
–
A minus sign indicates deficit or decrease, except as indicated.
A slash between years indicates a crop year or financial year,
for example, 2015/16.
Use of a hyphen between years, for example, 2016–2017,
signifies the full period involved, including the beginning and
end years.
Reference to “dollars” ($) indicates United States dollars, unless otherwise stated.
Reference to “billions” indicates one thousand million.
Reference to “tons” indicates metric tons, unless otherwise stated.
Annual rates of growth or change, unless otherwise stated,
refer to annual compound rates.
Details and percentages in tables do not necessarily add to totals,
because of rounding.
Project LINK is an international collaborative research
group for econometric modelling, coordinated jointly
by the Development Policy and Analysis Division of
UN/DESA and the University of Toronto.
For country classifications, see statistical annex.
Data presented in this publication incorporate
information available as at 11 November 2016.
The following abbreviations have been used:
AAAA
ADB
AfDB
AIIB
BIS
BoJ
BOP
CFTA
CIS
CPA
DAC
DSR
EBRD
ECB
EEU
EIB
ETFs
EU
FDI
Fed
G20
GCC
GDP
GNI
GVCs
HIPC
IBRD
ICT
IDA
IEA
IFC
IIC
ILO
IMF
ITA
Addis Ababa Action Agenda
Asian Development Bank
Africian Development Bank
Asian Infrastructure Investment Bank
Bank for International Settlements
Bank of Japan
balance of payments
Continental Free Trade Area
Commonwealth of Independent States
country-programmable aid
OECD Development Assistance Committee
debt service-to-income ratio
European Bank for Reconstruction and Development
European Central Bank
Eurasian Economic Union
European Investment Bank
exchange-traded funds
European Union
foreign direct investment
United States Federal Reserve
Group of Twenty
Cooperation Council for the Arab States of the Gulf
gross domestic product
gross national income
global value chains
heavily-indebted poor countries
International Bank for Reconstruction and Development
information and communication technology
International Developement Association
International Energy Agency
International Finance Corporation
Inter-American Investment Corporation
International Labour Organization
International Monetary Fund
Information Technology Agreement
LBMA
LDCs
LIBOR
LME
MC10
MDBs
MFN
NDB
NTMs
ODA
OECD
OIS
OOF
OPEC
PPP
QE
R&D
RTAs
SDGs
SIDS
SMEs
SOEs
SWFs
TFP
TISA
TOSSD
TPP
UN/DESA
UNCTAD
UNWTO
WDI
WGP
WTO
London Bullion Market Associations
least developed countries
London Interbank Offered Rate
London Metal Exchange
tenth Ministerial Conference of the WTO
multilateral development banks
most favoured nation
New Development Bank
non-tariff measures
official development assistance
Organisation for Economic Co-operation
and Development
overnight indexed swap
other official flows
Organization of the Petroleum Exporting Countries
purchasing power parity
quantitative easing
research and development
regional trade agreements
Sustainable Development Goals
small insland developing States
small and medium-sized enterprises
State-owned enterprises
sovereign wealth funds
total factor productivity
Trade in Services Agreement
Total Official Support for Sustainable Development
Trans-Pacific Partnership Agreement
Department of Economic and Social Affairs of the
United Nations Secretariat
United Nations Conference on Trade and Development
United Nations World Tourism Organization
World Development Indicators
world gross product
World Trade Organization
Executive Summary
Executive summary
Prospects for global macroeconomic development
The global economy remains trapped
in a prolonged episode of slow growth
In 2016, the world economy expanded by just 2.2 per cent, the slowest rate of growth since
the Great Recession of 2009. Underpinning the sluggish global economy are the feeble pace
of global investment, dwindling world trade growth, flagging productivity growth and high
levels of debt. Low commodity prices have exacerbated these factors in many commodity-exporting countries since mid-2014, while conflict and geopolitical tensions continue to
weigh on economic prospects in several regions.
World gross product is forecast to expand by 2.7 per cent in 2017 and 2.9 per cent in
2018, with this modest recovery more an indication of economic stabilization than a signal
of a robust and sustained revival of global demand. The slight increase in gross domestic
product (GDP) growth projected for developed economies in 2017 is largely driven by the
end of the destocking cycle in the United States of America and additional policy support
in Japan.
Economies in transition are expected to expand by 1.4 per cent in 2017, following
two consecutive years of decline, as the region has largely absorbed the sharp terms-of-trade
shock that several countries suffered in 2014-2015. Commodity exporters in developing
countries are also expected to see some uptick in growth, as commodity prices stabilize and
inflationary pressures driven by sharp exchange rate depreciations ease. East and South Asia
will continue to grow more rapidly than other regions, benefiting from robust domestic
demand and space for more accommodative macroeconomic policy. The outlook remains
subject to significant uncertainties and downside risks. If these downside risks were to
materialize, the moderate acceleration in growth currently projected would be derailed.
Given the close linkages between demand, investment, trade and productivity, the
extended episode of weak global growth may prove self-perpetuating in the absence of concerted policy efforts to revive investment and foster a recovery in productivity. This would
impede progress towards the Sustainable Development Goals (SDGs), particularly the goals
of eradicating extreme poverty and creating decent work for all.
Weak investment is at the foundation of the
slowdown in global growth
Investment growth has slowed significantly in many of the major developed and developing
economies, as well as in many economies in transition. Protracted weak global demand
has reduced incentives for firms to invest, while economic and political uncertainties have
also weighed on investment. Since 2015, many countries have seen sharp contractions in
v
vi
World Economic Situation and Prospects 2017
investment in the oil and extractive industries, although these declines are mostly cyclical, rather than signalling significant structural progress towards a less fossil fuel-intensive
economy. Lack of access to finance has also acted as a constraint in some cases, especially in
countries where banks remain undercapitalized or where financial markets are under-developed. Despite record-low, often negative bond yields, Governments in developed countries
have made steep cuts in public investment since 2010, reflecting fiscal adjustment policies
implemented in response to high levels of government debt. Since mid-2014, Governments
in many commodity-exporting countries have also curtailed much-needed investment in
infrastructure and social services, in response to the sharp loss of commodity revenue. In
some other developing countries in East and South Asia and parts of Africa, on the other
hand, weaker private sector investment has been partially offset by an expansion of government infrastructure projects.
The extended period of weak investment is a driving factor
behind the slowdown in productivity growth
Labour productivity growth has slowed markedly in most developed economies, and in
many large developing and transition countries. Investment in new capital can affect factors
such as the rate of innovation, labour force skills and the quality of infrastructure. These in
turn drive the technological change and efficiency gains underpinning labour productivity
growth in the medium term.
Government support for public goods, such as combating climate change, remains
crucial, as private investors tend to evaluate risk and return over a short-term horizon and
under-invest in public priorities. Investment in key areas, such as research and development,
education and infrastructure, would serve to promote sustainable development and social
and environmental progress, while also supporting productivity growth. While fiscal space
to support an expansion of investment remains limited in many countries, especially commodity exporters that have suffered a sharp loss of commodity revenue, some large economies do have the scope to take advantage of low borrowing costs to finance investment.
Aggregate growth in the least developed countries (LDCs)
remains well below the Sustainable Development Goal target
of “at least 7 per cent GDP growth”
Aggregate growth in the LDCs will remain well below the SDG target in the near term,
but is expected to rise modestly from an estimated 4.5 per cent in 2016 to 5.2 per cent and
5.5 per cent in 2017 and 2018, respectively. The below-target growth poses a risk to critical
public expenditure on healthcare, education, social protection and climate change adaptation. The latter is all the more critical since the LDCs remain highly vulnerable to natural
catastrophes and weather-related shocks.
Further efforts are also needed to diversify exports of the LDCs, which remain highly
concentrated in a few primary products vulnerable to price volatility and external shocks.
Under the current growth trajectory, nearly 35 per cent of the population in the LDCs may
remain in extreme poverty by 2030. Without an acceleration in both GDP growth and progress towards improving income inequality, eradicating the high levels of extreme poverty
in the LDCs by 2030 is a formidable challenge.
Executive Summary
Garnering the resources to finance the investment needed in the LDCs remains difficult. Investment in these countries would need to expand at an average annual rate of at
least 11 per cent through 2030, a significant acceleration relative to recent trends. Foreign
direct investment (FDI) continues to bypass many LDCs and remains concentrated in
extractive industries. Greater efforts are needed to mobilise domestic and international,
public and private resources for achieving the SDGs of these countries.
Sustained improvements in carbon emissions mitigation will
require concerted efforts to improve energy efficiency and
promote renewable energy
The level of global carbon emissions has stalled for two consecutive years. This positive
development reflects the declining energy intensity of economic activities, a rising share of
renewables in the overall energy structure, and slower economic growth in major emitters.
However, the world remains some distance from achieving a sustained decoupling
between economic growth and carbon emissions growth. Despite advancements, especially
in developing countries, where the level of new renewable energy investment exceeded that
of developed countries in 2015, renewable energy still accounts for only a small share of
global power generation. New renewable investment dropped sharply in the first half of
2016, and the improvements to emissions mitigation witnessed in recent years could easily
reverse without concerted efforts from the public and private sectors to improve energy
efficiency and promote renewable energy, supported by international cooperation on clean
technology transfer and climate finance.
International trade and finance
World trade at a standstill
Dwindling world trade growth is both a contributing factor and a symptom of the global economic slowdown. World trade volumes expanded by just 1.2 per cent in 2016, the
third-lowest rate in the past 30 years. Cyclical factors — such as the composition of global
demand and heightened uncertainty — continue to restrain global trade growth, while
the impact of a number of structural shifts that favoured the rapid expansion of global
trade in the 1990s and 2000s have started to wane, coupled with slower progress in trade
liberalisation. The ratio of world trade growth to world gross product growth has declined
significantly since the 1990s. While global import penetration is expected to exhibit a modest recovery, world trade growth is unlikely to outpace world gross product significantly in
the coming years. World trade is projected to expand by 2.7 per cent in 2017 and 3.3 per
cent in 2018.
Closing the investment gap to achieve the SDGs by 2030 requires
the mobilization of significant financial resources
The prolonged slowdown in global economic growth makes generating the long-term investment necessary for achieving the SDGs particularly challenging. International finance
is a critical complement to domestic revenue mobilization, which has grown steadily in
developing countries over the last 15 years, but has yet to close investment financing gaps.
vii
viii
World Economic Situation and Prospects 2017
However, international capital inflows remain volatile, and net flows to developing countries are estimated to remain negative at least through 2017, underscoring the challenges of
financing long-term sustainable development.
Since the global financial crisis, low interest rates have prompted sovereign bond issuance by developing countries in international capital markets. However, in some cases, concerns over debt sustainability are now being realised, especially where repayment burdens
are subject to significant exchange rate movements. The provision of international public
finance, including official development assistance (ODA) from Members of the OECD
Development Assistance Committee, increased in 2015, but remains below United Nations
targets. The increase in ODA to a large extent reflects the resources spent on refugees in host
countries. Lending by multilateral development banks and through South-South cooperation also increased in 2015. Nonetheless, available domestic and international financial
resources remain insufficient to fill investment financing gaps for sustainable development,
particularly in the poorest countries.
Aligning institutional investment with sustainable development
requires a change in the incentive structure
Aligning investment with the SDGs, including building sustainable and resilient infrastructure, requires policies and regulatory frameworks that incentivize changes in investment patterns. Current FDI patterns are not fully aligned with sustainable development,
and the bulk of recent flows have been directed towards cross-border mergers and acquisitions, which may have limited impact on jobs and development. A reallocation of 3 to 5
per cent of institutional investor assets towards long-term investment in sustainable development could have an enormous impact. Yet to date, investment by institutional investors
in the long-term illiquid assets necessary for sustainable development has been limited.
Investment by institutional investors has tended to be short-term oriented, as reflected in
the volatility of cross-border portfolio flows. Volatile international portfolio and banking
flows can undermine sustainable development rather than support it.
Aligning incentives in capital markets with long-term investment in sustainable
development and also incentivizing greater direct investment can be addressed through the
financial governance architecture, and supported through various policy mixes including
pricing externalities, effective regulatory frameworks, blended finance and guarantees and
leveraging private investment through public intermediaries, such as development banks.
Uncertainties and risks
The materialization of several key downside risks
could prolong the period of weak global growth
Global economic prospects remain subject to significant uncertainties and risks that are
weighted on the downside, with the potential to obstruct the modest acceleration in growth
that is currently forecast for 2017-2018. Some of these risks stem from monetary policy actions in major developed economies. The impact of introducing untested monetary policy
instruments — such as the negative interest rate policies in Japan and Europe — remains
unclear. There is a risk that such measures could lead to a deterioration of bank balance
Executive Summary
sheets, causing credit conditions to tighten, with the potential to destabilize fragile and
undercapitalized banks. The timing of interest rate rises in the United States is another area
of uncertainty. As interest rate differentials relative to other developed economies widen,
this has the potential to trigger financial volatility, reversal of capital inflows to developing
economies, and abrupt adjustments in exchange rates. Such volatility would exacerbate
vulnerabilities associated with high levels of debt and rising default rates in a number of
developing countries, with the potential to push up borrowing costs, raise deleveraging
pressures, and increase banking sector stress.
Policy uncertainty in the United States and Europe has widened
the confidence bounds around global economic forecasts
There are also considerable uncertainties in the international policy environment. For example, uncertainties remain high with respect to the forthcoming changes by the new Administration of the United States to important policies in international trade, immigration,
and climate change. The decision by the United Kingdom of Great Britain and Northern
Ireland to leave the European Union, or “Brexit”, and its potential implications for the free
movement of goods and workers in Europe, also poses considerable regional uncertainty. All of these uncertainties have the potential to undermine any projected recovery in
business investment, impede international trade growth and even derail the already weak
global growth.
Policy challenges and the way forward
A more balanced policy mix is needed, moving beyond
excessive reliance on monetary policy
Many economies continue to place excessive dependence on monetary policy to support
their objectives. In order to restore the global economy to a healthy growth trajectory over
the medium-term, as well as tackle issues in the social and environmental dimensions of
sustainable development, a more balanced policy approach is needed. In addition to a more
effective use of fiscal policy, balanced achievement of the SDGs requires moving beyond
demand management, to ensure that macroeconomic policy measures are fully integrated
with structural reforms and policies that target, for example, poverty, inequality and climate change.
A broader policy toolkit is called for, to be adapted as appropriate to individual
country circumstances. For example, structural reforms could encompass a broader use
of income policy to tackle inequalities and sustain demand, as well as active labour market policies to support vulnerable or marginalized sectors of the labour market. Effective
financial regulation and incentives should mobilize resources and encourage investment
in inclusive and resilient infrastructure, social services and green technology. In addition,
investment in education, worker training and the research base will promote workforce
skills and foster innovation. Policies should encourage a dynamic business environment
aligned with sustainable development, including inclusive access to finance, transparent
administrative procedures and effective regulatory frameworks.
ix
With domestic resource mobilization limited by structural factors, additional concessional international public financing is needed to support developing countries, especially
the LDCs.
Enhancing international policy coordination
under the new 2030 Agenda
International coordination is needed to ensure consistency and complementarities among
trade policy, investment policy and other public policies and to better align the multilateral
trading system with the 2030 Agenda for Sustainable Development, ensuring inclusive
growth and decent work for all. These efforts would be supported by a transparent international services market that facilitates the participation of service providers from developing
countries in particular. International cooperative efforts are also needed to reduce high
trade financing gaps, especially among the poorest countries in Africa, developing Asia, and
the small island developing States. To ensure that development concerns are addressed by
the global trading system, a stronger role for the World Trade Organization is warranted.
Deeper international cooperation is also needed in many other areas, such as expediting clean technology transfer, supporting climate finance, expanding international public
finance and ODA, strengthening international tax cooperation and tackling illicit financial
flows, providing a global financial safety net and coordinating policy to address the challenges posed by large movements of refugees and migrants. These issues were recognized at
the Hangzhou G20 Summit, where the need for deeper international policy coordination
was duly stressed.
Table of Contents
Table of contents
Acknowledgements. . . . . . . . . . . . . . . . . . . . . . . . . . . . . . . . . . . . . . . . . . . . . . . . . . . . . iii
Explanatory notes. . . . . . . . . . . . . . . . . . . . . . . . . . . . . . . . . . . . . . . . . . . . . . . . . . . . . . iv
Executive summary. . . . . . . . . . . . . . . . . . . . . . . . . . . . . . . . . . . . . . . . . . . . . . . . . . . . . v
Chapter I
Global economic outlook
Prospects for the world economy in 2017–2018. . . . . . . . . . . . . . . . . . . . . . . . . . . . . . .
Global growth prospects. . . . . . . . . . . . . . . . . . . . . . . . . . . . . . . . . . . . . . . . . . . .
Inflation prospects . . . . . . . . . . . . . . . . . . . . . . . . . . . . . . . . . . . . . . . . . . . . . . . . .
Employment and labour productivity. . . . . . . . . . . . . . . . . . . . . . . . . . . . . . . . . . .
Investment. . . . . . . . . . . . . . . . . . . . . . . . . . . . . . . . . . . . . . . . . . . . . . . . . . . . . . .
Trade, capital flows and remittances . . . . . . . . . . . . . . . . . . . . . . . . . . . . . . . . . . . . . . .
International trade flows. . . . . . . . . . . . . . . . . . . . . . . . . . . . . . . . . . . . . . . . . . . .
Capital inflows to emerging economies . . . . . . . . . . . . . . . . . . . . . . . . . . . . . . . . .
Remittances. . . . . . . . . . . . . . . . . . . . . . . . . . . . . . . . . . . . . . . . . . . . . . . . . . . . . .
Global imbalances. . . . . . . . . . . . . . . . . . . . . . . . . . . . . . . . . . . . . . . . . . . . . . . . .
Sustainability and inclusiveness of economic growth. . . . . . . . . . . . . . . . . . . . . . . . . . .
Poverty and inequality. . . . . . . . . . . . . . . . . . . . . . . . . . . . . . . . . . . . . . . . . . . . . .
Energy and environment . . . . . . . . . . . . . . . . . . . . . . . . . . . . . . . . . . . . . . . . . . . .
Major uncertainties and risks in the global economy . . . . . . . . . . . . . . . . . . . . . . . . . .
Uncertainties about major changes in the
international policy environment. . . . . . . . . . . . . . . . . . . . . . . . . . . . . . . . .
Uncertainties and risks associated with unconventional monetary policy . . . . . . .
Risks associated with debt overhang in emerging economies. . . . . . . . . . . . . . . . .
Other risks to the outlook . . . . . . . . . . . . . . . . . . . . . . . . . . . . . . . . . . . . . . . . . . .
Policy challenges . . . . . . . . . . . . . . . . . . . . . . . . . . . . . . . . . . . . . . . . . . . . . . . . . . . . . .
Reorienting towards a more effective policy mix . . . . . . . . . . . . . . . . . . . . . . . . . .
Enhancing international policy coordination under the new 2030 Agenda . . . . . .
Appendix. . . . . . . . . . . . . . . . . . . . . . . . . . . . . . . . . . . . . . . . . . . . . . . . . . . . . . . . . . . . .
Baseline forecast assumptions. . . . . . . . . . . . . . . . . . . . . . . . . . . . . . . . . . . . . . . .
Monetary policy. . . . . . . . . . . . . . . . . . . . . . . . . . . . . . . . . . . . . . . . . . . . . . . . . . .
Fiscal policy. . . . . . . . . . . . . . . . . . . . . . . . . . . . . . . . . . . . . . . . . . . . . . . . . . . . . .
Exchange rates. . . . . . . . . . . . . . . . . . . . . . . . . . . . . . . . . . . . . . . . . . . . . . . . . . . .
Oil price. . . . . . . . . . . . . . . . . . . . . . . . . . . . . . . . . . . . . . . . . . . . . . . . . . . . . . . . .
1
1
8
9
12
15
15
20
22
23
25
25
28
30
30
32
33
33
34
34
36
39
39
39
42
43
44
xi
xii
World Economic Situation and Prospects 2016
Page
Chapter II
International trade
Trade flows. . . . . . . . . . . . . . . . . . . . . . . . . . . . . . . . . . . . . . . . . . . . . . . . . . . . . . . . . . .
General trend in trade flows. . . . . . . . . . . . . . . . . . . . . . . . . . . . . . . . . . . . . . . . . .
Trade in services. . . . . . . . . . . . . . . . . . . . . . . . . . . . . . . . . . . . . . . . . . . . . . . . . . .
Trends in commodity prices. . . . . . . . . . . . . . . . . . . . . . . . . . . . . . . . . . . . . . . . . . . . . .
Food and agricultural commodities. . . . . . . . . . . . . . . . . . . . . . . . . . . . . . . . . . . .
Minerals, metals and ores. . . . . . . . . . . . . . . . . . . . . . . . . . . . . . . . . . . . . . . . . . . .
Oil prices. . . . . . . . . . . . . . . . . . . . . . . . . . . . . . . . . . . . . . . . . . . . . . . . . . . . . . . .
Trade policy developments. . . . . . . . . . . . . . . . . . . . . . . . . . . . . . . . . . . . . . . . . . . . . . .
Multilateral trade negotiations. . . . . . . . . . . . . . . . . . . . . . . . . . . . . . . . . . . . . . . .
Plurilateral negotiations. . . . . . . . . . . . . . . . . . . . . . . . . . . . . . . . . . . . . . . . . . . . .
Regional trade agreements. . . . . . . . . . . . . . . . . . . . . . . . . . . . . . . . . . . . . . . . . . .
Trade and least developed countries. . . . . . . . . . . . . . . . . . . . . . . . . . . . . . . . . . . .
The way forward. . . . . . . . . . . . . . . . . . . . . . . . . . . . . . . . . . . . . . . . . . . . . . . . . . .
45
45
48
56
57
59
60
64
64
66
67
68
69
Chapter III
Finance for sustainable development
Trends in net resource transfers and international reserves. . . . . . . . . . . . . . . . . . . . . .
Trends in private resources for sustainable development . . . . . . . . . . . . . . . . . . . . . . . .
Foreign direct investment. . . . . . . . . . . . . . . . . . . . . . . . . . . . . . . . . . . . . . . . . . . .
Other investment, including bank lending . . . . . . . . . . . . . . . . . . . . . . . . . . . . . .
Portfolio flows . . . . . . . . . . . . . . . . . . . . . . . . . . . . . . . . . . . . . . . . . . . . . . . . . . . .
Analysis of volatility. . . . . . . . . . . . . . . . . . . . . . . . . . . . . . . . . . . . . . . . . . . . . . . .
Incentives to align institutional investment with sustainable development . . . . . .
Trends in public resource flows . . . . . . . . . . . . . . . . . . . . . . . . . . . . . . . . . . . . . . . . . . .
Provision of international public finance . . . . . . . . . . . . . . . . . . . . . . . . . . . . . . . .
Cross-border aid flows. . . . . . . . . . . . . . . . . . . . . . . . . . . . . . . . . . . . . . . . . . . . . .
Domestic public resource mobilization . . . . . . . . . . . . . . . . . . . . . . . . . . . . . . . . .
Debt and debt sustainability . . . . . . . . . . . . . . . . . . . . . . . . . . . . . . . . . . . . . . . . .
Conclusions. . . . . . . . . . . . . . . . . . . . . . . . . . . . . . . . . . . . . . . . . . . . . . . . . . . . . . . . . . .
74
76
78
79
80
81
85
91
91
95
97
99
102
Chapter IV
Regional developments and outlook
Developed economies. . . . . . . . . . . . . . . . . . . . . . . . . . . . . . . . . . . . . . . . . . . . . . . . . . .
North America: inventory destocking restricted
growth in the United States in 2016 . . . . . . . . . . . . . . . . . . . . . . . . . . . . . .
Developed Asia and Pacific: policy easing measures
will support growth in Japan in 2017 . . . . . . . . . . . . . . . . . . . . . . . . . . . . .
Europe: economic activity in Europe will remain subdued . . . . . . . . . . . . . . . . . .
Economies in transition . . . . . . . . . . . . . . . . . . . . . . . . . . . . . . . . . . . . . . . . . . . . . . . . .
The Commonwealth of Independent States:
tentative recovery amid persistent uncertainty. . . . . . . . . . . . . . . . . . . . . . .
South-Eastern Europe: economic growth accelerates. . . . . . . . . . . . . . . . . . . . . . .
105
105
108
110
113
114
120
Table of Contents
Page
Developing economies . . . . . . . . . . . . . . . . . . . . . . . . . . . . . . . . . . . . . . . . . . . . . . . . . .
Africa: growth expected to recover at a moderate pace. . . . . . . . . . . . . . . . . . . . . .
East Asia: domestic demand continues to drive positive
near-term outlook amid weak export performance . . . . . . . . . . . . . . . . . . .
South Asia: positive economic outlook supported
by robust private consumption. . . . . . . . . . . . . . . . . . . . . . . . . . . . . . . . . . .
Western Asia: subdued growth and continuing macroeconomic adjustments . . . .
Latin America and the Caribbean:
a return to positive growth is projected for 2017 . . . . . . . . . . . . . . . . . . . . .
121
121
129
133
138
141
Boxes
I.1
I.2
I.3
I.4
II.1
II.2
II.3
II.4
III.1
IV.1
IV.2
IV.3
IV.4
Prospects for the least developed countries . . . . . . . . . . . . . . . . . . . . . . . . . .
The slowdown in productivity growth: a view from international trade . . . .
Uncertainties associated with Brexit. . . . . . . . . . . . . . . . . . . . . . . . . . . . . . .
Measuring fiscal space . . . . . . . . . . . . . . . . . . . . . . . . . . . . . . . . . . . . . . . . .
Digital economy and ICT services-enabled trade. . . . . . . . . . . . . . . . . . . . .
Trends in international tourism . . . . . . . . . . . . . . . . . . . . . . . . . . . . . . . . . .
Recent trends and the future of the gold market. . . . . . . . . . . . . . . . . . . . . .
G20 policies and LDCs’ economic integration. . . . . . . . . . . . . . . . . . . . . . .
Emerging markets’ corporate debt. . . . . . . . . . . . . . . . . . . . . . . . . . . . . . . . .
The “de-offshorisation” of the Russian economy. . . . . . . . . . . . . . . . . . . . . .
The impact of China’s economic slowdown on Africa. . . . . . . . . . . . . . . . . .
The impact of unrest and conflict in the Arab region. . . . . . . . . . . . . . . . . .
Fiscal challenges in Latin America and the Caribbean. . . . . . . . . . . . . . . . .
5
16
31
35
51
54
61
70
89
118
126
136
142
Figures
I.1
I.2
I.3
I.1.1
I.1.2
I.4
I.5
I.6
I.7
Revision of world gross product forecast since WESP 2016 . . . . . . . . . . . . . 2
Gross domestic product per capita growth by region. . . . . . . . . . . . . . . . . . . 2
Projected contributions to GDP growth, 2016–2018 . . . . . . . . . . . . . . . . . . 4
Decomposition of average annual GDP growth projections, 2015–2030 . . . 6
GDP per capita in LDCs relative to developed country average, 1995–2030.7
Inflation relative to central bank target in 2016 . . . . . . . . . . . . . . . . . . . . . . 8
Price of Brent crude, January 2014–December 2018. . . . . . . . . . . . . . . . . . . 9
Average annual labour productivity and real wage growth, 2008–2015 . . . . 10
Decomposition of average annual GDP growth in major developed
economies. . . . . . . . . . . . . . . . . . . . . . . . . . . . . . . . . . . . . . . . . . . . . . . . . . . 11
I.8 Decomposition of average annual GDP growth in major developing
economies and economies in transition. . . . . . . . . . . . . . . . . . . . . . . . . . . . 11
I.9 Average year-on-year change in private non-residential investment in
developed economies (constant prices) . . . . . . . . . . . . . . . . . . . . . . . . . . . . . 13
xiii
xiv
World Economic Situation and Prospects 2016
Page
I.10 Average annual change in general government investment (constant prices),
2011–2015 . . . . . . . . . . . . . . . . . . . . . . . . . . . . . . . . . . . . . . . . . . . . . . . . . . 14
I.11 Average year-on-year change in gross fixed capital formation in developing
and transition economies (constant prices) . . . . . . . . . . . . . . . . . . . . . . . . . 15
I.2.1 Growth of labour productivity and growth of exports, 2003–2007 and
2013–2015 . . . . . . . . . . . . . . . . . . . . . . . . . . . . . . . . . . . . . . . . . . . . . . . . . . 17
I.2.2 Growth of labour productivity and growth of private investment,
2003–2007 and 2013–2015 . . . . . . . . . . . . . . . . . . . . . . . . . . . . . . . . . . . . . 17
I.12 Average year-on-year change in merchandise imports (volume) . . . . . . . . . . 18
I.13 Average year-on-year change in merchandise exports (volume). . . . . . . . . . . 19
I.14 Average annual change in world trade and world gross product by decade
(constant prices). . . . . . . . . . . . . . . . . . . . . . . . . . . . . . . . . . . . . . . . . . . . . . 19
I.15 Yield spreads on emerging economies sovereign bonds,
January 2007–November 2016. . . . . . . . . . . . . . . . . . . . . . . . . . . . . . . . . . . 20
I.16 Equity market indices in selected developing countries,
January 2014–October 2016. . . . . . . . . . . . . . . . . . . . . . . . . . . . . . . . . . . . . 21
I.17 Degree of concentration of remittance sources for selected countries, 2015. 23
I.18 Share of remittances from the United Kingdom in total remittance
inflows, 2015. . . . . . . . . . . . . . . . . . . . . . . . . . . . . . . . . . . . . . . . . . . . . . . . 23
I.19 Global imbalances: Current account balances in per cent of world gross
product, 2000–2018. . . . . . . . . . . . . . . . . . . . . . . . . . . . . . . . . . . . . . . . . . . 24
I.20 Nominal effective exchange rate of the United States dollar,
January 2010–October 2016 . . . . . . . . . . . . . . . . . . . . . . . . . . . . . . . . . . . . 25
I.21 Extreme poverty headcount ratios in 2012 and projections for 2030,
holding inequality constant . . . . . . . . . . . . . . . . . . . . . . . . . . . . . . . . . . . . . 26
I.22 Evolution of income distribution, by region, 1984–2014. . . . . . . . . . . . . . . . 27
I.23 World gross product growth and carbon emissions growth, 1991–2015 . . . . 28
I.24 Marginal effect of one percentage point change in GDP growth on
carbon emissions growth, 1980–2015. . . . . . . . . . . . . . . . . . . . . . . . . . . . . . 29
I.25 Global new investment in renewable energy, 2004–2015 . . . . . . . . . . . . . . . 30
I.4.1 A comparison of different fiscal space measures in 2014 . . . . . . . . . . . . . . . 36
I.A.1 Key policy rates, March 2012–December 2018. . . . . . . . . . . . . . . . . . . . . . . 39
I.A.2 Total assets of major central banks, December 2006–December 2018. . . . . 40
I.A.3 Global divergence in policy rates since December 2015 . . . . . . . . . . . . . . . . 41
I.A.4 Data and assumptions on major currency exchange rates. . . . . . . . . . . . . . . 44
I.A.5 Data and assumptions for the price of Brent crude. . . . . . . . . . . . . . . . . . . . 44
II.1 Growth of volume of world trade and growth of world gross product,
1990–2018. . . . . . . . . . . . . . . . . . . . . . . . . . . . . . . . . . . . . . . . . . . . . . . . . . 45
II.2 Year-on-year change in global gross fixed capital formation and growth
of world trade, 1990–2015. . . . . . . . . . . . . . . . . . . . . . . . . . . . . . . . . . . . . . 46
II.3 Import intensity of the expenditure components of GDP. . . . . . . . . . . . . . . 46
II.4 Trade-restrictive measures, G20, October 2010–May 2016 . . . . . . . . . . . . . 47
Table of Contents
Page
II.5Trade in goods and services, global and by country groups, 2005–2015. . . .
II.6 Growth rate in trade in services by country groups and sectors,
2005–2015 (CAGR) and 2015 . . . . . . . . . . . . . . . . . . . . . . . . . . . . . . . . . . .
II.7 Developing economies, share in global services exports by sector,
2005 and 2015. . . . . . . . . . . . . . . . . . . . . . . . . . . . . . . . . . . . . . . . . . . . . . .
II.1.1 Digital divide: gap of low and middle income economies from the world
average, 2007–2014 (per 100 users or subscriptions). . . . . . . . . . . . . . . . . . .
II.2.1 Year-on-year real change in international tourism
(BOP Travel & Passenger transport) and merchandise trade, 2006–2015 . .
II.2.2 International tourism (BOP Travel & Passenger transport) and exports,
world total, 1995–2015. . . . . . . . . . . . . . . . . . . . . . . . . . . . . . . . . . . . . . . . .
II.8 UNCTAD non-oil Commodity Price Index,
January 2010–September 2016. . . . . . . . . . . . . . . . . . . . . . . . . . . . . . . . . . .
II.9Percentage change of the price index of selected commodities between
January and July 2016 . . . . . . . . . . . . . . . . . . . . . . . . . . . . . . . . . . . . . . . . .
II.10 Price indices of food and agricultural commodity groups,
January 2010–September 2016. . . . . . . . . . . . . . . . . . . . . . . . . . . . . . . . . . .
II.11Price indices of selected minerals, ores and metals,
January 2010–September 2016.. . . . . . . . . . . . . . . . . . . . . . . . . . . . . . . . . .
II.3.1Gold investment demand, 2006 – mid-2016 . . . . . . . . . . . . . . . . . . . . . . . . .
II.12 Oil price and major events, October 2015–November 2016. . . . . . . . . . . . .
II.13 Crude oil prices and the US dollar, January 2000– October 2016. . . . . . . . .
II.4.1 Impact of duty free access and elimination of negative effect of NTMs
on LDC exports to G20 countries, by product. . . . . . . . . . . . . . . . . . . . . . .
II.4.2 Impact of duty free access and elimination of negative effect of NTMs
on LDCs total exports, by G20 country. . . . . . . . . . . . . . . . . . . . . . . . . . . .
III.1 Net transfer of resources to developing economies and economies in
transition, 2004–2016 . . . . . . . . . . . . . . . . . . . . . . . . . . . . . . . . . . . . . . . . .
III.2 Foreign exchange reserves as a percentage of world gross product, 1990–
2015. . . . . . . . . . . . . . . . . . . . . . . . . . . . . . . . . . . . . . . . . . . . . . . . . . . . . . .
III.3 Net financial flows to developing countries and economies in transition,
2006–2016. . . . . . . . . . . . . . . . . . . . . . . . . . . . . . . . . . . . . . . . . . . . . . . . . .
III.4 International claims of BIS reporting banks vis-à-vis developing countries,
2000 Q1–2016 Q2. . . . . . . . . . . . . . . . . . . . . . . . . . . . . . . . . . . . . . . . . . . .
III.5 Volume of portfolio and other investment flows, selected
countries and years. . . . . . . . . . . . . . . . . . . . . . . . . . . . . . . . . . . . . . . . . . . .
III.6 Volatility of capital flows, selected countries and years. . . . . . . . . . . . . . . . .
III.7 Yield spreads of USD Libor (3-month) over OIS rates, 2007–2008 . . . . . . .
III.1.1 Debt service-to-income ratio of the private non-financial sector, selected
countries and years . . . . . . . . . . . . . . . . . . . . . . . . . . . . . . . . . . . . . . . . . . .
III.1.2 Sectoral contribution to the increase in nominal value of
total debt and capital stock, 2010–2014 . . . . . . . . . . . . . . . . . . . . . . . . . . . .
III.8 Net disbursements of ODA, CPA and OOF to developing countries by all
donors, 2000–2014. . . . . . . . . . . . . . . . . . . . . . . . . . . . . . . . . . . . . . . . . . . .
49
50
50
52
55
55
56
.57
.58
59
61
62
64
71
71
.75
.75
.76
.81
.82
.83
.86
.89
.90
.93
xv
xvi
World Economic Situation and Prospects 2016
III.9 Net disbursements of ODA, CPA and OOF to LDCs by all donors,
2000–2014. . . . . . . . . . . . . . . . . . . . . . . . . . . . . . . . . . . . . . . . . . . . . . . . . . .93
III.10 Multilateral development bank financing, 2000–2015 . . . . . . . . . . . . . . . . . .94
III.11 Annual disbursement of selected regional and national development banks,
2000–2015 . . . . . . . . . . . . . . . . . . . . . . . . . . . . . . . . . . . . . . . . . . . . . . . . . .95
III.12 ODA disbursements as percentage of recipient GNI, selected years . . . . . . . .96
III.13 Official flows and sovereign borrowing for developing countries and LDCs,
2014. . . . . . . . . . . . . . . . . . . . . . . . . . . . . . . . . . . . . . . . . . . . . . . . . . . . . . . .98
III.14 Median tax revenue as a share of GDP by various country groupings,
1991–2013 . . . . . . . . . . . . . . . . . . . . . . . . . . . . . . . . . . . . . . . . . . . . . . . . . . .99
III.15 Aggregate global tax revenue, 2000–2013. . . . . . . . . . . . . . . . . . . . . . . . . . . .99
III.16 Finance for LDC governments, 2000–2013. . . . . . . . . . . . . . . . . . . . . . . . . .100
III.17 External debt of developing countries, 2000–2015 . . . . . . . . . . . . . . . . . . . .101
III.18 External short-term debt as a share of total external debt, 2000–2015 . . . . . .102
IV.1 Contribution to GDP growth in the United States, 2014Q1–2016Q3 . . . . . .106
IV.2 Oil price, investment and exchange rate in Canada, 2013Q1–2016Q2. . . . . .107
IV.3 Inflation in Japan, January 2010–August 2016 (year-on-year) . . . . . . . . . . . .108
IV.4 Major developed market currencies’ exchange rate against the
United States dollar, January 2016–October 2016 . . . . . . . . . . . . . . . . . . . . .111
IV.5 Oil price and the terms of trade of selected CIS energy exporters,
2010–2017 . . . . . . . . . . . . . . . . . . . . . . . . . . . . . . . . . . . . . . . . . . . . . . . . . . .114
IV.6 Annual change in gross fixed investment in selected CIS economies,
2012–2016 . . . . . . . . . . . . . . . . . . . . . . . . . . . . . . . . . . . . . . . . . . . . . . . . . . .115
IV.1.1 Net private capital flows in the Russian Federation,
rolling four quarters, 2001Q1-2016Q2. . . . . . . . . . . . . . . . . . . . . . . . . . . . . .118
IV.1.2 Oil price and current account balance of the Russian Federation,
2000–2015. . . . . . . . . . . . . . . . . . . . . . . . . . . . . . . . . . . . . . . . . . . . . . . . . . .119
IV.1.3 Net incurrence of liabilities by Russian residents,
by investment category, 2008–2015. . . . . . . . . . . . . . . . . . . . . . . . . . . . . . . .119
IV.7 Average annual GDP growth in Africa, by subregion, 2001–2018 . . . . . . . . .122
IV.8 Fiscal deficits of selected oil and metal-exporting African economies,
2003–2007 vs. 2016. . . . . . . . . . . . . . . . . . . . . . . . . . . . . . . . . . . . . . . . . . . .124
IV.9 GDP growth and inflation in selected African economies, 2016. . . . . . . . . . .125
IV.2.1 Growth of China’s imports of goods and services in constant 2010 prices,
1996–2016 (year-on-year). . . . . . . . . . . . . . . . . . . . . . . . . . . . . . . . . . . . . . . .126
IV.2.2 China’s imports from Africa, 1995–2015 . . . . . . . . . . . . . . . . . . . . . . . . . . . .127
IV.2.3 Chinese loans to Africa, 2000–2014. . . . . . . . . . . . . . . . . . . . . . . . . . . . . . . .128
IV.10 Contributions to real GDP growth in East Asia and selected economies,
2015–2017 . . . . . . . . . . . . . . . . . . . . . . . . . . . . . . . . . . . . . . . . . . . . . . . . . . .129
IV.11 Public debt and short-term fiscal spending multipliers of selected
economies in East Asia (2007 vs. 2015) . . . . . . . . . . . . . . . . . . . . . . . . . . . . .131
IV.12 Cumulative total of non-tariff measures imposed on goods from East Asia,
by imposing regional group, 2000–2016 . . . . . . . . . . . . . . . . . . . . . . . . . . . .132
Table of Contents
IV.13 GDP growth for selected countries in South Asia, 2012–2018. . . . . . . . . . .
IV.14 Tax revenues in South Asia and world regions, latest available year. . . . . . . .
IV.3.1 Level of GDP: countries in and affected by conflicts, 2010–2015. . . . . . . . .
IV.3.2 Fiscal balance: countries in and affected by conflicts, 2011–2015. . . . . . . . .
IV.15 GDP growth for selected countries in Western Asia, 2012–2018 . . . . . . . . .
IV.16 Fiscal deficits in GCC countries, 2013–2016 . . . . . . . . . . . . . . . . . . . . . . . .
IV.4.1 Change in central government capital expenditures in
Latin America and the Caribbean, 2014–2015 (year-on-year) . . . . . . . . . . .
IV.4.2 Central government capital expenditures in Latin America and the
Caribbean, 2014–2015. . . . . . . . . . . . . . . . . . . . . . . . . . . . . . . . . . . . . . . . .
IV.17 Contributions to real GDP growth in Latin America and the Caribbean
subregions, 2015–2017. . . . . . . . . . . . . . . . . . . . . . . . . . . . . . . . . . . . . . . . .
IV.18 Changes in gross fixed capital formation in Latin America,
2012Q1–2016Q1 (year-on-year). . . . . . . . . . . . . . . . . . . . . . . . . . . . . . . . . .
IV.19 General government primary balance in selected Latin American
economies, 2011–2016 . . . . . . . . . . . . . . . . . . . . . . . . . . . . . . . . . . . . . . . . .
IV.20 Real effective exchange rates of selected economies in Latin America,
January 2012–September 2016. . . . . . . . . . . . . . . . . . . . . . . . . . . . . . . . . . .
.133
.135
.136
137
.138
.140
.142
.143
.144
.144
.145
.146
Tables
I.1 Growth of world output, 2014–2018. . . . . . . . . . . . . . . . . . . . . . . . . . . . . . . .3
III.1 Net financial flows to developing countries and economies in transition,
2007–2016. . . . . . . . . . . . . . . . . . . . . . . . . . . . . . . . . . . . . . . . . . . . . . . . . . .77
III.2 Average number of months of elevated volatility per year, selected countries..84
III.3 Tax revenue by region, 2013. . . . . . . . . . . . . . . . . . . . . . . . . . . . . . . . . . . . . .100
Statistical annex
Country classifications . . . . . . . . . . . . . . . . . . . . . . . . . . . . . . . . . . . . . . . . . . . . . . . 151
Data sources, country classifications and aggregation methodology. . . . . . . . . . . . . . .
Tables
A. Developed economies. . . . . . . . . . . . . . . . . . . . . . . . . . . . . . . . . . . . . . . . . .
B. Economies in transition . . . . . . . . . . . . . . . . . . . . . . . . . . . . . . . . . . . . . . . .
C. Developing economies by region. . . . . . . . . . . . . . . . . . . . . . . . . . . . . . . . . .
D. Fuel-exporting countries. . . . . . . . . . . . . . . . . . . . . . . . . . . . . . . . . . . . . . . .
E. Economies by per capita GNI in September 2016. . . . . . . . . . . . . . . . . . . . .
F. Least developed countries (as of November 2016). . . . . . . . . . . . . . . . . . . . .
G. Heavily indebted poor countries (as of September 2016). . . . . . . . . . . . . . . .
H. Small island developing States. . . . . . . . . . . . . . . . . . . . . . . . . . . . . . . . . . . .
I. Landlocked developing countries . . . . . . . . . . . . . . . . . . . . . . . . . . . . . . . . .
J. International Organization for Standardization Country Codes. . . . . . . . . .
151
153
153
154
155
156
157
157
158
158
159
xvii
xviii
World Economic Situation and Prospects 2016
Annex tables
A.1
A.2
A.3
A.4
A.5
A.6
A.7
A.8
A.9
A.10
A.11
A.12
A.13
A.14
A.15
A.16
A.17
A.18
Developed economies: rates of growth of real GDP, 2008–2018. . . . . . . . . .
Economies in transition: rates of growth of real GDP, 2008–2018. . . . . . . .
Developing economies: rates of growth of real GDP, 2008–2018. . . . . . . . .
Developed economies: consumer price inflation, 2008–2018. . . . . . . . . . . .
Economies in transition: consumer price inflation, 2008–2018 . . . . . . . . . .
Developing economies: consumer price inflation, 2008–2018 . . . . . . . . . . .
Developed economies: unemployment rates, 2008–2018. . . . . . . . . . . . . . .
Economies in transition and developing economies: unemployment rates,
2007–2016. . . . . . . . . . . . . . . . . . . . . . . . . . . . . . . . . . . . . . . . . . . . . . . . . .
Major developed economies: financial indicators, 2007–2016. . . . . . . . . . . .
Selected economies: real effective exchange rates, broad measurement,
2007–2016. . . . . . . . . . . . . . . . . . . . . . . . . . . . . . . . . . . . . . . . . . . . . . . . . .
Indices of prices of primary commodities, 2007–2016. . . . . . . . . . . . . . . . .
World oil supply and demand, 2008–2017. . . . . . . . . . . . . . . . . . . . . . . . . .
World trade: changes in value and volume of exports and imports,
by major country group, 2008–2018 . . . . . . . . . . . . . . . . . . . . . . . . . . . . . .
Balance of payments on current accounts, by country or country group,
summary table, 2007–2015. . . . . . . . . . . . . . . . . . . . . . . . . . . . . . . . . . . . . .
Balance of payments on current accounts, by country or country group,
2007–2015. . . . . . . . . . . . . . . . . . . . . . . . . . . . . . . . . . . . . . . . . . . . . . . . . .
Net ODA from major sources, by type, 1994–2015 . . . . . . . . . . . . . . . . . . .
Total net ODA flows from OECD Development Assistance Committee
countries, by type, 2006–2015. . . . . . . . . . . . . . . . . . . . . . . . . . . . . . . . . . .
Commitments and net flows of financial resources, by selected
multilateral institutions, 2006–2015 . . . . . . . . . . . . . . . . . . . . . . . . . . . . . .
163
164
165
169
170
171
175
176
178
179
181
182
183
185
186
189
190
191
Bibliography . . . . . . . . . . . . . . . . . . . . . . . . . . . . . . . . . . . . . . . . . . . . . . . . . . . . . . . . 193
Chapter I
Global economic outlook
Prospects for the world economy in 2017–2018
Global growth prospects
The global economy remains trapped in a prolonged period of slow economic growth and
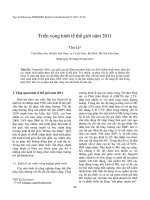
dwindling international trade growth. Since 2012, world gross product (WGP) has expanded at an average annual rate of 2.5 per cent, much lower than the average of 3.4 per cent observed in the decade prior to the financial crisis (figure I.1). In 2016, growth in both WGP
and world trade dropped to their slowest pace since the Great Recession of 2009. WGP is
estimated to have expanded by just 2.2 per cent, reflecting a downward revision of 0.7 percentage points relative to forecasts a year ago (table I.1). The weaker-than-expected growth
performances in Japan, the United States of America and in several countries in Africa, the
Commonwealth of Independent States (CIS) and Latin America and the Caribbean have
contributed to this downward revision relative to forecasts presented in the World Economic
Situation and Prospects (WESP) 2016 (United Nations, 2016a).
The prolonged sluggishness in the global economy has been characterized by a widespread slowdown of productivity growth in many parts of the world, weak investment, low
wage growth, low inflation and rising debt levels. Low commodity prices have exacerbated
these trends in many commodity-exporting countries since mid-2014, while conflict and
geopolitical tensions continue to weigh on economic prospects in several regions.1
While some of the exceptional factors that restrained global growth in 2016 — such
as the destocking cycle in the United States and adjustment to the sharp terms-of-trade
shock faced by commodity-exporters — can be expected to ease, the longer-term pressures
restraining the global economy continue to prevent more robust growth. WGP is forecast
to expand by 2.7 per cent in 2017 and 2.9 per cent in 2018, with this modest recovery more
a reflection of stabilization in the aftermath of negative short-term shocks than a signal
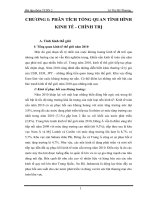
of a dynamic revival of global demand. In per capita terms, this equates to average global
growth of just 1.5 per cent per annum in 2016-2018, compared to an average of 2.1 per
cent in 1998-2007 (figure I.2). The relatively slow pace of economic growth will hamper
progress towards achieving the Sustainable Development Goals (SDGs), as defined in the
2030 Agenda for Sustainable Development, which was adopted by the Member States of
the United Nations in 2015. If downside risks to the outlook were to materialize, this could
push global growth rates down even further, with additional setbacks towards achieving
the SDGs, particularly the goals of eradicating extreme poverty and creating decent work
for all.
1
According to the Global Conflict Tracker, conflict in 28 countries was either worsening or unchanged
in 2016. In addition to the devastating humanitarian crises, conflict zones and neighbouring regions
have suffered heavy economic losses.
In 2016, growth in both
world gross product and
world trade dropped to
their slowest pace since
the Great Recession
of 2009
Sluggish economic
growth poses a challenge
for the Sustainable
Development Goals
2
World Economic Situation and Prospects 2017
Figure I.1
Revision of world gross product forecast since WESP 2016
5
Percentage
4.3
4
Average 1998-2007
3
2
WESP 2016
3.1
1.9
2.5
2.3
2012
2013
2.6
2.5
2.9
2.7
2.2
WESP 2017
1
0
Source: UN/DESA, based
on United Nations Statistics
Division National Accounts Main
Aggregates Database and
UN/DESA forecasts.
-1
-2
-1.8
-3
2008
2009
2010
2011
2014
2015
2016
2017
2018
Figure I.2
Gross domestic product per capita growth by region
8
Percentage
Average 1998–2007
Average 2011–2015
Average 2016–2018*
6
4
Source: UN/DESA, based
on United Nations Statistics
Division National Accounts Main
Aggregates Database, United
Nations Population Division
World Population Prospects and
UN/DESA forecasts.
* Includes estimates for 2016 and
forecasts for 2017-2018.
Factors underpinning
sluggish economic
growth are selfreinforcing, prolonging
the slowdown
2
0
-2
World Developed Economies
economies
in
transition
Africa
East Asia
South
Asia
Western
Asia
Latin
America
and the
Caribbean
Least
developed
countries
The factors underlying the protracted economic slowdown have a tendency to reinforce one another, through the close linkages between demand, investment, trade and
productivity. Firms are unlikely to invest in new projects and expand production when
demand is weak or expected profits are low. This reluctance has been particularly acute in
extractive industries since 2015, as adjustment to the lower level of commodity prices has
intensified the weakness in aggregate demand.
Economic and political uncertainties have also weighed on investment demand in
many countries, while the nexus between profits and investment has weakened in both
developed and developing countries (UNCTAD, 2016a). The declining demand for capi
tal goods associated with weak investment restrains global trade, which in turn curtails
3
Chapter I. Global economic outlook
Table I.1
Growth of world output, 2014–2018
Change from WESP 2016
Annual percentage change
2014
2015
2016a
2017b
2018b
2016
2017
World
2.6
2.5
2.2
2.7
2.9
-0.7
-0.5
Developed economies
1.7
2.1
1.5
1.7
1.8
-0.7
-0.6
United States of America
2.4
2.6
1.5
1.9
2.0
-1.1
-0.9
Japan
-0.1
0.6
0.5
0.9
0.9
-0.8
0.3
European Union
1.5
2.2
1.8
1.8
1.8
-0.2
-0.4
EU-15
1.4
2.0
1.7
1.6
1.7
-0.3
-0.5
EU-13
2.8
3.6
3.0
3.2
3.3
0.0
0.0
Euro area
1.1
1.9
1.6
1.7
1.7
-0.3
-0.3
Other developed countries
2.5
1.6
1.7
2.0
2.2
-0.4
-0.5
Economies in transition
0.9
-2.8
-0.2
1.4
2.0
-1.0
-0.5
South-Eastern Europe
0.2
2.0
2.6
3.1
3.3
0.0
0.1
Commonwealth of Independent States
and Georgia
1.0
-3.0
-0.3
1.4
2.0
-1.0
-0.4
0.7
-3.7
-0.8
1.0
1.5
-0.8
-0.2
4.3
3.8
3.6
4.4
4.7
-0.7
-0.4
Russian Federation
Developing economies
Africa
3.8
3.1
1.7
3.2
3.8
-2.7
-1.2
North Africa
1.8
3.2
2.6
3.5
3.6
-1.5
-0.6
East Africa
7.0
6.6
5.5
6.0
6.3
-1.3
-0.6
Central Africa
5.4
1.5
2.4
3.4
4.2
-1.9
-0.8
West Africa
6.1
3.2
0.1
3.1
4.1
-5.1
-2.2
Southern Africa
2.7
1.9
1.0
1.8
2.6
-2.0
-1.5
East and South Asia
6.1
5.7
5.7
5.9
5.9
-0.1
0.1
6.1
5.7
5.5
5.6
5.6
-0.1
0.0
7.3
6.9
6.6
6.5
6.5
0.2
0.0
6.2
6.0
6.7
6.9
6.9
0.0
-0.1
East Asia
China
South Asia
Indiac
7.3
7.3
7.6
7.7
7.6
0.2
0.2
Western Asia
2.6
2.7
2.1
2.5
3.0
-0.3
-0.5
0.7
-0.6
-1.0
1.3
2.1
-1.7
-1.4
0.1
-1.9
-2.3
0.9
2.0
-2.2
-1.5
0.1
-3.9
-3.2
0.6
1.6
-2.4
-1.7
2.5
2.7
2.3
2.3
2.2
-0.6
-1.1
Latin America and the Caribbean
South America
Brazil
Mexico and Central America
Caribbean
3.1
4.0
2.7
2.7
2.8
-0.9
-0.6
5.7
3.7
4.5
5.2
5.5
-1.1
-0.4
World traded
3.8
2.6
1.2
2.7
3.3
-2.8
-2.0
World output growth with PPP weightse
3.3
3.1
2.9
3.5
3.7
-0.7
-0.4
Least developed countries
Memorandum items
Source: UN/DESA.
a Estimated.
b Forecast, based in part on Project LINK.
c Fiscal year basis.
d Includes goods and services.
e Based on 2012 benchmark.
4
World Economic Situation and Prospects 2017
Policy uncertainty in
the United States and
Europe has widened
the confidence bounds
around global economic
forecasts
The economic downturn
in Brazil may have turned
a corner
investment further. Meanwhile, the extended period of weak investment is a driving factor
behind the more medium-term phenomenon of a slowdown in productivity growth. Weaker productivity growth may be compounded by the broad slowdown in global trade growth,
as international trade, supported by a universal, rules-based, open, non-discriminatory and
equitable multilateral trading system, has the potential to speed the rate of technological
diffusion between countries and improve the efficiency of resource allocation. Weak productivity growth has also curbed wages and progress in poverty reduction, aggravating the
slowdown in aggregate demand. In the absence of concerted policy efforts to revive productive investment and foster a recovery in productivity, there is a risk that the protracted
episode of weak global growth may linger for several more years.
Stable private consumption will remain the mainstay of growth in the developed
economies (figure I.3). The slight increase in gross domestic product (GDP) growth that is
forecast for 2017 is driven primarily by the end of the destocking cycle in the United States
and additional policy support in Japan, including an expansion of government investment
spending. Uncertainty related to the withdrawal of the United Kingdom of Great Britain
and Northern Ireland from the European Union (EU) has led to downward revisions to
growth forecasts for the United Kingdom and several other countries in Europe in 2017.
Meanwhile, the lack of clarity about the future direction of policy in the United States,
with potentially far-reaching spillover effects on both domestic and global economic prospects, has increased the margin of uncertainty around global baseline forecasts.
GDP growth in developing countries, especially in East and South Asia, is expected
to remain driven by domestic consumption. China’s expansion is expected to remain stable,
supported by the strong policy stance, but the rebalancing of the economy continues to
weigh on global trade flows. India is expected to remain the fastest growing large developing economy, as the country benefits from strong private consumption and the gradual
introduction of significant domestic reforms. The downturn in Brazil may have turned a
corner, following the sharp decline in output in 2015 and 2016. Political uncertainty in
Brazil has declined and the foundations of a programme for macro-management have been
introduced. However, high unemployment and a relatively tight fiscal policy stance will
Figure I.3
Projected contributions to GDP growth, 2016–2018
6
Percentage point
4
2
0
-2
-4
Source: UN/DESA forecasts.
Private consumption
Net exports
Investment
GDP
Government consumption
2016
2017
2018
Developed economies
2016
2017
2018
Developing economies
2016
2017
2018
Economies in transition
5
Chapter I. Global economic outlook
continue to weigh on the economy. Meanwhile, growth in the least developed countries
(LDCs) is expected to rise modestly from an estimated 4.5 per cent in 2016 to 5.2 per cent
and 5.5 per cent in 2017 and 2018, respectively (box I.1).
Box I.1
Prospects for the least developed countries
Aggregate growth in the LDCs will remain well below the Sustainable Development Goal (SDG) target of
“at least 7 per cent GDP growth” in the near term, but is expected to rise modestly from an estimated 4.5
per cent in 2016 to 5.2 per cent and 5.5 per cent in 2017 and 2018, respectively, with the rise in per capita
GDP averaging just 2.6 per cent between 2016 and 2018. The below-target growth poses a risk to critical
public expenditure on healthcare, education, social protection and climate change, which may in turn
constrain improvements in living standards and limit progress on poverty reduction.
Among the LDCs, growth performance varies significantly. Fuel and metal exporters have been adversely affected by persistently low global commodity prices, and the loss of commodity-related revenue
has induced significant deterioration in the fiscal balance of countries such as Angola, the Democratic Republic of the Congo, Equatorial Guinea, Mozambique and Zambia. Rising inflationary pressures, fueled in
part by weaker domestic currencies, have also weighed on private consumption and business investment
in these economies. For Angola, where oil accounts for almost 95 per cent of its total exports, growth
decelerated to 0.8 per cent in 2016 and is expected to only improve modestly to 1.8 per cent in 2017.
Growth in many LDCs also remains highly vulnerable to natural catastrophes and weather-related shocks. In 2016, LDCs in the East and Southern African regions, including Ethiopia, Lesotho, Malawi
and Uganda, experienced the worst drought in decades, dampening agriculture production and overall
growth. A prolonged and severe drought also hit agriculture output in Haiti, where the economy also
remains constrained by political uncertainty and institutional weaknesses. Meanwhile, the Nepalese
economy is still recovering from the aftermath of the devastating earthquake of 2015. Amid ongoing
reconstruction efforts, growth in Nepal strengthened in the second half of 2016 and is forecast to exceed
4.0 per cent in 2018.
A few LDCs are expected to achieve a growth rate close to or above the 7 per cent target in 20172018, including Bangladesh, Bhutan, Cambodia, Djibouti, Ethiopia, Lao People’s Democratic Republic,
Myanmar, Rwanda and the United Republic of Tanzania. Myanmar is set to be the fastest growing LDC,
with a projected expansion of 8.0 per cent in 2017, supported by accommodative monetary and fiscal
policies, as well as the implementation of growth enhancing reforms. Growth in Bangladesh is likely
to remain robust at 6.8 per cent in 2017 and 6.6 per cent in 2018, driven by buoyant domestic demand
and a more proactive fiscal stance. As the impact of drought dissipates, growth in Ethiopia is expected
to rebound to above 7.0 per cent in 2017 and 2018, supported by investment to improve power supply,
and the recent completion of a cross-border railway connecting Ethiopia and Djibouti, where growth is
forecast to average 6.8 per cent in 2017-2018. Strong infrastructure investment, particularly in the energy
and transport sectors, is also supporting growth in Cambodia, the Lao People’s Democratic Republic,
Rwanda and the United Republic of Tanzania.
For many LDCs, weak productivity growth, amid poorly diversified economic structures and insufficient levels of investment, remains a challenge to achieving stronger medium-term growth prospects.
If the current pattern continues, related shortfalls in essential investment also put at risk many other
economic, social and environmental targets set in the SDGs.
Figure I.1.1 decomposes the medium-term projections for GDP growth in a selection of LDCs into
the expected average annual contributions from labour input growth and labour productivity growth
over the period 2015-2030.
Productivity growth in most countries is expected to fall well short of what is needed to achieve
the targeted level of GDP growth in the LDCs. Tackling the shortfall in productivity growth will require an
increase in the rate of investment in order to upgrade the existing capital stock and increase the available
capital per worker in the economy.a A model simulation exercise to assess the magnitude of additional
investment needed to close the productivity gaps, and approach an average GDP growth rate of 7 per
cent per annum in the LDCs, suggests that investment growth in the LDCs as a whole would need to
average 11.3 per cent per annum through 2030, an increase of roughly 3 percentage points relative to
(continued)
a See discussion in United
Nations (2016b).
6
World Economic Situation and Prospects 2017
Box I.1 (continued)
baseline projections. While this exceeds the average rate of investment growth of 8.9 per cent recorded
between 2010 and 2015, it is in line with the investment rate recorded during the period of rapid growth
of 2000-2005, when GDP growth in the LDCs as a whole averaged 6.8 per cent per annum. However, the
external environment is expected to be much less supportive to growth in the LDCs than it was in 20002005, when export growth for the group averaged 6.5 per cent per annum.
Figure I.1.1
Decomposition of average annual GDP growth projections, 2015–2030
Percentage point
Source: UN/DESA forecasts.
Note: See Table J in the
Statistical Annex for
definitions of country codes.
LAO
ETH
MMR
TZA
SEN
UGA
BFA
BDI
TCD
AFG
TLS
NER
BEN
SLE
STP
RWA
COD
KHM
MOZ
MLI
TGO
GMB
CAF
MRT
GNB
SOM
LBR
ERI
ZMB
BTN
AGO
DJI
BGD
GIN
COM
MWI
VUT
MDG
SLB
SDN
LSO
NPL
KIR
YEM
HTI
GNQ
Contribution of labour input
Contribution of productivity
-1
0
1
2
3
4
5
6
7
8
Figure I.1.2 illustrates the expected rate of convergence in GDP per capita between the LDCs and
the developed economies under two different scenarios. The baseline scenario represents prospects according to the current forecast, which sees GDP growth in the LDCs averaging 5.2 per cent per annum to
2030. At this rate of growth, GDP per capita can only be expected to converge marginally towards average levels in the developed economies, rising from just 2 per cent of the developed economy average in
2015 to just under 2.5 per cent in 2030.
If, on the other hand, the shortfalls in productivity growth could be closed through an acceleration in investment, there would be a more rapid pace of convergence. This would allow GDP per capita in
the LDC to rise from 2 per cent of the developed country average in 2015 to 3 per cent by 2030.
(continued)