Điều tra thực trạng uống rượu và nghiên cứu sự can thiệp về dinh dưỡng ở Vân Nam_TQThe investigation on drinking practice and research on the interference of nutrition in yi yunnan province
Bạn đang xem bản rút gọn của tài liệu. Xem và tải ngay bản đầy đủ của tài liệu tại đây (1.74 MB, 20 trang )
The investigation on Drinking practice a
nd Research on the Interference of Nutri
tion in Yi, Yunnan Province
Liu Min
Report content
1
Background
2
Aims
3 Research content
4
Methods
5
Results
6
Conclusion
Background
Somcompact e problems related to drinking and
alcohol in China, especially in the community of mino
rity nationality in Yunan Province, now show a gradua
Aims
Aims
1
(1) To understand the drinking pattern
s and health status in Yi people of Yu
nnan Province, probe into the relation
ship between drinking activity and nut
rition condition.
(2) To observe the effects of nutritio
Aims
2
n health education interventions progr
am to the drinkers’ level of nutrition
knowledge, the acknowledgment of the h
arm of alcohol, drinking activity and
nutrition condition, and also, to eval
uate the interfering result.
Research content
1
Baseline characteristics
2
The investigation to interfered targets
3
Nutrition education
4
The investigation to interference of nutrition
5
The evaluation of the result this interference
Use the face to face investigation
Baseline investigation
into every house.
Subjects were asked if they
Based on the result
drunk or not, then they were inveof baseline investigation,
Use the method of
stigated further who given suchFilter
as
object
interfered targets were picluster random
‘usually’ or ‘occasionally’ to detersampling, and 1769 Yi
cked out according to the
mine the category of drinking, the
people over 18 in three
screening criteria that the
frequency of drinking, the amount
poor town-ships of
average time of drinking
of drinking, the source of drinking,
Dayao country (Tanhua,
per week was over 3 times,
Nutrition
education
g
Guihua,
Santai)
in Yi
control
group
the ways
ofDietary
drinking 12
months
survey
was
or the average drinking
Autonomousroup
Prebefore the time being investigated,
amount each
time is 125g
conducted
using
the
mfecture, Chuxiong, Yunthe beginning age to drink, ect.
or more than
that
when
nan Province were
ethod of 24h dietary reconverted into high-degree
selected and investigatcall.
The
dietary
data
wDrinking
beha
wine. And also
the interfered with questionnaire on
Physical
examination
。
evaluated
Interfering with front
Dietary
General survey
Drinking Activity
ed targetere
should
be theviorby the
and Health Condition by
group who
don’t suffer
from
Chinese
Balanced
Diet
face to face, and their
serious illness
which
cantheChinese
Nutrition education
Use the face to faceheight,
in
Pagoda
and
weight and blood
affect
the
nutrition
condithe
level
of nutrition
kn
vestigation
into
every
hou
the acknowledgment
t Use
After confirmed
to be ofAll
pressure were
also
the
face
to
face
inves
RNIs
in
2007.
the
tion of the organism. 。
Interfering
with last
se.
measured.
without
error,
all
the
d
tigation
into
every
house.
heany
harm
of
alcohol
owledge
examinees should fill.
Excessive
ata got from investigati-on
The common
food inhabitual con
alcohoshould have tendency che
the role ofsumption
various of
nutrckup, variance ana-lysis,
ients such lic
asBeverages
soy beansdespite
Statistics
and analysis
physical,mental,
χ2 checkup using the spp Data
and milk, the
role of vari- social,
or economic
harm (e.g., ci
ss11.5 software.
ous vitamins,
the relationrrhosis,drunk
driving and
ship
between
saltofand
hyThe
Evaluation
the
Resul
accidents,family strife, frepertension,ect.
t this Interference
quently missing work)."
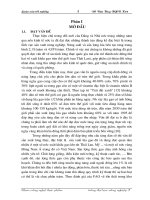
Methods
Height,Weight,Waist,Hip,Blood
pressure
Results
baseline characteristics : The total percent of drinkin
g
There are totally 1769 persons,there
are 1034 men and 735 women.
The total percent of drinking during
sample people is 47.9% , while it is 67.
6% for men and 20.1% for women.
The difference between them has statist
ical meaning , χ2 = 387.862 , P , 0.001 , .
Results
baseline characteristics : The total percent of drinking
For ages, the group in the range of 35-45 years old has the drinking r
ate as high as 59.5%.
Table 1. The comparison among different age groups on drinking rates
Age group
Drinking
people
Survey
people
Drinking
rate(%)
18 ,
49
179
27.4
25 ,
158
390
40.5
35 ,
285
479
59.5
45 ,
218
373
58.4
55 ,
86
190
45.3
65 ,
51
158
32.3
1769
47.9
Note:,,χ2 = 97.172 ,847
P , 0.001
Results
As shown in table 2, intervention group has more information after nutrition propaganda
and education of six months and has a big difference comparing with that before propaganda;
however, the control group has no obvious change.
table 2. The awareness about the relationship between excessive
alcohol consumption and disease (n, %)
Contents
Intervention group
(n=299)
Before
After
Control group
(n=276)
Before
After
Alcoholism
65 , 21.7
,
169 , 56.5 , 88 , 31.9
*
,
91 , 33.0
,
Nutrients deficiency
16 , 5.4 ,
98 , 32.8 ,
*
18 , 6.5 ,
17 , 6.2 ,
Cirrhosis
15 , 5.0 ,
201 , 67.2 ,
25 , 9.1 ,
*
32 , 11.6
,
184 , 61.5 ,
24 , 8.7 , 27 , 9.8 ,
*
Note:,P<0.01, self-comparison before and after
Stomach ulcer
22 , 7.4 ,
Table 3. The average intake of different types of foods between the gender and the
comparison with the national level
Rural
Nationa
l
416.1
402.2
a,b
55.7
49.1
a,b
16.3
16
68.7
78.6
285.6
276.2
a,b
35.6
45.0
a,b
10.9
10.2
a,b
11.4
26.6
27.3±17.9a
20.0
23.7
a,b
30.1
32.9
a,b
10.6
8.7
12.4
12.0
Foods
Male
Female
Per capita
Grain
605.4±258.1
*
500.1±242.
0
582.8±258.2a,
Tubers
53.3±28.9
50.4±26.5
52.7±28.4
Legume
30.1±24.0*
24.1±18.9
28.8±23.1
Meet
80.2±50.8*
65.3±31.5
76.9±47.6a
Vegetables
322.1±133.3
*
281.9±123.
6
313.4±132.2
Fruits
27.3±11.3
21.4±7.1
25.4±10.5
Pickles
19.6±17.9*
28.0±20.0
21.3±18.6
Milk
10.0±4.4
7.8±4.5
8.9±4.5
Eggs
29.1±18.7
21.5±13.9
Vegetable oil
16.8±12.3
17.4±10.4
16.9±11.9
Animal oil
21.9±14.2
21.2±13.3
21.7±14.0
Salt
15.2±5.1
14.7±5.7
15.1±5.2
b
a,b
a,b
204.9±94.6
: * P<0.05,
gender; 197.6±94.2
a: P<0.05, compared
with
Wine comparison between
147.7±75.7
——
—— the
*
Results
Table 3 shows that the various of food of the
object is complete before the nutrition teaching. The
construction of men and women's diet is mainly based on
grain, then vegetables and potatos, after that, meat, beans
and the food from beans,last,eggs and egg products. The
average of of various of food ingestion is different from the
report of Chinese resident nutrition and health investigation
data in 2002.
Table 4. Source analysis about diet nutrition
ingestion
Nutrients
Male
Intake
Female
%
Intake
%
Energy
, kcal ,
Carbohydrate
s
1718.7±863.
2
64.9
1430.5±646.
6
62.0
Protein
280.9±110.5
10.6
232.3±100.3
10.1
Fat
648.5±191.8
24.5
645.9±191.1
27.9
24.0±9.4
34.1
17.0±7.3
29.3
Legumes
9.6±3.8
13.6
8.5±3.7
14.7
Cereals
29.7±11.7
42.2
26.4±11.4
45.5
7.1±2.8
10.1
6.1±2.6
10.5
Animal food
64.4±19.1
81.8
65.5±19.4
84.7
Plant food
14.3±4.2
18.2
11.8±3.5
15.3
Protein , g ,
Animal food
Other food
Fat , g ,
Results
As shown in table 4, man and woman’s protein
ingestion is 10.6% and 10.1% of total energy, respectively.
Man and woman’s fat ingestion is 24.5% and 27.9% of
total energy, respectively.Man and woman’s carbohydrate
ingestion is 64.9% and 62.0% of total energy, respectively.
These three major nutrition factors are reasonable, but fat
ingestion is a little bit high. The main source of protein of
investigated people comes from grain and animal food.
The quality of protein is good.
Table 5. food intake between intervention
before
and after
Intervention
group , g , Control group
Foods
Grain
Before
After
Before
After
579.4
597.1
553.0
588.7
Tubers
54.6
55.5
50.6
53.8
Legume
28.8
37.4*△
27.1
28.1
Meet
76.9
80.4
78.2
75.3*
Vegetables
313.4
321.8△
312.7
291.9
Fruits
25.4
40.0*△
21.4
22.6
Pickles
21.3
11.9*△
23.0
25.6
Milk
8.9
15.2*△
7.8
7.4
Eggs
28.2
42.5*△
25.9
32.6
Vegetable oil
17.2
17.9
16.5
19.6
Animal oil
21.0
15.3*△
22.5
22.7
Salt
15.4
12.8
14.8
14.5
Wine
183.6
54.7*△
187.7
167.9
Note:*P<0.05,compared with pre-intervention; △P<0.05, compared with control group.
Results
food intake between intervention before and after
。g。
As shown in table 5, after 6 months in house nutrition propaganda
and education for propaganda and education group, fruit ingestion
increases; milk and milk product ingestion does not increase
obviously; animal oil and alcohol ingestion obviously decrease and
significantly meaningful comparing with data before propaganda; salt
ingestion decreases a little but no meaning comparing with data
before propaganda. Kinds of food ingestion of control group have no
change before and after intervention.
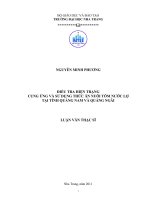
Results
Grain
Vegetables
Fruits
Milk
Animal oil
Salt
Wine
Inta
ke
Before
Three months
interferingTwo weeks
One month
Six months
Fig.2 Food intake of intervention group in different survey points
Conclusion
The
nutrition
health
education
intof b
1.2.
consumption
a general
3.Alcohol
Continuation
and was
expansion
ervention
can increase
the
suchinaYiprogram
should
benutrition
carried
ehavior
people,and
related
kn-owle
knowledge
oftothe
resi-dents
and
co
out
so
as
reduce
the
rate
of
dge about the harm of alcohol and nutriti
rrect the dietary behaviors and pro
chronic diseases among alcohol
on were
poor.
mote very
the nu-trition
status in rural et
drinking residents.
hnic areas.
因 因 因因因
因
因因因因
因因
因
Because of you ……
,,,
,,,
,
,,
,,
,,,
,,,
,
,
,,,
The members of the research group
,,,
,,,
,,
,,,
,,,
,,
,,,
,,,
,,
,,,
,,,
,,,
,,,
,, ,,,
,,,
,,,
,,
,,,
,,, ,,, ,,
,,
,,,