Venkataraman automated versus floor trading an analysis of execution costs on the paris and new york exchanges
Bạn đang xem bản rút gọn của tài liệu. Xem và tải ngay bản đầy đủ của tài liệu tại đây (1.03 MB, 41 trang )
THE JOURNAL OF FINANCE • VOL. LVI, NO. 4 • AUGUST 2001
Automated Versus Floor Trading:
An Analysis of Execution Costs on the Paris
and New York Exchanges
KUMAR VENKATARAMAN*
ABSTRACT
A global trend towards automated trading systems raises the important question
of whether execution costs are, in fact, lower than on trading f loors. This paper
compares the trade execution costs of similar stocks in an automated trading structure ~Paris Bourse! and a f loor-based trading structure ~NYSE!. Results indicate
that execution costs are higher in Paris than in New York after controlling for
differences in adverse selection, relative tick size, and economic attributes across
samples. These results suggest that the present form of the automated trading
system may not be able to fully replicate the benefits of human intermediation on
a trading f loor.
A TRADING MECHANISM IS DEF INED by the distinctive set of rules that govern the
trading process. The rules dictate when and how orders can be submitted,
who may see or handle the orders, how orders are processed, and how prices
are set ~see O’Hara ~1995!!. The rules of trading affect the profitability of
various trading strategies ~see Harris ~1997!!, and hence affect trader behavior, price formation, and trading costs. A fundamental question in securities market design is the link between the rules of the trading mechanism
and the cost of trade execution. Numerous studies have investigated this
issue by comparing bid-ask spreads in the auction-based New York Stock
Exchange ~NYSE! and the dealer-based Nasdaq.1 While much of the debate
centers on the relative merits of auction and dealer markets, an alternative
* Edwin L. Cox School of Business, Southern Methodist University. This paper benefited
greatly from the advice of my dissertation committee, Hank Bessembinder, William Christie,
Jeffrey Coles, and Herbert Kaufman, and suggestions of an anonymous referee. I am grateful
for comments received from participants at the 2000 Financial Management Association and
2001 American Finance Association annual meetings and seminars at Arizona State University,
Santa Clara University, Southern Methodist University, Texas Tech University, University of
Arizona, University of Kansas, and University of Miami. I also thank Jeff Bacidore, Jennifer
Conrad, George Constantinides, Naveen Daniel, Venkat Eleswarapu, John Griffin, Jeffrey Harris, Brian Hatch, Mike Lemmon, Ananth Madhavan, Muku Santhanakrishnan, Bill Schwert,
Hersh Shefrin, and Wanda Wallace for helpful comments and discussion. I am particularly
grateful to Marianne Demarchi of the Paris Bourse for information on the institutional details
of the exchange and for her comments. All errors are entirely my own.
1
For example, Huang and Stoll ~1996! and Bessembinder and Kaufman ~1997a! compare
execution costs of a matched sample of firms from NYSE and Nasdaq. Christie ~1998! provides
an excellent summary of related papers.
1445
1446
The Journal of Finance
perspective is the optimal design of an auction market. The current trend
toward automation of auction trading mechanisms raises the important question: Would a fully automated auction market provide better execution than
a f loor-based market structure? This paper compares the execution cost for
the common stock of similar firms in an automated limit order market ~Paris
Bourse! and a f loor-based limit order market ~NYSE!.
Theoretical models on the competition for order f low between an automated and a hybrid limit order book ~with specialist! ~e.g., Glosten ~1994!,
Seppi ~1997!, and Parlour and Seppi ~1998!! suggest that neither structure is
clearly superior. Domowitz and Steil ~1999! discuss the benefits of automation of trading structures in the framework of network models of industrial
organization. They also survey the empirical literature on the issue and conclude that electronic trading generally yields considerable cost savings over
traditional f loor-based trading. In contrast, Benveniste, Marcus, and Wilhelm ~1992! argue that the professional relationships that evolve on the f loor
of an exchange, due to repeated trading between the specialist and f loor
brokers, result in information sharing on forthcoming order f lows and intrinsic value of the stock. This helps reduce the information asymmetry and
increase the effective liquidity of a traditional f loor-based system.
Empirically, several papers examine the role of the human intermediaries
on a trading f loor.2 The obligations of the NYSE specialist requires her to
maintain meaningful spreads at all times, maintain price continuity, and
trade in a stabilizing manner. Institutional investors prefer to use the f loor
broker to “work” large and difficult orders. The f loor broker can react quickly
to changing market conditions and execute sophisticated trading strategies,
thus reducing market impact and execution costs. On the other hand, anecdotal evidence around the world suggests that markets are moving away
from the f loor-based trading system. Proponents of the automated system
argue that trading f loors are inefficient, are overrun with people and paper,
have less transparency, and should be replaced with technologically superior
electronic systems.3
The discussions above suggest that the choice of the trading mechanism
involves a trade-off between higher costs of operating a trading f loor and
potentially better execution due to the beneficial role of the specialist and
2
See, for example, Hasbrouck and Sofianos ~1993!, Madhavan and Smidt ~1993!, Madhavan
and Sofianos ~1998!, Kavajecz ~1999!, and Madhavan and Panchapagesan ~2000! for a discussion on the role of the NYSE specialist. The role of the f loor brokers is discussed in Sofianos
and Werner ~1997! and Handa, Schwartz, and Tiwari ~1998!. New York Stock Exchange ~2000!
reports that the trading volume participation of the specialist, f loor brokers, and limit order
book at the NYSE were 13 percent, 43 percent, and 44 percent, respectively, in 1999.
3
In the United States, electronic communication networks ~ECNs! such as Island, Instinet,
Archipelago, and others, are competing for order f low with the NYSE and Nasdaq. Primex
Trading, an electronic system backed by Goldman Sachs, Merrill Lynch, and Madoff Securities,
is pitching itself as an electronic replacement for the NYSE’s trading f loor ~see McNamee, Reed,
and Sparks ~1999!!. World stock markets with f loorless, electronic trading include Tokyo, Frankfurt, Paris, London, Toronto, among others.
Automated Versus Floor Trading
1447
f loor brokers. While the liquidity-provision role of the specialist and f loor
brokers is more readily apparent for less active stocks, the role of these
agents is less clear for stocks with large trading volume. Madhavan and
Sofianos ~1998! show that the median specialist participation rate at the
NYSE drops from 54.1 percent for illiquid stocks to about 15.4 percent for
highly liquid stocks. The off-exchange traders may prefer to route orders in
liquid stocks electronically via the SuperDot system at the NYSE, rather
than incur the higher commissions of the f loor broker. Hence, if the value of
human intermediation is lower for highly liquid stocks, then we may expect
an automated trading mechanism to have lower execution costs than the
NYSE f loor for a sample of liquid stocks. To investigate this, I compare
execution costs of large and liquid stocks across the two market structures.
Therefore, to some extent, I am intentionally biasing my results towards
finding lower execution costs in an automated trading system.
An intuitive research design for the above would be to compare the execution costs of cross-listed securities in the two trading mechanisms. However, Piwowar ~1997! finds that though execution costs are lower on the
home exchange of the stock ~i.e., U.S. stocks at the NYSE and French stocks
at the Paris Bourse!, a very high proportion of trades is also executed on the
home market.4 The larger trading volume in the home country provides significant liquidity benefits that may be unrelated to the relative efficiencies
of the trading mechanism. By analyzing execution measures of stocks with
similar characteristics in the two markets, this paper attempts to overcome
such a limitation and investigate the relative efficiency of the market structures in their normal trading environment.
The CAC40 Index stocks from the Paris Bourse are matched with NYSE
stocks using four algorithms: ~a! price and trading volume; ~b! price and
market size; ~c! industry, price, and trading volume; and ~d! industry, price,
and market size. The sample period extends from April 1997 to March 1998.
Three measures of trade execution costs are examined: quoted spreads, effective spreads ~which allow for the possibility of execution within the quotes!,
and realized spreads ~which measure trading costs after accounting for the
risk of adverse selection!. The results indicate that the quoted spreads in
Paris ~0.26 percent! are lower than spreads on similar NYSE stocks when
the tick size at the NYSE is an eighth ~0.31 percent!, but higher than NYSE
spreads after the reduction in tick size at the NYSE to the sixteenth ~0.24 percent!.5 Institutional features at the NYSE permit price improvement by execution within the quotes. The average NYSE percentage effective spreads
in the pre- and post-tick size reduction periods are 0.21 percent and 0.16 percent, respectively, while the Paris Bourse has significantly higher effective
4
This may be due to many reasons: more information production in the home country may
generate higher investor interest; traders may prefer to trade in the market in which other
investors trade; and traders may not prefer to trade at midnight or at irregular trading hours.
5
The NYSE changed the tick size from eighths to sixteenths on June 23, 1997. At the Paris
Bourse, there is greater variation of tick sizes across price levels.
1448
The Journal of Finance
spreads of 0.24 percent. The results are robust across all trade sizes and the
execution cost differential increases with trade size.
Execution costs continue to be higher in Paris relative to New York after
accounting for differences in adverse selection costs, relative tick sizes, and
economic variables across the samples.6 From an economic perspective, the
transactions cost in Paris is higher than in New York by 0.14 percent of the
amount traded. Stated differently, if the average Paris sample firm was traded
on the NYSE, the estimated savings in execution cost is $763,000 per month.
The lower execution costs in a f loor-based system suggest that there is a
benefit to human intermediation in the trading process. The NYSE specialist helps maintain narrow spreads, anticipates future order imbalances, and
helps reduce transitory volatility ~see Kavajecz ~1999!!. The trading f loor
also allows market participants to manage the risk of order exposure by
using the services of a f loor broker. These results are consistent with Handa
et al. ~1998!, who document significant reduction in trading costs due to
strategic behavior on the part of f loor brokers at the AMEX. However, two
caveats should be noted. First, although the study attempts to control for
the liquidity advantage of a dominant national market by analyzing a matched
sample of stocks rather than cross-listed securities, the differences in factors
such as insider trading laws, the degree of competition for order f low, and
the overall trading volume between the United States and France are very
difficult to control. Second, the liquidity providers at the Paris Bourse may
be subject to higher inventory and order-processing costs, for which the economic variables employed in this study are not adequate proxies.
This paper is organized as follows. In Section I, I discuss the differences
between automated and f loor mechanisms and their effects on execution
cost. In Section II, I describe the components of the bid-ask spread and the
measures of trading costs. Section III describes the data source, sample selection criteria, and descriptive statistics. Section IV presents the results of
the univariate analysis of trading costs. The results of the cross-sectional
regression analysis of transaction costs are presented in Section V. In Section VI, I discuss the economic significance of the differences in execution
costs. In Section VII, I summarize the results and discuss implications for
the designers of the automated trading systems.
I. Automated Versus Floor-based Trading Mechanisms
The issues involved in the design of trading systems are complex ~see
Harris ~1996, 1997!!. In most continuous auction markets, price-contingent
limit orders are arranged on the basis of priority rules in the limit order
book and help provide liquidity. A trade occurs when an aggressive trader
submits a market order and demands liquidity. To attract demanders of liquidity, designers of trading systems want liquidity providers to fully display their orders. However, displaying limit orders can be risky for two reasons.
6
Also, brokerage commissions for institutional trades are higher at the Paris Bourse, relative to the NYSE.
Automated Versus Floor Trading
1449
First, liquidity providers risk trading with better informed traders, that is,
being picked off. To lower this risk, liquidity providers would like the trading
system to allow them to trade selectively with counterparties of their choice.
Second, they risk being front-run by other traders and, thereby increase the
market impact of their orders. To lower this risk, large traders want to hide
their orders and expose them only to traders who are most likely to trade
with them. Harris ~1997, p. 1! says, “The art of trading lies in knowing when
and how to expose trading interests. Traders who never expose never trade.
Traders who over-expose generate high transactions cost.” If traders are forced
to display their orders fully, the trading system may not obtain the liquidity.
Hence, designers of trading systems ~including f loor-based and automated
systems! formulate trading rules to help liquidity providers better control
the risk of order exposure. Rules of trading are very important because they
constrain the ability of liquidity providers to control the risk of order exposure. A key implication is that liquidity providers may accept less compensation for their services in trading systems that provide better facilities to
control risk.
The rules of trading differ on many dimensions between a f loor-based and
an automated trading system. In this section, I discuss the important differences in trading rules and their potential effect on order submission strategies and trading cost. The institutional details of the NYSE and the Paris
Bourse are presented in Table I. At the Paris Bourse, liquidity providers can
specify that a portion of their limit order be “hidden.” Traders learn about
the “hidden” interest in the limit order book only after they are committed to
trading an amount larger than the displayed quantity. This reduces the risk
of being front-run by parasitic traders and the value of the free trading
option. However, all orders ~including the hidden portion of the order! are
firm commitments to trade and liquidity providers cannot reveal their orders selectively to counterparties of their choice. In addition, the identity of
the broker who initiated the trade is not revealed by the trading system ~for
the most liquid stocks!. These features characterize an important distinction
from the trading rules at the NYSE. A large trader at the NYSE can use the
services of a f loor broker to control the risk of order exposure. Handa et al.
~1998! mention that a f loor broker reveals the order only in response to the
arrival of a contra-side order that he or she wants to trade against.7 This
implies that the f loor broker has some ability to refuse to trade with wellinformed traders and to selectively trade with other brokers with whom she
is more comfortable. If traders are concerned about who wants to trade and
why they want to trade, then the ability to selectively disclose the order may
be an important dimension of the trading process.
Another significant distinction is the role of the specialist on the NYSE.
Previous studies ~see, e.g., Hasbrouck and Sofianos ~1993!, Madhavan and
Sofianos ~1998!, and Kavajecz ~1999!! show that the specialist’s quotes an7
In executing large orders, the f loor broker assesses the total liquidity available in the limit
order book and in the trading crowd, and trades strategically to minimize market impact ~see
Sofianos and Werner ~1997!!.
Description of the Institutional Framework at the NYSE and the Paris Bourse
Institutional Feature
New York Stock Exchange
1450
Table I
Paris Bourse
Order driven floor-based continuous market with
specialist. Orders can be routed electronically through
the SuperDOT to the central limit order book or can be
routed to the trading post using f loor brokers. Though
the SuperDOT ~f loor brokers! accounts for 95 percent
~5 percent! of the executed orders, it accounts for only
42 percent ~45 percent! of the share volume traded ~see
Bacidore, Ross, and Sofianos ~1999!!.
Order driven electronic continuous market with no
specialist ~for the large capitalization stocks!. All orders
are routed electronically via member firms to the central
limit order book through an advanced order processing
system called the NSC ~without any need for reentry by
the member firms!.
Liquidity provided by
Public limit orders and the specialist. The specialist has
obligations to maintain narrow spreads and provide
stability when previous price movements are significant.
As compensation, the specialist has monopolistic access
to order f low information ~see Madhavan and Sofianos
~1998!!.
Public limit orders only ~for large capitalization stocks!.
For medium and low capitalization stocks, preassigned
market makers provide additional liquidity by posting
quotes for a minimum amount. As compensation, they do
not pay trading fees and can be counterparty to all
trades.
Types of orders
Market orders and limit orders, with further conditions
for execution ~Fill-or-kill, Day, GTC, Stop-loss,
Market-on-close etc.!. Further, a large trader can use the
services of a f loor broker to execute customized trading
strategies ~see Sofianos and Werner ~1997!!.
Order types are similar to those at the NYSE. There are
no f loor brokers. However, the exchange allows traders
to specify partial display of their orders. The system
hides the remaining size and displays it only after the
displayed size executes ~see Harris ~1996!!.
Order precedence rules
Price, public order, and time.
Price, exposure, and time.
Pre-trade transparency
For off-f loor traders, information on the best bid-ask
prices in the limit order book and the number of shares
at these prices is available. Floor brokers can obtain
information on the general trading interest on the f loor
and the depth in the limit order book from the
specialist.
Information on the five best bid and offer prices and the
number of shares ~displayed quantity! demanded or
offered at each of these prices are continuously available
to public investors. A member firm can observe the
entire limit order book and the ID number of the broker
placing the limit order.
The auction process
Execution is not automated. An incoming order is
exposed to the specialist or traders in the crowd for
price improvement. Once exposed, the order is executed
against the improved price in the crowd or against the
posted quotes ~see, e.g., Hasbrouck, Sofianos, and
Sosebee ~1993!!.
An incoming market order is executed automatically
against the best limit orders in the book. Executions
within the inside quotes occurs rarely at the Paris
Bourse when a member firm facilitates the trade in its
capacity as a dealer or a broker ~see the discussion on
block trading below!.
The Journal of Finance
Trading mechanism
The informal upstairs market for block trades exists at
the Paris Bourse. Block trades in eligible stocks can be
crossed away from the best bid-offer quotes in the central limit order book at the time of the cross. The exchange rules require only that the block trade price
must be within the weighted average quotes ~which ref lect the depth in the limit order book! at the time of
the cross ~see Venkataraman ~2000!!.
Post-trade transparency
All trades ~including facilitated trades! are reported
immediately to the NYSE. The NYSE publishes all
trades with no delay.
All trades are reported immediately to the Paris Bourse.
All nonblock trades and block trades in which a member
firm acts as a broker are published immediately. Block
trades in which a member firm acts as a dealer may be
reported with delay.
Market opening
Public limit orders and market-on-open orders are submitted in the preopen to the NYSE’s OARS system. At
the open, the specialist sets a single opening price at
which the order imbalances are absorbed ~See Madhavan and Panchapagesan ~2000!!.
Orders accumulate in the central limit order book in the
preopen. The system continuously provides information
on the Indicative Equilibrium Price, that is, the price at
which the trades would be conducted if the opening occurred at that precise instant. At the open, the system
calculates the opening price at which the maximum
number of bids and asks can be matched ~see Biais, Hillion, and Spatt ~1999!!.
Tick size
Tick size for all shares quoted above $1 was reduced
from an eighth ~$0.125! to a sixteenth ~$0.0625! on June
23, 1997.
For shares quoted below FF5 the tick size is FF0.01; for
shares quoted at and above FF5 and below FF100, the
tick size is FF0.05; for shares quoted at and above
FF100 and below FF500, the tick size is FF0.10; and for
shares quoted at or above FF500, the tick size is FF1.0.
Trading halts and circuit breakers
Effective October 19 1988, a decline of 350 ~550! points
in the DJIA would result in a market-wide trading halt
for 30 minutes ~one hour!. Effective April 15 1998, a
decline of 10 percent ~20 percent! of the DJIA would halt
trading by one ~two! hours ~see NYSE ~2000! for details!.
A trading halt of 15 minutes occurs for liquid stocks
when the price deviates by more than 10 percent from
the closing price of the previous day. The two subsequent deviations cannot be larger than five percent.
There is no market wide trading halt.
Competition for order f low
From regional exchanges and third markets ~ECNs!.
From continental bourses and the London Stock
Exchange.
Consolidation of order f low
The exchange consolidates more than 80 percent of the
turnover value of the NYSE listed stocks ~see Blume
and Goldstein ~1997!!.
The exchange consolidates more than 90 percent of the
turnover value of the Paris Bourse stocks ~see Demarchi
and Foucault ~1999!!.
Ownership structure
Mutual association—member firms are owners.
Privately owned ~i.e., not by member firms!.
1451
There exists an informal upstairs market where block
trades are facilitated by search and negotiation. An upstairs trade needs to be “crossed” on the trading f loor
using a f loor broker with an obligation to execute orders
posted at better prices in the limit order book or held by
other f loor brokers at the time of the cross ~see Madhavan and Cheng ~1997!!.
Automated Versus Floor Trading
Block trading facility or Upstairs market
1452
The Journal of Finance
ticipate future order imbalances and help reduce transitory volatility. Madhavan and Panchapagesan ~2000! show that the specialist’s opening price is
more efficient than the price that would prevail in an automated auction
market using only public orders. These results suggest that the NYSE specialist may play a beneficial role in price formation. However, for actively
traded stocks, the role of a specialist is less clear due to low participation
rates.
From an industrial organization perspective, the electronic trading mechanism offers many advantages over the f loor ~see Domowitz and Steil ~1999!!.
First, the benefit of any trading system increases with the number of locations from which the system can be accessed. While the Paris Bourse can
easily offer remote cross-border membership and direct electronic access for
institutional investors, the inherent limitations of trading f loor space require access limitations at the NYSE. Second, the heavy trading volume and
the growing number of new listings raise concern about the capacity limits
of a trading f loor. A related concern is whether the NYSE specialists have
sufficient capital to fulfill their affirmative obligations.8 Third, the development and maintenance cost of an automated market is considerably lower
than that of a trading f loor, thus providing significant cost reductions. Fourth,
f loor-based exchanges ~including the NYSE! are typically organized as mutual associations, while automated exchanges ~including the Paris Bourse!
have typically separated the ownership of the exchange from membership.
The mutual structure raises the possibility that members may resist innovations that reduce demand for their intermediation services, but may provide better execution to traders. For these reasons, a f loor-based mechanism
may have higher execution costs than an automated trading mechanism.
The cumulative effect of the differences in trading rules will be ref lected
in order submission strategies, price formations, and transactions cost. Some
studies ~see, e.g., Amihud and Mendelson ~1986!! have suggested that investors demand a liquidity premium for holding stocks with higher transactions
costs. Considering the current trend toward automation of auction markets,
the relative efficiency of an automated versus a f loor-based mechanism is an
important issue to be addressed.
II. Components of Bid-ask Spread and Measures of Trading Costs
A. Components of Bid-ask Spread
Demsetz ~1968! defines the bid-ask spread as the mark-up that is paid for
predictable immediacy of exchange in organized markets. Traditional theories in market microstructure ~e.g., Stoll ~1978!! identify three main components of bid-ask spreads: order processing costs, inventory control costs, and
adverse selection costs. The order processing cost refers to the labor, com8
While the average daily trading volume at the NYSE has increased from 189 million shares
in 1987 to 527 million shares in 1997, the total capital of specialist firms only increased from
$1 billion to $1.3 billion during the same time period ~see Willoughby ~1998a!!.
Automated Versus Floor Trading
1453
munication, clearing, and record-keeping costs of a trade. This cost is a fixed
dollar amount per transaction; hence spreads per share should decrease in
dollar value of trade size ~see Glosten and Harris ~1988!!. The discussion in
Section I suggests that the order processing cost is expected to be lower
in an electronic market, relative to a f loor-based structure. Theories of inventory control costs ~see, e.g., Stoll ~1978!! assume that the market maker
has an optimal or a preferred inventory level. Any trade that moves the
inventory level away from the optimal increases the market maker’s risk
and she must be compensated for this risk. This suggests that the inventory
risk component of the spread is directly proportional to trade size, market
price, and price volatility, and is inversely proportional to trading frequency.
The adverse selection component of the spread arises due to the presence of
informed traders ~see, e.g., Glosten and Milgrom ~1985! and Kyle ~1985!!.
Since a market maker incurs a loss on transactions with these traders, she
will charge a fee on every transaction to compensate for this loss. In a competitive equilibrium, the gain on trades with uninformed investors just offsets the loss on trades with the informed investor.
B. Measures of Trading Costs
Since the quotes and transactions are denominated in U.S. dollars ~$! in
New York and in French francs ~FF! in Paris, I calculate percentage spread
measures to compare execution costs across markets. As public limit orders
primarily establish the spread in both markets, this comparison is not subject to the limitations of Demsetz ~1997!. The simplest measure of trading
cost is the quoted spread, which measures the cost of executing a simultaneous buy and sell order at the quotes ~i.e., the cost of a round-trip trade!. I
calculate the percentage quoted spreads defined as
Percentage quoted spread ϭ 100 * ~Ask it Ϫ Bidit !0Midit ,
~1!
where Ask it is the ask price for security i at time t, Bidit is the bid price for
security i at time t, and Midit is the midpoint of the quoted ask and bid
prices. The institutional features in many exchanges allow for price improvement by executions within the quotes. Also, the cost of executing a roundtrip trade will differ across trade sizes, as the quoted spread is meaningful
as a measure only up to the quoted depth.9 To capture the institutional features of exchanges, I calculate the percentage effective spreads as in Lee
~1993!, DeJong, Nijman, and Roell ~1995!, and Bessembinder and Kaufman
~1997a!:
Percentage effective spread ϭ 200 * Dit * ~Price it Ϫ Midit !0Midit ,
for a given trade size,
~2!
9
As discussed in Lee, Mucklow, and Ready ~1993!, a study of liquidity must consider the
depth dimension of the market. Hence an analysis of quoted spreads alone would be insufficient
to summarize the liquidity of a market.
1454
The Journal of Finance
where Price it is the transaction price for security i at time t, and Midit ~defined above! is a proxy of the “true” underlying value of the asset before the
trade, and Dit is a binary variable that equals 1 for market buy orders and
Ϫ1 for market sell orders, using the algorithm suggested in Lee and Ready
~1991!.
Since informed investors would continue to trade on the same side of the
market, their presence is revealed by the order f low. The market incorporates the informational content of a trade by adjusting the quotes after a
trade. This effect is captured by the price impact of the trade that is measured as follows:
Percentage price impact ϭ 200 * Dit * ~Vi, tϩn Ϫ Midit !0Midit ,
for a given trade size,
~3!
where Vi, tϩn is a measure of the “true” economic value of the asset after the
trade and is proxied by the midpoint of the first quote reported at least 30
minutes after the trade.10 Finally, I calculate the realized spread, which measures the cost of executing trades after accounting for the risk of adverse
selection, as follows:
Percentage realized spread ϭ 200 * Dit * ~Price it Ϫ Vi, tϩn !0Midit ,
for a given trade size.
~4!
As discussed in Bessembinder and Kaufman ~1997a!, the above measures
of transactions cost for individual trades would have measurement errors
due to errors in classifying trades as market buy or sell orders, due to the
arrival of additional information between time t and t ϩ n ~which would
effect Vi, tϩn ! and due to the use of quote midpoints as a proxy for unobservable post-trade economic value.11 In addition, errors would also be introduced due to using quote-midpoints as a proxy for pre-trade economic value.
However, the average spread measures, calculated over a large number of
trades, provide an unbiased estimate of the average execution costs.
III. Data Source, Sample Selection, and Descriptive Statistics
A. Data Source
The source of data for the NYSE stocks is the Trade and Quote ~TAQ! database, made available by the NYSE. Trade and quote data on the Paris stocks
are obtained from the Paris Bourse’s Base de Donnees de Marche ~BDM! data10
The first transaction price reported at least 30 minutes after the trade and the midpoint
of the first quotes reported after 12 noon on the next trading day are also used as proxies. As
the results are very similar, they are not reported in the paper.
11
To control for the arrival of additional information between t and t ϩ n, I weigh each
transaction by the inverse of the number of transactions between t and t ϩ n.
Automated Versus Floor Trading
1455
base. Data on the industry classification of the sample firms and the U.S. dollar ~$!0French franc ~FF! exchange rate are obtained from Datastream.
B. Sample Selection Methodology
Theoretical models of the bid-ask spread suggest that trading costs differ
systematically by firm-specific characteristics such as market size, stock
price, trading volume, and volatility. Past empirical research on crossexchange comparisons has controlled for the above by matching on some
of these characteristics. This study matches the component stocks of the
CAC40 Index at the Paris Bourse with the NYSE stocks using four algorithms: ~a! price and market size; ~b! price and trading volume; ~c! industry,
price, and market size; and ~d! industry, price, and trading volume. For each
CAC40 Index stock, the NYSE stock is matched by sampling without replacement. The sample selection methodology is similar to Huang and Stoll
~1996! and is described in detail in the Appendix.
The sample period covers one year from April 1997 to March 1998. Only
trades and quotes that occurred on the two exchanges during the normal
trading hours are analyzed.12 I use filters to delete trades and quotes that
have a high likelihood of ref lecting errors or were nonstandard.13 Lee and
Ready ~1991! show that trade reports lag quotes in the NYSE, and I correct
for the same by comparing the trade to the quote in effect five seconds earlier. In contrast, the data from the Paris Bourse are relatively error free as
they are produced by the automated trading system. In the Paris Bourse, a
large marketable limit order to buy ~sell! can exhaust the depth on the inside quote and walk up ~down! the limit order book. Such a large order is
reported as multiple trades occurring at the same time in the BDM database. I classify these simultaneous trades as one large trade. In addition,
block trades in Paris that involve a member firm as the counterparty are
reported to the market after a two-hour delay.14 Hence, I use quotes that
were effective two hours and thirty minutes after the transaction time as a
proxy for the post-trade value of the security.
12
The NYSE faces competition for order f low from the regional exchanges and third markets, and consolidates about 80 percent of the overall volume ~see Blume and Goldstein ~1997!!.
Similarly, the Paris Bourse faces competition for order f low from the London Stock Exchange
and other continental bourses, and consolidates more than 90 percent of the turnover value ~see
Demarchi and Foucault ~1999!!. This study does not consider trades and quotes away from the
NYSE and the Paris Bourse.
13
Trades were omitted if they are indicated to be out of time sequence, or coded involving an
error or cancellation. Trades were also omitted if they involved a nonstandard settlement or
were indicated to be exchange acquisitions or distributions. Trades were also omitted if trade
price is negative or involved a price change ~since the prior trade! greater than an absolute
value of 10 percent. Quotes are deleted if bid or ask is nonpositive; bid-ask spread is negative;
the change in the bid or ask price is greater than absolute value of 10 percent; bid or ask depth
is nonpositive; or nonfirm quotes or quotes were disseminated during trading halt or a delayed
opening.
14
A trade in a stock is classified as a block trade if the trade size exceeds the normal market
size ~NMS! for that stock. The NMS is calculated quarterly for each stock on the basis of its
daily trading volume and depth in the limit order book ~see SBF Bourse de Paris ~1995!!.
1456
The Journal of Finance
C. Descriptive Statistics
Table II presents the stock characteristics of the Paris and New York sample matched on industry, price, and size. The sample firms on both exchanges represent a broad cross-section of industries. While the distribution
of market size is very similar across the two samples, the distribution of
market price in the Paris sample is higher than in the New York sample.15
Though a joint match on three stock characteristics ~i.e., including industry!
results in larger deviations among the matched samples than a match on
two characteristics, I find that the differences in execution cost measures
between the two exchanges are similar across the four matching algorithms.
To save space, I report the analysis of execution costs using two algorithms:
~1! price and trading volume, and ~2! industry, price, and market size, in all
the tables and discuss the results of the match on industry, price, and market size in detail in this paper.16
Table III reports additional descriptive statistics on the trading patterns
of the matched sample. The statistics for each exchange are pooled timeseries cross-sectional averages across the sample firms for the 12-month
sample period. Daily and hourly return volatility, computed using quote midpoints, indicates relatively similar patterns for the Paris and New York samples.17 The Paris sample has a higher number of quote updates per day
~1,055! than the New York sample ~427!. Biais, Hillion and Spatt ~1995!
show that a large fraction of order placements at the Bourse improves the
best bid or ask quotes ~ref lecting competition in the supply of liquidity!,
which would result in more frequent quote updates. Also, as suggested in
Harris ~1996!, frequent quote updates are also consistent with higher frequencies of order cancellations by liquidity providers to discourage frontrunning strategies.
An average stock in the NYSE sample had 4,435 trades per month, which
translates into an average monthly dollar trading volume of $508 million.
During the same period, an average stock in the Paris Bourse sample had
11,851 trades per month and an average monthly dollar trading volume of
$650 million. Average trade sizes are $103,675 in New York and $50,850 in
Paris. Further, the trades are broken down into categories based on the
trade size. I define a trade to be: ~1! very small if trade size , $20,000;
~2! small if $20,000 Յ trade size , $50,000; ~3! medium0small if $50,000 Յ
trade size , $100,000; ~4! medium0large if $100,000 Յ trade size , $300,000;
~5! large if $300,000 Յ trade size , $500,000; ~6! very large if trade size Ն
$500,000. In each trade-size category, the average trade size ~in dollars! com15
On April 1, 1997, the average stock price in Paris ~$142! is substantially larger than the
NYSE ~$41!. This result is consistent with Angel ~1997!, who shows that the average stock price
in the French market is significantly higher than in the U.S. and world markets.
16
The results of the match on price and market size, and industry, price, and trading volume
are available from the author on request.
17
Return volatilities computed using transactions prices would be biased upwards due to
bid-ask bounce. While this bias would affect volatilities in both exchanges, the exchange with
the higher spreads would have a higher bias.
Automated Versus Floor Trading
1457
pares favorably across the two samples. As documented in Biais, Hillion and
Spatt ~1995!, I find that a high proportion ~62 percent! of the Paris trades
are small trades ~relative to New York ~32 percent!!. This could ref lect the
presence of a higher proportion of smaller investors at the Bourse or the
strategic behavior of traders to split their larger orders into smaller orders
to minimize market impact. This may also be due to the siphoning of small
orders away from the NYSE by third market broker-dealers and the regional
exchanges.
D. Research Design
During the sample period, the New York sample had 2.9 million quotes
and 1.5 million trades, while the Paris sample had 7.1 million quotes and 3.8
million trades. My research design and interpretations are similar to Bessembinder and Kaufman ~1997a!, and use a two-stage approach to overcome
data processing constraints. In the first stage, I calculate the average measures of execution costs for each stock on a calendar month basis. The second
stage OLS regression specification follows: 18
Yit ϭ aParis DParis ϩ aPre-NYSE DPre-NYSE ϩ aPost-NYSE DPost-NYSE ϩ eit ,
~5!
where Yit denotes the average execution cost measure for stock i for month
t; DParis equals one for all Paris stocks and zero for all NYSE stocks;
Dpre-NYSE equals one for all NYSE stocks in the sample period before the
reduction in tick size and zero otherwise; and Dpost-NYSE equals one for all
NYSE stocks in the sample period after the reduction in tick size and zero
otherwise.
The dummy coefficient measures the average execution costs at each exchange. Since regression ~5! is performed on a pooled time-series crosssectional data set, error terms would not satisfy the classical conditions of
heteroskedasticity and autocorrelation. Hence I adopt a bootstrapping procedure to assess the statistical significance of the regression coefficients. A
bootstrap NYSE sample, with the same sample size as in regression ~5!, is
drawn by random sampling with replacement from the original sample of
NYSE stocks. A bootstrap sample for the Paris stocks is constructed by choosing the matched Paris stock.19 Regression ~5! is estimated for the bootstrapping sample and the dummy coefficients are saved. This process is repeated
500 times to obtain 500 bootstrapping coefficients. Since the bootstrap sample is drawn from the original sample ~as against the error terms!, the distribution of the bootstrap coefficient is centered on the sample mean. The
bootstrap p-value for the null hypothesis of zero realized spreads at each
18
The analysis using weighted least squares, where the weight is the trading frequency,
produces similar results. I also estimated regression ~5! using pre- and postdummies for the
Paris sample and find similar results.
19
As a robustness check, the bootstrap Paris sample is also constructed by random sampling
with replacement from the original sample of Paris firms. The bootstrap p-values are very
similar and are not reported separately.
1458
The Paris sample consists of the component firms of the CAC40 Index with trading data for the entire sample period ~April 1997 to March 1998!.
The New York sample consists of all NYSE-listed stocks in the TAQ database in April 1997 and with trading data for the entire sample period.
For the Paris sample, the stock price and market size on April 1, 1997, is obtained from the BDM database, and converted to U.S. dollars using
the spot exchange rates ~obtained from DataStream!. Similarly, for the New York sample, the stock price and market size on April 1, 1997, is
obtained from the TAQ database. DataStream provides the global industry classification. The Paris sample firms are matched with the New York
sample firms with the same DataStream industry classification code. Next, for each Paris firm, the New York firm with the smallest average
characteristic deviation statistic ~defined below! is identified as the match.
Average Deviation ϭ
ͫ
Price Paris Ϫ Price NYSE
~Price Paris ϩ Price NYSE !02
ͬ ͫ
ϩ
Size Paris Ϫ Size NYSE
~Size Paris ϩ Size NYSE !02
Stock Price ~in Dollars!
Industry Classification
Insurance
Electrical and Telecom
Insurance
Banks
Building and Construction
Media and Broadcasting
Banks
Paris Bourse Firm
AGF
Alcatel Alsthom
AXA
BNP
Bouygues
Canal ϩ
CCF
Matched NYSE Firm
Excel Limited
Ameritech Corp.
Allstate Corp, The
Suntrust Banks Inc.
Vulcan Materials Company
Washington Post Company
Marcantile Bancorp, Inc.
ͬͲ
2
Market Size ~in Dollars!
CAC40
NYSE
CAC40
NYSE
Average
Deviation
35.3
118.1
65.1
43.0
97.6
187.0
46.9
42.4
60.3
60.3
46.4
64.5
345.7
53.4
4,800,044,691
19,109,780,058
19,796,380,280
8,920,529,328
2,351,316,206
5,745,737,115
3,354,988,678
4,700,593,625
35,482,092,675
27,142,205,056
10,712,899,322
3,004,834,441
6,274,052,318
3,381,234,087
0.10
0.62
0.19
0.13
0.33
0.34
0.07
The Journal of Finance
Table II
Statistics of the NYSE and the Paris Bourse Sample Matched on Industry,
Market Price, and Market Size
CLF Dexia France
Elf Aquitaine
Groupe Danone
Havas
Lafarge
Lagardere
Lyonnaise Des Eaux
Michelin
Paribas
Pernod-Ricard
Renault
Rhone-Poulenc
Sanofi
Schneider
Societe Generale
Thomson-CSF
Total
Valeo
MBIA, Inc.
Texaco, Inc.
Ralston-Ralston Purina Group
Interpublic Group Cos, Inc.
Fluor Corp.
Digital Equipment Corp.
Textron Inc.
Goodyear Tire Rubber Co.
Household Intl Corp.
Brown-Forman Corp.
Tenneco, Inc.
Pharmacia Upjohn Inc.
Rohm and Hass Company
AMP, Inc.
BankBoston Corp.
Sunstrand Corp.
Atlantic Richfield Company
Johnson Controls, Inc.
102.4
98.2
153.9
71.7
67.4
31.3
99.7
58.4
68.1
54.2
24.5
32.5
94.1
54.8
112.8
32.8
84.1
65.8
95.3
108.8
77.6
53.1
52.6
26.6
103.0
51.9
85.0
47.8
39.0
36.0
73.8
34.2
67.6
44.0
133.7
40.0
3,758,697,855
26,789,017,894
11,175,845,078
4,600,640,677
6,358,739,445
3,035,377,900
5,911,165,783
6,967,003,087
8,459,169,001
3,056,400,183
5,864,676,132
10,691,354,923
9,877,602,838
7,498,089,815
10,331,994,367
3,923,764,373
20,286,188,315
4,596,893,358
4,127,132,544
29,840,477,847
8,898,314,240
4,828,961,200
4,371,912,862
4,185,371,819
9,730,878,776
10,152,714,541
9,794,557,767
1,913,876,675
6,715,855,769
18,321,884,815
5,798,014,021
7,951,003,551
10,353,275,319
3,320,189,813
21,536,983,727
3,514,147,342
0.08
0.11
0.44
0.17
0.31
0.24
0.26
0.24
0.18
0.29
0.30
0.31
0.38
0.26
0.25
0.23
0.26
0.38
10th Percentile
25th Percentile
Median
75th Percentile
90th Percentile
Average
32.7
46.9
67.4
98.2
116.0
76.0
37.2
44.0
53.4
77.6
106.5
73.7
3,175,835,581
4,596,893,538
6,358,739,445
10,331,994,367
19,521,740,191
8,690,455,902
3,344,607,523
4,185,371,819
6,715,855,769
10,353,275,319
24,900,116,524
10,242,138,566
0.10
0.18
0.26
0.31
0.38
0.26
Automated Versus Floor Trading
Finance
Oil
Food Processing
Media and Broadcasting
Building and Construction
Electronic Equipment
Diversified
Tires and Rubber
Finance
Textiles and Distillers
Autos and Parts
Pharma and Chemicals
Pharma and Chemicals
Electrical and Telecom
Banks
Defense and Aerospace
Oil
Autos and Parts
1459
1460
The Journal of Finance
Table III
Detailed Descriptive Statistics of the NYSE
and the Paris Bourse Sample
Statistics include market size, market price, daily and hourly return volatility, relative tick
size, quote update frequency, trading frequency, and trading volume for the NYSE and the
Paris Bourse samples. The data source is the BDM database for the Paris Bourse sample and
the TAQ database for the NYSE sample. Return volatility is computed using quote midpoints.
All statistics are pooled time-series cross-sectional averages across sample firms from April
1997 to March 1998. The French francs values are converted to U.S. dollars using the daily spot
exchange rates. Trades are broken into sizes as follows: ~1! Very small if trade size , $20,000;
~2! small if $20,000 Յ trade size , $50,000; ~3! medium0small if $50,000 Յ trade size , $100,000;
~4! medium0large if $100,000 Յ trade size , $300,000; ~5! large if $300,000 Յ trade size ,
$500,000; ~6! very large if trade size Ն $500,000.
Matching Algorithm
Market Price and
Trading Volume
NYSE
Market price ~in $!
Market size ~in $ millions!
Return volatility for a month
daily return
hourly return
Relative tick size
Average number of quotes0day
Paris
Bourse
Industry, Market Price,
and Market Size
NYSE
Paris
Bourse
79.3
10,022
81.2
7,797
73.7
10,242
76.0
8,690
0.020
0.006
0.13%
417
0.021
0.007
0.08%
1,002
0.018
0.005
0.13%
427
0.021
0.006
0.08%
1,055
Average number of trades0month
Very small trades
Small trades
Medium0small trades
Medium0large trades
Large trades
Very large trades
1,419
1,190
879
851
180
197
Overall
4,701
6,829
1,808
1,173
972
154
128
11,064
1,413
1,148
840
749
167
176
4,435
7,230
1,823
1,301
1,152
184
161
11,851
11,174
33,192
71,049
165,814
380,633
1,124,995
5,392
32,411
69,800
161,288
377,108
1,409,486
10,679
33,611
71,443
166,521
382,027
1,336,835
5,267
32,672
69,702
161,678
376,410
1,400,315
Average trade size ~in $!
Very small trades
Small trades
Medium0small trades
Medium0large trades
Large trades
Very large trades
Overall
106,149
46,798
103,675
50,850
Monthly trading volume ~in $!
Very small trades
Small trades
Medium0small trades
Medium0large trades
Large trades
Very large trades
15,214,612
39,359,028
62,273,520
140,355,066
68,348,144
226,166,596
32,490,351
59,199,567
82,276,971
158,779,750
58,438,540
169,590,709
14,900,935
38,473,405
59,849,240
125,655,424
63,886,173
207,489,560
33,940,235
59,993,805
91,072,947
187,774,545
69,708,941
208,456,472
Overall
551,564,819
560,775,888
508,275,437
650,946,943
Automated Versus Floor Trading
1461
exchange is the proportion of bootstrap coefficient estimates that are less
than or equal to zero. The bootstrap p-value for the null hypothesis of equal
execution costs across exchanges is the proportion of bootstrap observations
in which the difference between the bootstrap coefficient estimates has the
opposite sign as the difference between the sample coefficient estimates.
To minimize the effect of outliers in the sample, I calculate the percentage
of the Paris sample’s execution costs that is higher than the matched NYSE
sample’s execution costs. I also calculate the Wilcoxon p-value, which pertains to a Wilcoxon signed rank test of the hypothesis that median spreads
are equal across exchanges. The results are robust to the effect of outliers
and hence, not reported in the tables. The results of average execution costs
in the exchanges are presented in the next section.
IV. Transaction Cost Measures at the NYSE and the Paris Bourse
A. Quoted Spread
Table IV presents the results of average time-weighted percentage quoted
spreads on the NYSE and the Paris Bourse. For Paris, the average percentage quoted spreads ~0.26 percent! are significantly lower than NYSE spreads
before the reduction in tick size in the NYSE in June 1997 ~0.31 percent!,
but higher after the reduction in tick size ~0.24 percent!. The average percentage quoted spreads in the NYSE declined after the reduction in tick
size, which is consistent with results in Jones and Lipson ~2001! and Goldstein and Kavajecz ~2000!. Since trades can occur within the quotes at the
NYSE and quoted spreads only measure execution costs for small trades, I
look at a more accurate measure of a trader’s execution cost: The effective
spread.
B. Effective Spread
Results from Table IV show that effective spreads are higher on the Paris
Bourse than on the NYSE, and the difference is more pronounced after the
NYSE reduced its tick size. The difference is about nine basis points for very
small trades, six basis points for medium0small trades, and 15 basis points
for very large trades, with all differences highly significant. In both exchanges, the average percentage effective spreads increase with trade size,
which is consistent with large trades walking up0down the limit order book
after using up depth on the inside quotes. Since the auction process in the
NYSE allows for executions within the quotes, the average percentage effective spreads in New York are lower than the quoted spreads. I also find a
statistically significant reduction in percentage effective spreads across all
trade sizes at the NYSE due to the reduction in tick size.
This section provides evidence to support the hypothesis that the cost of
executing trades across similar firms is considerably lower in New York compared to Paris. But higher trading costs at the Paris Bourse could just re-
1462
Table IV
Transaction Cost Measures at the NYSE and the Paris Bourse
Matching Algorithm Is Market Price and Trading Volume
NYSE: Tick ϭ Eighth
Paris
a
Quoted spread
26.97
Effective spread
Very small
Small
Medium0small
Medium0large
Large
Very large
Overall
24.45 a
23.18 a
24.72 a
28.39 a
33.16 a
38.34 a
24.59 a
NYSE: Tick ϭ Sixteenth
Difference
32.39
a
19.37 a
20.74 a
22.30 a
23.36 a
23.78 a
25.16 a
21.22 a
Ϫ5.42
Matching Algorithm Is Industry, Market Price, and Market Size
a
5.08 a
2.44 b
2.42 b
5.04 a
9.38 a
13.18 a
3.36 a
Difference
24.32
a
13.79 a
15.46 a
16.85 a
18.32 a
19.47 a
20.66 a
15.79 a
2.65
a
10.66 a
7.72 a
7.87 a
10.08 a
13.69 a
17.68 a
8.80 a
NYSE: Tick ϭ Eighth
Paris
25.60
a
23.29 a
22.09 a
23.41 a
26.77 a
31.30 a
36.53 a
23.50 a
NYSE: Tick ϭ Sixteenth
Difference
31.11
a
19.78 a
20.80 a
22.12 a
23.18 a
23.63 a
24.90 a
21.06 a
Ϫ5.52
a
3.51 a
1.29 c
1.28 c
3.58 a
7.66 a
11.63 a
2.45 a
Difference
a
1.59 a
14.20 a
15.86 a
17.01 a
18.45 a
20.34 a
21.34 a
16.05 a
9.09 a
6.22 a
6.39 a
8.32 a
10.96 a
15.19 a
7.46 a
24.01
The Journal of Finance
Percentage quoted spreads is time-weighted percentage quoted spreads for each firm. Percentage effective spreads is computed as @200 * dummy *
~price-mid!0mid#, where the dummy equals one for a market buy and negative one for a market sell, price is the transaction price, and mid is the
midpoint of the bid-ask quote at the time of the trade. Percentage price impact is computed as @200 * dummy * ~Qmid30-mid!0mid#, where Qmid30
is the midpoint of the first quote observed after 30 minutes. Percentage realized spreads is computed as @200 * dummy * ~Price-Qmid30!0mid#.
Effective spreads are equally weighted across trades for each firm while price impact and realized spreads are weighted by the inverse of the
number of transactions during the 30 minutes after the trade. All spread measures are pooled time-series cross-sectional averages across sample
firms from April 1997 to March 1998. Trades are broken into sizes as follows: ~1! Very small if trade size , $20,000; ~2! small if $20,000 Յ trade
size , $50,000; ~3! medium0small if $50,000 Յ trade size , $100,000; ~4! medium0large if $100,000 Յ trade size , $300,000; ~5! large if
$300,000 Յ trade size , $500,000; and ~6! very large if trade size Ն $500,000. Confidence intervals and p-values are obtained using bootstrapping
samples with 500 iterations. All spread measures in percentage basis points.
5.85 a
13.17 a
17.83 a
21.18 a
19.78 a
11.15 a
9.50 a
10.33 a
15.98 a
19.43 a
21.63 a
25.00 a
23.36 a
15.83 a
Ϫ4.49 a
Ϫ2.81 a
Ϫ1.60 b
Ϫ0.45
Ϫ5.21 c
Ϫ12.21 a
Ϫ6.33 a
9.19 a
14.59 a
17.49 a
18.32 a
17.59 a
16.41 a
14.07 a
Ϫ3.34 a
Ϫ1.43 a
0.34
2.86 a
2.20 a
Ϫ5.26 a
Ϫ4.57 a
5.19 a
12.63 a
16.68 a
19.98 a
19.17 a
12.20 a
8.96 a
10.36 a
16.08 a
18.73 a
20.47 a
21.67 a
22.35 a
15.43 a
Ϫ5.17 a
Ϫ3.45 a
Ϫ2.05 a
Ϫ0.49
Ϫ2.50 c
Ϫ10.14 a
Ϫ6.47 a
8.99 a
14.74 a
16.84 a
17.63 a
17.78 a
18.12 a
13.76 a
Ϫ3.80 a
Ϫ2.10 a
Ϫ0.17
2.35 a
1.39
Ϫ5.92 a
Ϫ4.80 a
Realized spread
Very small
Small
Medium0small
Medium0large
Large
Very large
Overall
19.53 a
10.65 a
7.44 a
7.50 a
12.35 a
25.03 a
15.82 a
8.99 a
4.62 a
2.72 b
1.52 b
Ϫ1.56 c
1.00
5.20 a
10.54 a
6.03 a
4.73 a
5.97 a
13.91 a
24.03 a
10.61 a
4.52 a
0.73 b
Ϫ0.79 b
Ϫ0.41
1.30 b
3.20 a
1.47 a
15.02 a
9.93 a
8.23 a
7.91 a
11.06 a
21.83 a
14.34 a
18.92 a
10.02 a
7.24 a
7.10 a
11.27 a
22.71 a
15.20 a
9.35 a
4.64 a
3.28 a
2.66 a
1.49 b
1.50
5.48 a
9.57 a
5.38 a
3.96 a
4.44 b
9.79 a
21.21 a
9.73 a
5.20 a
1.06 a
0.08
0.67 a
2.29 a
2.58 a
2.16 a
13.72 a
8.96 a
7.16 a
6.43 a
8.98 a
20.13 a
13.05 a
a
b
c
p-value , 0.01.
0.01 Յ p-value , 0.05.
0.05 Յ p-value , 0.10.
Automated Versus Floor Trading
Price impact
Very small
Small
Medium0small
Medium0large
Large
Very large
Overall
1463
1464
The Journal of Finance
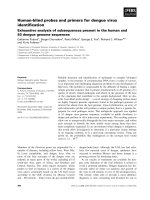
Figure 1. Comparison of effective and realized spreads on the NYSE and the Paris Bourse. Percentage effective spreads is computed
as @200 * dummy * ~price-mid!0mid#, where the dummy equals one for a market buy and negative one for a market sell, price is the transaction
price, and mid is the midpoint of the bid-ask quote at the time of the trade. Percentage realized spreads is computed as @200 * dummy *
~price-Qmid30!0mid#, where Qmid30 is the midpoint of the first quote observed after 30 minutes. Effective spreads are equally weighted across
trades for each firm while realized spreads are weighted by the inverse of the number of transactions during the 30 minutes after the trade. The
firms are matched on industry, price, and market size. All spread measures are pooled time-series cross-sectional averages across sample firms
from April 1997 to March 1998. NYSE PRE-TICK and NYSE-POST-TICK spreads represent the spreads at the NYSE before and after the
reduction in tick size in June 1997. Trades are broken into sizes as follows: ~1! Very small if trade size , $20,000; ~2! small if $20,000 Յ trade
size , $50,000; ~3! medium0small if $50,000 Յ trade size , $100,000; ~4! medium0large if $100,000 Յ trade size , $300,000; ~5! large if
$300,000 Յ trade size , $500,000; ~6! very large if trade size Ն $500,000. All spread measures are in percentage basis points.
Automated Versus Floor Trading
1465
f lect compensation for higher private information in trades. This explanation is investigated in the next section.
C. Do Trades Contain More Private Information in Paris?
Table IV presents results on the average informational content ~price impact! of trades at the two exchanges. The price impact measures the average
permanent effect of a trade on the true economic value of a security. The
average price impact of Paris trades is either comparable or lower than that
of New York trades in a majority of the trade-size categories. These results
suggest that the adverse selection component of the spread cannot explain
the higher execution costs for Paris. In both exchanges, price impact increases with trade size, which is consistent with the predictions of Easley
and O’Hara ~1987!.
D. Realized Spreads
The results in Table IV show that average realized spreads in Paris are
significantly higher than in New York, and this holds across the sample
period. The average difference between Paris and New York before the change
in tick size is 10 basis points, and increases to 13 basis points subsequently.
Also, the transactions cost after controlling for adverse selection is significantly higher in Paris for very small trades ~14 basis points! and very large
trades ~20 basis points!. Figure 1 provides a graphical relationship between
spread measures and trade sizes in the two exchanges. The graph clearly
shows that spread measures in Paris are higher than in New York for all
trade sizes, and are substantially higher than in New York for very small
and very large trades.
This section provides evidence that higher transactions costs in Paris are
not driven by the higher risk of adverse selection. A structural feature that
may account for the difference in execution costs between Paris and New
York is the tick size. The next section investigates this explanation.
E. Can Tick Size Explain Differences in Execution Costs?
The tick size can be viewed as the cost of gaining priority over the existing
quotes in a limit order market. The effect of tick size on transaction costs
remains ambiguous. Harris ~1994! argues that a smaller tick size increases
competition among liquidity providers and forces a reduction in quoted spread,
thus decreasing their willingness to provide liquidity. This might reduce the
cumulative depth in the limit order book and increase execution costs. The
above discussion suggests that a smaller tick size is likely to reduce the cost
of trading small trades; however, the effect on transaction costs of large
trades is unclear.
The Paris sample has prices ranging from around 150 FF to 2,500 FF.
Hence the Paris firms are in two categories of tick sizes: 0.10 FF ~1.7 cents!
and 1.0 FF ~17 cents!. Similarly, the New York firms are in two categories of
1466
The Journal of Finance
tick sizes: Eighth ~or 12.5 cents! from April 1997 to June 1997, and sixteenth
~or 6.25 cents! from July 1997 to March 1998. To investigate the effect of tick
size on execution costs, I partition my sample into four subsamples based on
the difference in tick sizes among firm pairs, and calculate execution cost
measures. The results of this analysis are presented in Table V. The tick size
in Paris is larger than the tick size in New York for subsamples 2 and 4,
while smaller in subsamples 1 and 3. If results are driven by larger tick
sizes in Paris, then differences in execution costs in subsamples 2 and 4 will
be substantially higher than subsamples 1 and 3. For quoted and effective
spread measures, the higher tick size of Paris firms may be partly driving
the differences across exchanges. However, the realized spread measures at
the Paris Bourse remain higher than the matched NYSE spreads in subsamples 1 and 3, in which the tick size in Paris is significantly smaller than
the tick size in New York.
The univariate analysis in this section provides weak evidence that the
differences in tick size between the exchanges are driving the differences in
execution costs. However, it is possible that part of the higher transactions
cost in Paris can be explained by cross-sectional differences in economic variables in the two samples. I investigate this explanation in the next section.
V. Can Economic Variables Explain the Differences
in Execution Costs?
Although the firms are matched on a few firm-specific characteristics, a
possibility is that heterogeneity in other economic variables, such as volatility and trading patterns, could explain the difference in execution costs. In
this section, I employ a cross-sectional regression framework similar to Bessembinder and Kaufman ~1997a! to investigate this possibility. The economic
variables employed include: ~1! monthly averages of the transaction price for
each firm ~in dollars!; ~2! market size ~in dollars!; ~3! the standard deviation
of hourly returns ~using quote midpoint!; ~4! the average monthly trading
volume ~in dollars!; and ~5! the monthly number of trades. I include exchange dummy variables for the New York and Paris firms: The NYSE ~Paris!
dummy variable equals 1 ~0! for all NYSE firm months, and equals 0 ~1!
otherwise. I control for the average relative tick size of the sample firms
during the month, where the relative tick size is defined as the tick size at
the time of the transaction divided by the transaction price. I also include
month dummy variables to control for monthly variations in execution costs.
I transform each of the economic variables and the relative tick size variable by deducting the variable’s sample mean ~which is computed across the
New York and Paris samples!, and estimate the regression using the transformed variables. This method allows us to make an intuitive interpretation
of the dummy coefficients of the regression. The intercept coefficient measures the estimated cost of executing a trade on each exchange for an average firm from the entire sample ~i.e., a firm with market capitalization,
stock price, trading volume, volatility, and relative tick size equal to the
Automated Versus Floor Trading
1467
means observed over the pooled Paris Bourse and NYSE sample!. Table VI
presents the results of three regression specifications: ~1! a simple noninteractive model, ~2! a noninteractive model with month dummies, and ~3! a
fully interactive model with month dummies.
As predicted by theory, trading costs vary inversely with trading volume,
ref lecting economies of scale, lower inventory control costs, and lower adverse selection costs. Percentage spreads decrease with stock price, ref lecting the fixed order-processing component of the spread. Percentage spread
measures vary directly with stock volatility, which ref lects higher adverse
selection and inventory risk associated with more volatile stocks. As predicted by Harris ~1994!, an increase in relative tick size increases the transactions cost to the liquidity demanders.
After controlling for cross-sectional differences in economic variables and
the relative tick size, the execution cost on the Paris Bourse continues to be
higher than on the NYSE. From Table VI, we see that the results are consistent across different regression specifications. The difference in effective
spreads between the two exchanges is 10 basis points. After accounting for
adverse selection, transactions cost continues to be higher in Paris ~16 basis
points! than in New York ~2 basis points!, and the difference is statistically
significant.
Table VII presents the results of the regression analysis of execution costs
by trade-size categories. The executions cost measures are higher in Paris
than in New York for all the trade-size categories. The difference in effective
spreads is about 17 basis points for very small trades, 8 basis points for
medium0small trades, and 13 basis points for very large trades, with all
differences highly significant. After accounting for differences in adverse
selection, the difference in execution cost increases to 19 basis points for
very large and very small trades.
Figures 2 and 3 present scatter plots of the actual spread measures of the
New York ~Paris! sample at the NYSE ~Paris Bourse! against the predicted
spread measures if the New York ~Paris! sample were traded at the Paris
Bourse ~NYSE!. The predicted spread measures were obtained using the
coefficients estimates of a fully interactive regression of execution cost measures on economic variables, relative tick sizes, and monthly dummies ~as
reported in Tables VI and VII!. The coefficient estimates of the regression
on Paris are used to predict the trading cost of the NYSE stocks if they were
traded on Paris ~by month and trade size!, and vice versa. If both trading
mechanisms provided similar execution for the same stock, then all points in
the scatter plot will lie along the 45-degree line. From Figure 2, we see that
while a few ~29! observations in the Paris sample have lower quoted spreads
in Paris than their predicted quoted spreads in New York, the NYSE is clearly
predicted to provide better execution in terms of effective spreads. The plot
of effective spread shows that the vast majority of observations of the Paris
Bourse firms lies below the 45-degree line, while the vast majority of observations of the NYSE firms lies above the 45-degree line. This suggests that
a vast majority of the Paris Bourse firms will have lower execution costs if
1468
Table V
Effect of Tick Size on Execution Costs
Quoted Spread
Paris
NYSE
Effective Spread
Diff
Paris
NYSE
Realized Spread
Diff
Paris
NYSE
8.69 a
Diff
Panel A: Matching Algorithm Is Market Price and Trading Volume
Subsample 1
NYSE tick ϭ 12.5 cents
Paris tick ϭ 1.7 cents
N ϭ 46
Subsample 2
NYSE tick ϭ 12.5 cents
Paris tick ϭ 17 cents
N ϭ 24
Subsample 3
NYSE tick ϭ 6.25 cents
Paris tick ϭ 1.7 cents
N ϭ 130
Subsample 4
NYSE tick ϭ 6.25 cents
Paris tick ϭ 17 cents
N ϭ 82
26.51 a
3.17 a
Ϫ12.66 a
23.46 a
25.87 a
Ϫ2.41 b
14.97 a
27.94 a
21.47 a
6.47 a
25.97 a
13.81 a
12.16 a
16.20 a
26.93 a
29.23 a
Ϫ2.30 b
24.31 a
18.75 a
5.56 a
15.69 a
26.57 a
17.28 a
9.29 a
24.82 a
11.52 a
13.30 a
16.15 a
Ϫ0.26
2.81 a
Ϫ0.33
6.28 a
16.46 a
12.88 a
16.48 a
The Journal of Finance
Percentage quoted spreads is time-weighted percentage quoted spreads for each firm. Percentage effective spreads is computed as @200 * dummy *
~price-mid!0mid#, where the dummy equals one for a market buy and negative one for a market sell, price is the transaction price, and mid is the
midpoint of the bid-ask quote at the time of the trade. Percentage realized spreads is computed as @200 * dummy * ~Price-Qmid30!0mid#, where
Qmid30 is the midpoint of the first quote observed after 30 minutes. Effective spreads are equally weighted across trades for each firm while
realized spreads are weighted by the inverse of the number of transactions during the 30 minutes after the trade. The sample is partitioned into
four subsamples based on the tick sizes of the NYSE and the Paris Bourse firm-pairs. Confidence intervals and p-values are obtained using
bootstrapping samples with 500 iterations. All spread measures are in percentage basis points. The p-value pertains to the null hypotheses that
mean spreads are equal across exchanges in each subsample. All measures in percentage basis points.
Panel B: Matching Algorithm Is Industry, Market Price, and Market Size
a
b
c
p-value , 0.01.
0.01 Յ p-value , 0.05.
0.05 Յ p-value , 0.10.
26.51 a
36.03 a
Ϫ9.52 a
23.46 a
24.82 a
Ϫ1.36 c
14.97 a
7.80 a
7.17 a
24.76 a
23.24 a
1.52 a
23.39 a
15.38 a
8.01 a
14.78 a
1.89 a
12.89 a
26.22 a
27.28 a
Ϫ1.06 c
23.70 a
18.06 a
5.64 a
15.39 a
3.15 a
12.24 a
24.20 a
19.80 a
4.40 a
22.94 a
13.52 a
9.42 a
15.04 a
1.01 a
14.03 a
Automated Versus Floor Trading
Subsample 1
NYSE tick ϭ 12.5 cents
Paris tick ϭ 1.7 cents
N ϭ 46
Subsample 2
NYSE tick ϭ 12.5 cents
Paris tick ϭ 17 cents
N ϭ 24
Subsample 3
NYSE tick ϭ 6.25 cents
Paris tick ϭ 1.7 cents
N ϭ 124
Subsample 4
NYSE tick ϭ 6.25 cents
Paris tick ϭ 17 cents
N ϭ 91
1469