Effect of synthesis conditions on the growth of ZnO nanorods via hydrothermal method
Bạn đang xem bản rút gọn của tài liệu. Xem và tải ngay bản đầy đủ của tài liệu tại đây (692.96 KB, 5 trang )
ARTICLE IN PRESS
Physica B 403 (2008) 3713– 3717
Contents lists available at ScienceDirect
Physica B
journal homepage: www.elsevier.com/locate/physb
Effect of synthesis conditions on the growth of ZnO nanorods via
hydrothermal method
D. Polsongkram a,Ã, P. Chamninok a, S. Pukird a, L. Chow b, O. Lupan b,c,Ã,
G. Chai d, H. Khallaf b, S. Park b, A. Schulte b
a
Department of Physics, Faculty of Science, Ubon Ratchathani University, Ubon Ratchathani 34190, Thailand
Department of Physics, University of Central Florida, 4000 Central Florida Blvd., Orlando, FL 32816-2385, USA
c
Department of Microelectronics and Semiconductor Devices, Technical University of Moldova, 168 Stefan cel Mare Blvd., MD-2004 Chisinau, Republic of Moldova
d
Apollo Technologies, Inc., 205 Waymont Court, 111, Lake Mary, FL 32746, USA
b
a r t i c l e in fo
abstract
Article history:
Received 11 April 2008
Received in revised form
10 June 2008
Accepted 12 June 2008
ZnO nanorods with hexagonal structures were synthesized by a hydrothermal method under different
conditions. The effect of synthesis conditions on ZnO nanorod growth was systematically studied by
scanning electron microscopy. All samples were characterized by X-ray diffraction, energy-dispersive
X-ray spectroscopy and micro-Raman spectroscopy. The results demonstrate that the morphology and
ordering of ZnO nanorods are determined by the growth temperature, the overall concentration of the
precursors and deposition time.
ZnO nanorod morphology and surface-to-volume ratio are most sensitive to temperature. The width
of ZnO nanorods can be controlled by the overall concentration of the reactants and by temperature. The
influence of the chemical reactions, the nucleation and growth process on the morphology of ZnO
nanorods is discussed.
& 2008 Elsevier B.V. All rights reserved.
PACS:
78.67.Bf
61.46.Km
78.55.Et
81.07.Àb
81.16.Be
Keywords:
ZnO nanorod
Hydrothermal synthesis
Morphology
1. Introduction
Zinc oxide (ZnO) is a II–VI semiconductor with a wide and
direct band gap of about 3.37 eV (at 300 K) and a large free exciton
binding energy of 60 meV [1], high optical gain (300 cmÀ1) [2],
high mechanical and thermal stabilities [3] and radiation hardness [4,5]. ZnO is very attractive for various applications such as
conductive oxide, antistatic coatings, sensors and touch display
panels and high band gap optoelectronic devices [1–5].
Due to the remarkable interest related to the specific properties of the one-dimensional (1-D) ZnO nanomaterials [6–9], recent
studies are focused mostly on the correlation of nanoarchitecture
morphology with deposition parameters and physical properties.
However, achieving control over ZnO nanomaterial morphology is
a challenging task.
à Corresponding authors at: Department of Physics, University of Central Florida,
4000 Central Florida Blvd. Orlando, FL 32816-2385, USA. Tel.: +1 407 823 5117;
fax: +1 407 823 5112.
E-mail addresses: , (O. Lupan).
0921-4526/$ - see front matter & 2008 Elsevier B.V. All rights reserved.
doi:10.1016/j.physb.2008.06.020
Various synthesis methods have been investigated and used in
ZnO nanorods fabrication, such as metal-organic chemical vapor
deposition (MOCVD) [10], metal-organic vapor phase epitaxy [11],
thermal evaporation [12], vapor phase transport process [13],
thermal chemical vapor deposition [14]. These growth techniques
are complicated and growth temperatures used are high
(4350 1C). The hydrothermal method [15,16] has attracted
considerable attention because of its unique advantages—it is a
simple, low temperature (60–100 1C), high yield and more
controllable process [17–19], than previously mentioned methods.
Preparation of 1-D ZnO nanorods by chemical deposition has been
reported by different groups [8,20–24]. It is believed that
synthesis without catalysts and templates is a better technique
for large-scale production of well-dispersed nanomaterials [20].
Using hydrothermal synthesis (chemical deposition), Nishizawa
et al. [21] have obtained needle-like ZnO crystals by decomposition of aqueous solution Na2Zn-EDTA at 330 1C. Recently, ZnO
nanorods synthesis was reported by Li’s group [22] under
cetyltrimethylammonium bromide (CTAB)—a chemical route at
180 1C for 24 h, using zinc powder as the initial material. Zn(OH)2
after dehydration was used by Lu’s group [23] to produce zinc
ARTICLE IN PRESS
3714
D. Polsongkram et al. / Physica B 403 (2008) 3713–3717
oxide at temperature 4100 1C. Also, micron-size ZnO crystals
were fabricated by Zn(OH)2 precursor without surfactants [23,24].
In the present work, we investigate the dependence of ZnO
nanorods morphology on precursor compositions and solution
growth conditions.
2. Experimental details
2.1. Synthesis
All chemicals were of analytical grade and were used
without further purification. In a typical procedure 0.01–0.1-M
zinc nitrate [Zn(NO3)2 Á 6H2O] was mixed with hexamethylenetetramine (HMT) (C6H12N4) solution slowly stirring until complete
dissolution.
Glass slides and Si wafers were used as substrates. Cleaning
procedures of substrate are reported elsewhere [25]. The reactor
was mounted onto a hot plate at a fixed temperature in the range
of 60–95 1C, and the reaction was allowed to proceed for different
durations of time between 10 and 60 min without any stirring.
ZnO nanocrystals were formed at a pH value of 10–11. After a predetermined time interval at 60–95 1C, the power of the hot plate
was turned off. The reactor was left on the hot plate for 30 min to
cool down to 40 1C. Finally, the substrates were dipped and rinsed
in deionized water and then the samples were dried in air at
150 1C for 5 min.
2.2. Measurements
X-ray diffraction (XRD) pattern was obtained on a Rigaku ‘‘D/B
max’’ X-ray diffractometer equipped with a monochromatic CuKa
radiation source (l ¼ 1.54178 A˚). The operating conditions of
40 kV and 30 mA in a 2y scanning range from 101 to 901 at room
temperature were used. Data acquisition was made with Data
Scan 4.1 and analyzed with Jade 3.1 (from Materials Data Inc.). The
composition and surface morphologies of ZnO films were studied
with energy dispersion X-ray spectroscopy (EDX) and scanning
electron microscopy (SEM) using a Hitachi S800.
Room temperature micro-Raman spectroscopy was used to
examine the optical and structural properties of ZnO structures.
Raman spectra were measured with a Horiba Jobin Yvon LabRam
IR system at a spatial resolution of 2 mm in a backscattering
configuration. The 633-nm line of a Helium Neon laser was used
as scattering light source with less than 4 mW power. The spectral
resolution was 2 cmÀ1. The instrument was calibrated to the same
accuracy using a naphthalene standard.
3. Results and discussion
3.1. X-ray observation of ZnO nanoarchitectures
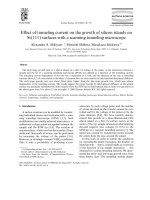
Fig. 1 shows an XRD pattern of ZnO nanorods synthesized in
aqueous complex solution at 90 1C (Fig. 1a) and 75 1C (Fig. 1b) for
30 min. In Fig. 1 all diffraction peaks can be indexed to hexagonal
wurtzite structure of zinc oxide (a ¼ 3.249 A˚, c ¼ 5.206 A˚, space
group: P63mc(186)) and diffraction data are in accordance
with Joint Committee on Powder Diffraction Standards of ZnO,
pdf #36-1451 [26].
From Fig. 1(a) the full width at half maximum (FWHM)
of the (0 0 0 2) peak is narrower than that of other diffraction
peaks. It indicates that /0 0 01S growth direction is the
preferred growth direction of the single ZnO nanostructure. The
sharp and narrow diffraction peaks indicate that the material
has good crystallinity for sample characterized in Fig. 1a. No
characteristic peaks from the intermediates such as Zn(OH)2 can
be detected.
Fig. 1. XRD spectra of ZnO nanorods via one-step reaction at (a) 90 1C for 30 min and (b) 75 1C for 30 min.
ARTICLE IN PRESS
D. Polsongkram et al. / Physica B 403 (2008) 3713–3717
The degree of c-orientation can be illustrated by the relative
texture coefficient, which was calculated to be 0.952, using the
expression [27]
TC002 ¼
ðI002 =Io002 Þ
,
½I002 =Io002 þ I101 =Io101
where I002 and I101 are the measured diffraction intensities due to
(0 0 0 2) and (1 0 1¯ 1) planes of grown nanorods, respectively. Io002
and Io101 are the values from the JCPDS [26].
From Fig. 1(b) for samples prepared at the first step, an
enhanced (1 0 1¯ 1) peak, which is dominant over other peaks can
be seen, indicating a wurtzite hexagonal phase. Notice that the
(0 0 0 2) peak of ZnO is weaker than the (1 0 1¯ 0) and (1 0 1¯ 1) peaks.
The peak intensity of (1 0 1¯ 1) peak also increases with the reaction
time. No minority phases are detected in the XRD pattern, which
implies that wurtzite hexagonal ZnO is obtained under prevailing
synthetic route. From energy dispersion X-ray spectroscopy (EDX),
it was found that the Zn:O ratios in our nanoarchitectures are
nearly stoichiometric (1:1) atomic ratio.
3715
3.2. SEM observation
The morphology-controlled synthesis of ZnO nanorods is of
great interest for future ZnO nanodevice application. By adjusting
the precursor concentration and reaction temperature, different
sizes of 1-D ZnO nanorod structures have been prepared via an
aqueous chemical route.
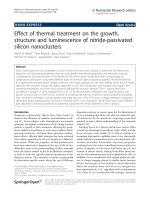
Fig. 2 displays SEM images of samples grown at 95, 75 and
60 1C (ZnNO3-0.040 M: HMT-0.025 M for constant duration of
30 min). Fig. 2(a) shows the morphology of ZnO sample grown at
95 1C. It is evident that the sample mainly consists of ZnO
nanorods and most of them assembly into branched and urchinlike morphologies. The nanostructures are typically about 2 mm in
length and 100–150 nm in diameter. Fig. 2(b) shows the
morphology of nanorods grown at 75 1C under the same
conditions. These ZnO nanorods show diameter of 500 nm on
average and length of 2–3 mm.
When the synthesis process was carried out at lower
temperature (60 1C), thick ZnO nanorods and thick branched
rods were obtained (Fig. 2c). The growth increases more along the
Fig. 2. Scanning electron microscopy (SEM) images of the ZnO nanorods grown from ZnNO3-0.040 M: HMT-0.025 M aqueous solution in 30 min at different temperatures:
(a) 95 1C, (b) 75 1C and (c) 60 1C.
Fig. 3. Scanning electron microscopy (SEM) images of the ZnO nanorods grown from aqueous solutions of (a) ZnNO3-0.005 M: HMT-0.005 M; (b) ZnNO3-0.010 M: HMT0.010 M; (c) ZnNO3-0.020 M: HMT-0.020 M; (d) ZnNO3-0.050 M: HMT-0.050 M in 15 min at 75 1C.
ARTICLE IN PRESS
3716
D. Polsongkram et al. / Physica B 403 (2008) 3713–3717
/2 1¯ 1¯ 0S rather than length-wise /0 0 0 1S direction. Experimental results reveal that for this composition and conditions,
temperature of the reactor plays an important role in the
formation of the ZnO nano/microrods.
Fig. 3 shows SEM images of ZnO on Si as a function of the
concentration ZnNO3-HMT: (a) 0.005 M: 0.005 M; (b) 0.010 M:
0.010 M; (c) 0.020 M:0.020 M; (d) 0.050 M:0.050 M, 15 min at
constant temperature of 75 1C.
We found that through optimization of the Zn2+/OHÀ concentrations, we can obtain ZnO nanorods with a higher surface-tovolume ratio. For lower HMT to ZnNO3 ratio wider nanostructures
were grown. Also, increasing thickness of the nanorods was
observed as the overall concentration of aqueous solution
increased (Fig. 3d). This was explained by the increase of the
amount of NHþ
4 ions produced from higher concentration of HMT.
In this way, complexes like ZnðOHÞ4Àx ðONH4 Þ2À
x are formed as the
2À
NHþ
growth units of nanorods, and
4 ions bind to the ZnðOHÞ4
ZnðOHÞ4Àx ðONH4 Þ2À
will be converted to ZnðOHÞ2À
and increase
x
4
the speed of growth during synthesis [28,29]. These processes are
endothermic and will hinder ZnO nanorod growth in the /0 0 0 1S
directions, making nanorods thicker.
In addition, the deposition time is another parameter to
control the size of ZnO nanorods [16,17]. Fig. 4 shows the SEM
morphologies of ZnO nanorods on Si as a function of the
deposition time at 75 1C.
We noticed that the shapes of the ZnO nanorods are hexagonal
and are independent of the deposition time. The nanorod size
increases and the density decreases when increasing the deposition time due to the ‘‘Ostwald ripening’’ [29].
Through our experiments, we systemically studied the influence of [Zn2+] concentration, growth temperature and time on the
morphology of the ZnO nanorods. The results show that the sizes
of nanorods are strongly dependent on [Zn2+] concentration. Fig. 2
shows that the width of the rods diminishes when increasing
temperature while keeping all other parameters constant. But the
effect of the temperature on the nanorods length is smaller; so the
aspect ratio increases with temperature.
Our results showed that controlled growth of nanorods ranging
from a thinner to a larger diameter can be realized by appropriate
choice of the initial precursor concentration. The results can be
used to guide a better understanding of the growth behavior of
ZnO nanorods and can contribute to the development of novel
nanodevices.
3.3. A proposed growth mechanism
ZnO is a polar crystal whose positive polar plane is rich in Zn
and the negative polar plane is rich in O [28]. Several growth
mechanisms [28,29] have been proposed for aqueous chemical
solution deposition. The most important growth path for a single
crystal is the so-called Ostwald ripening process [29]. This is a
spontaneous process that occurs because larger crystals are more
energetically favored than smaller crystals. In this case, kinetically
favored tiny crystallites nucleate first in supersaturated medium
and are followed by the growth of larger particles (thermodynamically favored) due to the energy difference between large and
smaller particles of higher solubility based on the Gibbs–Thomson
law [30].
The aqueous solutions of zinc nitrate and HMT can produce the
following chemical reactions. The concentration of HMT plays a
vital role for the formation of ZnO nanostructure since OHÀ is
strongly related to the reaction that produces nanostructures.
Initially, due to decomposition of zinc nitrate hexahydrate
and HMT at an elevated temperature, OHÀ was introduced in Zn2+
aqueous solution and their concentration increased:
ZnðNO3 Þ2 ! Zn2þ þ 2NOÀ
3
(1)
ðCH2 Þ6 N4 þ 6H2 O ! 6HCHO þ 4NH3
(2)
NH4 OH2NH3 þ H2 O
(3)
Zn2þ þ 4NH3 ! Zn½ðNH3 Þ4 2þ
k ¼ 10À9:58
2H2 O3H3 Oþ þ OHÀ ;
(4)
K ¼ 10À14
(5)
Znþ2 þ 2OHÀ 2ZnðOHÞ2 ,
K ¼ 3 Â 10À17
ZnðOHÞ2 ! ZnO þ H2 O
(6)
(7)
The separated colloidal Zn(OH)2 clusters in solution will act
partly as nuclei for the growth of ZnO nanorods. During the
hydrothermal growth process, the Zn(OH)2 dissolves with
increasing temperature. When the concentrations of Zn2+ and
OHÀ reach the critical value of the supersaturation of ZnO, fine
ZnO nuclei form spontaneously in the aqueous complex solution
[31]. When the solution is supersaturated, nucleation begins.
Afterwards, the ZnO nanoparticles combine together to reduce the
interfacial free energy. This is because the molecules at the surface
are energetically less stable than the ones already well ordered
and packed in the interior. Since the {0 0 1} face has higher
symmetry (C6v) than the other faces growing along the +c-axis
((0 0 0 1) direction), it is the typical growth plane. The nucleation
determines the surface-to-volume ratio of the ZnO nanorod. Then
incorporation of growth units into crystal lattice of the nanorods
by dehydration reaction takes place. It is concluded that the
growth habit is determined by thermodynamic factor and by
concentration of OHÀ as the kinetic factor in aqueous solution
growth.
3.4. Micro-Raman scattering
One effective approach to investigate the phase and purity of
the low-dimensional nanostructures is micro-Raman scattering.
Fig. 4. Scanning electron microscopy (SEM) images of the ZnO nanorods grown from ZnNO3-0.04 M: HMT-0.025 M at 75 1C as a function of deposition time: (a) 15 min, (b)
30 min and (c) 60 min.
ARTICLE IN PRESS
D. Polsongkram et al. / Physica B 403 (2008) 3713–3717
3717
the surface-to-volume ratio are most sensitive to bath temperature. The width of ZnO microrods can be reduced to nanorod size
by lowering the overall concentration of the reactants or by
increasing the temperature from 60 to 95 1C. The influence of
chemical reactions, nucleation and growth process on the
morphology of ZnO nanorods are discussed.
Acknowledgments
D. Polsongkram and P. Chamninok acknowledge financial
support from Thailand Government. L. Chow acknowledges
financial support from Apollo Technologies, Inc. and Florida High
Tech Corridor Program. O. Lupan acknowledges award (MTFP1014B Follow-On for young researchers) from the Moldovan
Research and Development Association (MRDA) under funding
from the US Civilian Research & Development Foundation (CRDF).
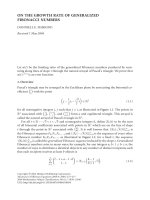
Fig. 5. Micro-Raman scattering spectra of the ZnO nanorod-based structures.
Room-temperature micro-Raman spectroscopy was performed to
examine the properties of the ZnO nanostructures. Wurtzite-type
ZnO belongs to the spacegroup C46v , with two formula units in
primitive cell [32]. The optical phonons at the G-point of the
Brillouin zone belong to the representation [32,33]:
Gopt ¼ 1A1 þ 2B1 þ 1E1 þ 2E2
(8)
The phonon modes E2 (low and high frequency), A1 [transverse
optical (TO) and longitudinal optical (LO)] and E1 (TO and LO) are
all expected to be Raman and infrared (IR) active. The A1 and E1
modes are polar and split into TO and LO phonons with different
frequencies due to the macroscopic electric fields associated with
the LO phonons.
A representative micro-Raman spectrum of the ZnO nanorods
is shown in Fig. 5. Dominant peaks at 100 and 438 cmÀ1, which are
commonly detected in the wurtzite structure ZnO [34], are
assigned to the low- and high-E2 mode of nonpolar optical
phonons, respectively, and are Raman active. The weaker peak at
332 cmÀ1 has been attributed to a second-order nonpolar E2 mode
[35], which is Raman active only. The Raman peak at 382 cmÀ1
came from the polar A1 mode of ZnO. The B1 modes are IR and
Raman inactive (silent modes) [36]. In the recorded Raman
spectra the E2(high) is clearly visible at 438 cmÀ1 with a width
of 10 cmÀ1 (Fig. 5), indicating the good crystal quality [35] of selfassembly radial structures. The E1(TO) and A1(TO) reflect the
strength of the polar lattice bonds [36].
4. Conclusion
In summary, ZnO micro- and nanorods with hexagonal
structure were synthesized by the hydrothermal solution technique. ZnO rods grown at 95 1C had a large aspect ratio than those
obtained at 60 1C.
Our procedure allows the growth of ZnO nanorods without any
seeds and/or surfactant. The controlled synthesis of ZnO nanorods
opens new applications such as fabrication of nanodevices.
The results presented in this article demonstrate that growth
temperature, the overall concentration of precursors and deposition time have influence on the morphology and ordering of ZnO
nanorods. It has been observed that ZnO nanorod morphology and
References
[1] D.G. Thomas, J. Phys. Chem. Solids 15 (1960) 86.
[2] Y. Chen, D.M. Bagnall, H. Koh, K. Park, K. Hiraga, Z. Zhu, T. Yao, J. Appl. Phys. 84
(1998) 3912.
[3] R.C. Wang, C.P. Liu, J.L. Huang, S.J. Chen, Y.K. Tseng, Appl. Phys. Lett. 87 (2005)
013110.
[4] F.D. Auret, S.A. Goodman, M. Hayes, M.J. Legodi, H.A. van Laarhoven, D.C. Look,
Appl. Phys. Lett. 79 (2001) 3074.
[5] A. Burlacu, V.V. Ursaki, D. Lincot, V.A. Skuratov, T. Pauporte, E. Rusu,
I.M. Tiginyanu, Phys. Status Solidi RRL 2 (2008) 68.
[6] J.H. He, S.T. Ho, T.B. Wu, L.J. Chen, Z.L. Wang, Chem. Phys. Lett. 435 (2007) 119.
[7] X. Wang, J. Zhou, J. Song, J. Liu, N. Xu, Z.L. Wang, Nano Lett. 6 (2006)
2768.
[8] O. Lupan, L. Chow, G. Chai, B. Roldan, A. Naitabdi, A. Schulte, Mater. Sci. Eng. B
145 (2007) 57.
[9] O. Lupan, G. Chai, L. Chow, Microelectron. J. 38 (2007) 1211.
[10] K.-S. Kim, H.W. Kim, Phys. B: Condens. Matter 328 (2003) 368.
[11] K. Ogata, K. Maejima, S. Fujita, S. Fujita, J. Cryst. Growth 248 (2003) 25.
[12] Q. Wan, K. Yu, T.H. Wang, Appl. Phys. Lett. 83 (2003) 2253.
[13] J. Grabowska, K.K. Nanda, K. McGlynn, J.P. Mosnier, M.O. Henry, A. Beaucamp,
A. Meaney, J. Mater. Sci.: Mater. Electron. 16 (2005) 397.
[14] T. Hirate, T. Kimpara, S. Nakamura, T. Satoh, Superlattices Microstruct. 42
(2007) 409.
[15] C.X. Xu, A. Wei, X.W. Sun, Z.L. Dong, J. Phys. D: Appl. Phys. 39 (2006) 1690.
[16] J. Song, S. Baek, S. Lim, Phys. B: Condens. Matter 403 (2008) 1960.
[17] L. Vayssieres, K. Keis, S. Lindquist, A. Hagfeldt, J. Phys. Chem. B 105 (2001)
3350.
[18] B. Liu, C.H. Zeng, J. Am. Chem. Soc. 125 (2003) 4430.
[19] Z. Qiu, K.S. Wong, M. Wu, W. Lin, H. Xu, Appl. Phys. Lett. 84 (2004) 2739.
[20] X.Y. Zhang, J.Y. Dai, H.C. Ong, N. Wang, H.L.W. Chan, C.L. Choy, Chem. Phys.
Lett 393 (2004) 17.
[21] H. Nishizawa, T. Tani, K. Matsuoka, J. Am. Ceram. Soc. 67 (1984) c-98.
[22] X.M. Sun, X. Chen, Z.X. Deng, Y.D. Li, Mater. Chem. Phys. 78 (2003) 99.
[23] C.H. Lu, C.H. Yeh, Ceram. Int. 26 (2000) 351.
[24] E. Ohshima, H. Ogino, I. Niikura, K. Maeda, M. Sato, M. Ito, T. Fukuda, J. Cryst.
Growth 260 (2004) 166.
[25] O.I. Lupan, S.T. Shishiyanu, L. Chow, T.S. Shishiyanu, Thin Solid Films 516
(2008) 338.
[26] Powder Diffraction File, Joint Committee on Powder Diffraction Standards,
ICDD, Swarthmore, PA, 1996, Card 36–1451(ZnO).
[27] Y. Kajikawa, S. Noda, H. Komiyama, Chem. Vapor Deposition 8 (2002) 99.
[28] H. Zhang, D. Yang, Y.J. Yi, X.Y. Ma, J. Xu, D.L. Que, J. Phys. Chem. B 108 (2004)
3955.
[29] O. Krichershy, J. Stavan, Phys. Rev. Lett. 70 (1993) 1473.
[30] J.W. Mullin, Crystallization, third ed, Butterworth/Heinemann, Oxford, 1997,
p. 1436.
[31] L.G. Sillen, A.E. Martell, Stability constants of metal–ion complexes, The
Chemical Society, Burlington House, London, 1964.
[32] C. Bundesmann, N. Ashkenov, M. Schubert, D. Spemann, T. Butz,
E.M. Kaidashev, M. Lorenz, M. Grundmann, Appl. Phys. Lett. 83 (2003) 1974.
[33] C.A. Arguello, D.L. Rousseau, S.P.S. Porto, Phys. Rev. 181 (1969) 1351.
[34] Y.J. Xing, Z.H. Xi, Z.Q. Xue, X.D. Zhang, J.H. Song, R.M. Wang, J. Xu, Y. Song,
S.L. Zhang, D.P. Yu, Appl. Phys. Lett. 83 (2003) 1689.
[35] J.M. Calleja, M. Cardona, Phys. Rev. B 16 (1977) 3753.
[36] T.C. Damen, S.P.S. Porto, B. Tell, Phys. Rev. 142 (1966) 570.