Illustrated course guide microsoft office 365 and powerpoint 2016 advanced spiral bound version 1st edition by beskeen solution manual
Bạn đang xem bản rút gọn của tài liệu. Xem và tải ngay bản đầy đủ của tài liệu tại đây (12.81 MB, 57 trang )
Illustrated Course Guide: Microsoft Office 365 & PowerPoint 2016: Advanced, Spiral
bound Version 1st edition by David W. Beskeen Solution Manual
Link full download solution manual: />Link full download test bank: />
Module 6: Enhancing Charts
A Guide to this Instructor’s Manual:
We have designed this Instructor’s Manual to supplement and enhance your teaching experience through classroom
activities and a cohesive module summary.
This document is organized chronologically, using the same heading in blue that you see in the textbook. Under each
heading you will find (in order): Lecture Notes that summarize the section, Teacher Tips, Classroom Activities, and Lab
Activities. Pay special attention to teaching tips, and activities geared towards quizzing your students, enhancing their
critical thinking skills, and encouraging experimentation within the software.
In addition to this Instructor’s Manual, our Instructor’s Resources Site also contains PowerPoint Presentations, Test
Banks, and other supplements to aid in your teaching experience.
Table of Contents
Module Objectives
122: Work with Charts in PowerPoint
124: Change Chart Design and Style
126: Customize a Chart
128: Format Chart Elements
130: Animate a Chart
132: Embed an Excel Chart
134: Link an Excel Worksheet
136: Update a Linked Excel Worksheet
End of Module Material
2
2
3
4
5
5
6
7
8
Module Objectives
Students will have mastered the material in PowerPoint Module 6 when they can:
Work with charts in PowerPoint
Animate a chart
Change chart design and style
Embed an Excel chart
Customize a chart layout
Link an Excel worksheet
Format chart elements
Update a linked Excel worksheet
122: Work with Charts in PowerPoint
LECTURE NOTES
Explain the method for creating charts from Excel within PowerPoint (by clicking the Chart button). A
sample chart appears on the slide and both PowerPoint and Excel windows are open.
Demonstrate how you can update data in the Excel worksheet and see changes to the chart
automatically on the PowerPoint slide.
Define and discuss the difference between embedding charts and linking charts. Embedded charts are
created from within PowerPoint using the Chart button or by copying and pasting a chart from Excel. A
linked chart is an object that is created in another program and is saved in a separate file.
You can apply themes to charts, which prevents you from having to format individual pieces of a chart.
You can refine some chart elements, such as the data series and legend.
© 2017 Cengage Learning®. All rights reserved. May not be scanned, copied or duplicated, in whole or in part, except for use as permitted in a license distributed
with a certain product or service or otherwise on a password-protected website for classroom use.
PowerPoint 2016 Instructor’s Manual
Page 2 of 7
The location of the axes titles, data labels, and the legend are determined by the type of chart layout
applied to the slide.
Advanced formatting options include the ability to specify the axes scales and adjust the interval
between the values or categories.
A trendline is a graphical representation of an upward or downward trend in a data series, also used to
predict future trends.
Error bars identify potential error amounts relative to each data marker in a data series.
Discuss the use of the Paste Special command.
CLASSROOM ACTIVITIES
1. Class Discussion: Discuss linking and embedding, and in what situations you would use each option.
2. Quick Quiz: Matching
1. Linked chart
2. Trendline
3. Error bar
4. Chart layout
5. Embedded chart
A. Becomes a part of the presentation like a picture
B. Determines the location of the legend
C. Upward or downward graphical representation
D. displays a picture of the chart
E. Identifies potential error amounts
Answer key:
1. D
2. C
3. E
4. B
5. A
124: Change Chart Design and Style
LECTURE NOTES
Being able to use Excel to create charts in PowerPoint offers you many advantages, including the
ability to format charts using Excel Chart tools to customize the design, layout, and formatting.
After you create a chart, you can immediately alter the way it looks by changing different individual
chart elements or by applying a predefined chart layout or style.
You can also easily change the color and effects of chart elements by applying one of the styles found
in the Chart Styles gallery.
Discuss the AutoFit Options available.
TEACHER TIP
Students may need help selecting the right element of a chart in order to customize it. Review the
procedures for selecting the entire chart, the gridlines, and so on. Explain that if certain features are
unavailable on the Ribbon, it may be that they have not properly selected the element that they want to
modify.
CLASSROOM ACTIVITIES
1. Critical Thinking: What would be a good reason to have multiple layouts applied to the same chart?
(Answer: Any creative answer is acceptable. A sample answer includes: One reason to have multiple
layouts applied to the same chart is if you need to present data to different groups of people and, among
those groups, you’d like to show different chart elements. For example, one group may not need to see a
© 2017 Cengage Learning®. All rights reserved. May not be scanned, copied or duplicated, in whole or in part, except for use as permitted in a
license distributed with a certain product or service or otherwise on a password-protected website for classroom use.
PowerPoint 2016 Instructor’s Manual
Page 3 of 7
chart title, while another group may not want to see the legend. One group may want or need the legend
to be in a specific location.)
2. Assign a Project:
Have students create a new chart in a presentation. Let them experiment with different styles.
126: Customize a Chart
LECTURE NOTES
Explain that you can customize chart elements, such as gridlines, labels, and the background.
Major gridlines identify major units on the axis and are usually identified by a tick mark.
Tick marks are small lines of measurement that intersect an axis and identify the categories, values, or
series in a chart.
Minor gridlines identify minor units on the axis and can also be identified by a tick mark.
Gridlines are helpful because they make the data easier to read.
Discuss the Insights pane. In PowerPoint 2013, this was the Research pane.
CLASSROOM ACTIVITIES
1. Class Discussion: Figure 6-5 shows the use of major and minor gridlines. Ask the students when they
would choose to use no gridlines? When would they choose to use major gridlines? Minor gridlines?
2. Quick Quiz:
1. Which type of gridline is represented by a tick mark? (Answer: Both major and minor gridlines are
represented by tick marks.)
2. You can right-click text elements of a chart and format them with the Mini toolbar. What is the
benefit of using the Mini toolbar? (Answer: It’s a fast and simple method for formatting text elements.)
3. Critical Thinking: How would you use the Insights pane to research organizations such as R2Go? What
phrases in a PowerPoint presentation on R2Go would you select?
128: Format Chart Elements
LECTURE NOTES
The benefit of formatting chart elements is to gain control of the chart's appearance.
Quick Styles in PowerPoint provide you with a number of choices to modify all the elements in a chart.
Even with all the Quick Style choices, you still may want to format individual elements to make the
chart easy to read and understand.
CLASSROOM ACTIVITIES
1. Classroom Discussion:
Have students point out specific Quick Styles and think of chart types that would benefit from them. Get
them thinking about best ways to present different types of information to different audiences.
2. Assign a Project:
Have students apply Quick Styles to the charts they created earlier in this lesson.
© 2017 Cengage Learning®. All rights reserved. May not be scanned, copied or duplicated, in whole or in part, except for use as permitted in a
license distributed with a certain product or service or otherwise on a password-protected website for classroom use.
PowerPoint 2016 Instructor’s Manual
Page 4 of 7
130: Animate a Chart
LECTURE NOTES
You can animate elements of a chart, much in the same way you animate text and graphics.
You can animate the entire chart as one object, or you can animate the data markers.
There are two options for animating data markers individually: by series or by category.
Animating data markers individually by series displays data markers of each data series (or the samecolored data markers).
Animating data markers individually by category displays the data markers of each category in the
chart. If you choose to animate the chart’s data markers as a series, the entire data series is animated
as a group; the same is true for animating data markers by category.
Point out the Clues to Use box on inserting a picture as a slide background.
TEACHER TIP
Discuss the problem with animating too many objects on a slide. Too much animation may detract from
the message of the presentation or, worse, the animation may become the focus of the slide show, not the
content being delivered.
CLASSROOM ACTIVITIES
1. Critical Thinking: What types of charts would not benefit from animation? (Answer: Any type of chart
that needs to be shown all at once in order to be understood. For example, when using a pie chart, you
typically want to show how something is divided so that you can make comparisons among the individual
slices. In this case, it would not be effective to present one slice of the pie chart at a time. Viewers could
not learn anything from the chart until all of the slices of the pie chart were present.)
2. Quick Quiz:
1. You can animate the entire chart as one object, or you can animate the
. (Answer:
data markers)
2. Animating data markers individually by
displays the data markers of each category
in the chart. (Answer: category)
3. Critical Thinking: Why would you want to use a picture as a slide background? Give some examples of
picture backgrounds that R2G could use.
LAB ACTIVITIES
1. Create a sample chart or use one from this chapter. Supply all of the students with the same chart. Tell
them that they can animate the data markers by series or by category. Students should determine which
option would be the most appropriate and be able to explain why. Spark a classroom discussion to find out
why students chose the option that they did.
2. Access the web and find a royalty-free image that is consistent with R2G. Create a new PowerPoint
presentation and add the image as a background to a slide. Spark a classroom discussion to find out why
students chose the image that they did.
© 2017 Cengage Learning®. All rights reserved. May not be scanned, copied or duplicated, in whole or in part, except for use as permitted in a
license distributed with a certain product or service or otherwise on a password-protected website for classroom use.
PowerPoint 2016 Instructor’s Manual
Page 5 of 7
132: Embed an Excel Chart
LECTURE NOTES
Remind students that they can embed an Excel chart from within PowerPoint or embed an existing
chart from PowerPoint.
Embedding occurs when you use one program to create an object in another program.
Review the following terms and concepts:
When you use a program, such as Excel, to embed charts, Excel is the source program.
The object you create with the source program is called the source file.
The program into which you insert the source file is the destination file.
Explain the difference between embedding all or part of an Excel worksheet.
CLASSROOM ACTIVITIES
1. Quick Quiz: Matching
1. Excel chart in PowerPoint
2. Excel
3. PowerPoint with Excel chart inserted
4. Microsoft Graph
A. Source program
B. Source file
C. If you do not have Excel
D. Destination file
Answer Key
1. B
2. A
3. D
4. C
2. Critical Thinking: When would it be better to embed a chart in PowerPoint rather than link one? When
would it be better to link a chart in PowerPoint rather than to embed one? (Answer: It would be better to
embed a chart in PowerPoint when you want to be able to continually edit the chart data in Excel and have
the chart update automatically on the PowerPoint slide. It would be better to link a chart in PowerPoint
when you do not want the chart altered from within PowerPoint by another user or by mistake.)
134: Link an Excel Worksheet
LECTURE NOTES
Discuss linking objects in PowerPoint and differentiate linking from embedding.
When you link a chart in PowerPoint, a link is established between the source file and the destination
file.
Unlike embedded objects, a linked object is stored in its source file, not on the slide or in the
presentation file.
The object in the destination file is just a representation of the source file.
Any changes made to the source file are automatically reflected in the destination file.
You can link bitmap images, Excel worksheets, and even PowerPoint slides.
Use Table 6-1 to review when you should use embedding and when you should use linking.
© 2017 Cengage Learning®. All rights reserved. May not be scanned, copied or duplicated, in whole or in part, except for use as permitted in a
license distributed with a certain product or service or otherwise on a password-protected website for classroom use.
PowerPoint 2016 Instructor’s Manual
Page 6 of 7
CLASSROOM ACTIVITIES
1. Classroom Discussion:
Have students give real-world examples of when they would embed vs. link. Have students explain their
reasoning.
2. Quick Quiz:
Imagine you have two Excel worksheets that you need to insert into PowerPoint. One of the worksheets
(Worksheet A) is a list of all of the schools you attended and the teachers you had from K-12th grade. The
other worksheet (Worksheet B) is a record of your three children’s height, weight, and body mass index
that you update each year after their annual physical. Which worksheet (A or B) should you link to the
PowerPoint slide and why? (Answer: You should link Worksheet B because it has information that will need
to be updated each year in the source program.)
136: Update a Linked Excel Worksheet
LECTURE NOTES
Demonstrate how to update a linked object by opening the object in the source program and making
edits to it.
You can open the source program by double-clicking the linked object in the PowerPoint slide, as you
did with embedded objects, or by starting the source program.
When you work on a linked object in its source program, your PowerPoint presentation can be either
open or closed.
Explain how to edit a link.
CLASSROOM ACTIVITIES
1. Quick Quiz:
1. (True/False) When you update a linked object, PowerPoint must be open the entire time. (Answer:
False)
2. (True/False) You can update a linked file by double-clicking its image on the PowerPoint slide.
(Answer: True)
3. You can link Excel worksheets and PowerPoint slides from another presentation into PowerPoint.
(Answer: True)
2. Critical Thinking: John opens a PowerPoint presentation and views Slide 6, which includes an image of a
chart. He double-clicks the chart and receives a warning message that he cannot work on the chart
because Excel is not installed on his computer. Which of the following is true? The originator of the
PowerPoint presentation: a) Embedded the chart in PowerPoint, or b) Created the chart in Microsoft Excel,
then linked it to PowerPoint. (Answer: b. You can tell that the chart is linked because it requires another
program to update the chart.)
© 2017 Cengage Learning®. All rights reserved. May not be scanned, copied or duplicated, in whole or in part, except for use as permitted in a
license distributed with a certain product or service or otherwise on a password-protected website for classroom use.
PowerPoint 2016 Instructor’s Manual
Page 7 of 7
End of Module Material
Concepts Reviews consist of multiple choice, matching, and screen identification questions.
Skills Reviews provide additional hands-on, step-by-step reinforcement.
Independent Challenges are case projects requiring critical thinking and application of the module
skills. The Independent Challenges increase in difficulty, with the first one in each module being
the easiest. Independent Challenges 2 and 3 become increasingly open-ended, requiring more
independent problem solving.
Independent Challenge 4: Explore contain practical exercises to help students with their everyday
lives by focusing on important and useful essential skills, including creating photo montages for
scrapbooks and photo albums, retouching and color-correcting family photos, applying layer styles
and getting Help online.
Visual Workshops are practical, self-graded capstone projects that require independent problem
solving.
Top of Document
© 2017 Cengage Learning®. All rights reserved. May not be scanned, copied or duplicated, in whole or in part, except for use as permitted in a
license distributed with a certain product or service or otherwise on a password-protected website for classroom use.
Microsoft Office 2016 Illustrated Introductory
PowerPoint 2016 Module 6 Enhancing Charts
PowerPoint - 1
Module 6
Enhancing Charts
Table of Contents
Module 6 Enhancing Charts ............................................................................................................. 1
Concepts Review ......................................................................................................................... 1
Skills Review................................................................................................................................ 2
Independent Challenge 1 ............................................................................................................. 3
Independent Challenge 2 ............................................................................................................. 3
Independent Challenge 3 ............................................................................................................. 4
Independent Challenge 4: Explore................................................................................................ 4
Visual Workshop .......................................................................................................................... 5
Module 6: Enhancing Charts
Concepts Review
Screen Label ing
1. Worksheet
2. Animation tag
3. Vertical axis; Value axis
4. Legend
5. Data label
6. Error bar
7. Chart Elements button
8. Trendline
Matching
9. e
10. c
11. b
12. d
13. a
Multi ple Choice
14. b
15. d
16. b
17. a
18. c
19. d
20. a
Microsoft Office 2016 Illustrated Introductory
PowerPoint 2016 Module 6 Enhancing Charts
PowerPoint - 2
Skills Review
Data Filename: PPT 6-4.pptx
Solution Filename: PPT 6-Solomon.pptx
Steps 1a – 1f: Students begin with a data file which they are asked to modify by changing the chart layout to
Layout 9 on Slide 2, change the value axis title to Millions, change the category label tot Divisions, apply
Style 14 chart style, change the chart type to Clustered Bar, then add Fiscal Year to the chart title.
Steps 2a – 2g: Add primary minor vertical gridlines, primary major horizontal gridlines and outside end data
labels to the chart. Add standard error bars to the chart from the Chart Elements gallery, format the value
axis and category axis labels, then add major Cross tick marks and minor outside tick marks to the value axis.
Steps 3a – 3h: Select the 1st Qrtr data series, change the Gap Width to 150%, set the Series Overlap to -20%,
change the data series fill to preset gradient Bottom Spotlight – Accent 1, change the data marker effect to
Glow preset Blue-Gray, 11 pt glow, Accent color 1. Move the legend to the Right, then add a solid fill with a
75% transparency to the legend.
Steps 4a – 4f: Apply the Wipe entrance animation to the chart, change the animation effect to By Element in
Series, change the animation of the chart background to not animate, then apply a 1.50 animation duration
and .75 delay.
Steps 5a – 5h: Embed an Excel chart, PPT 6-5.xlsx to Slide 3, increase the chart size, open the chart in Excel,
then change cell D6 to 35,590.20 and cell D7 to 67,429.00. Open Sheet2 in the workbook, apply an
automatic outline color to the value axis and the category axis, apply the outline color Blue, Accent 1 to the
legend, then change the legend outline to 2 ¼ pt square dot dash.
Steps 6a – 6f: Insert a new slide after Slide 3 with the Title Only layout, enter Credit Balance in the title
placeholder, link the Excel worksheet, PPT 6-6.xlxs (Note: have your students make a copy of the Excel file so
to keep the data intact) resize the worksheet, format the worksheet with the solid fill color Green, Accent 6,
then change the transparency to 20%.
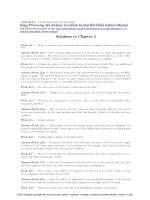
Steps 7a – 7f: Open the worksheet in Excel, apply the Currency format to cells B4 to E7, apply bold to cell
F8, then change cell D5 to 31,596.54 and cell B6 to 74,992.21. Students are given specific instructions in this
Skills Review, so their solution file should be similar to the figure below of the solution presentation
provided (Figure 6-18 in the book):
Microsoft Office 2016 Illustrated Introductory
PowerPoint 2016 Module 6 Enhancing Charts
PowerPoint - 3
Independent Challenges
Because students will solve the independent challenges in different ways, it is important to stress there is
not just one correct solution. The following are examples of possible solutions for the Independent
Challenges in Module 6 of this book.
Independent Challenge 1
Data Filename: PPT 6-7.pptx
Solution Filename: PPT 6-Vortec.pptx
Students start with a data file provided and modify the chart layout on Slide 3 to Layout 3. Students need to
add a title to the chart and change the chart type to Clustered Bar, then add primary minor vertical gridlines.
Add major outside tick marks to the value axis, Inside End data labels, and percentage error bars to the
chart. A typical slide might look like the following figure:
Independent Challenge 2
Data Filename: PPT 6-8.pptx
Solution Filename: PPT 6-Indiana.pptx
Students start with a data file provided and modify the chart type of the chart on Slide 6 to Clustered
Column, add primary major vertical gridlines, move the legend to the top of the chart, change the fill of the
Reading data series to a dark Linear Down gradient, change the Math data series to Recycled paper texture
fill, then change the Writing data series shape outline to Blue 3 pt. Apply the Split entrance animation to the
chart, then change the effect options to By Category. A typical slide might look like the following figure:
Microsoft Office 2016 Illustrated Introductory
PowerPoint 2016 Module 6 Enhancing Charts
PowerPoint - 4
Independent Challenge 3
Data Filename: PPT 6-9.pptx
Solution Filename: PPT 6-Jendos.pptx
Students start with a data file provided and apply the Crop theme to the presentation, apply a variant add a
new slide with the Title and Content layout after the title slide, then create and format a SmartArt graphic
with information provided in the book. Students then embed the file PPT 6-10.xlsx to the Division
Performance slide, resize the chart, apply the Style 5 to the chart, then apply data labels with a Low position.
Link the file PPT 6-11.xlsx to the Division Budgets slide, apply the Accounting Number Format to cells B4 to
F10 in the worksheet, then format the worksheet with an accent color at 30% transparency. A typical slide
might look like the following figure:
Independent Challenge 4: Explore
Data Filename: PPT 6-12.pptx
Solution Filename: PPT 6-Review.pptx
Microsoft Office 2016 Illustrated Introductory
PowerPoint 2016 Module 6 Enhancing Charts
PowerPoint - 5
Students start with a data file provided and use the Internet to research information for the presentation.
Students should use the information provided in the challenge to help them locate information on the
Internet. In this challenge, students link an Excel file, PPT 6-13.xlsx, modify the linked chart, create a SmartArt
graphic, create a table, and then apply a design theme and format the slides. Students will add appropriate
graphics and modify the Slide Master to enhance the presentation. A typical slide might look like the
following figure:
Visual Workshop
Data Filename: Creates new
Solution Filename: PPT 6-Capital.pptx
Student presentation should look like the following figure (Figure F-19 in the book). Student needs to embed
and format the Excel chart PPT 6-14.xlsx as shown. Format the worksheet with a Linear Down fill.
Your Name
“Forward Stride”
Performance Review
ESL AND SPECIAL IP PROGRAM
INDIANA STATE PUBLIC SCHOOL SYSTEM
Your Name
“Forward Stride” Mission
• Education should be a priority for all parents and guardians
• All children should have equal access to the educational system to further their
goals and dreams
• Parents and guardians need help understanding each child’s individual potential
Your Name
“Forward Stride” Program Data
• Program cost per child held at $10,000
• In the past year, over 6700 children have participated in program
• Annual cost to Indiana State Schools, $5.5 Million
• Goal to save over $1 million per year with private and corporate funds
Your Name
“Forward Stride” Goals
• 5 year goals:
• 10 year goals:
• Establish program in 25% of state’s
districts
• Have at least 75% of schools
participating in program
• Program certification to increase by
45%
• 75% of eligible students
participating
• 65% of eligible students
participating
• Develop private and corporation
funding
• Parental education in all districts
• Reach program certification goal of
90%
Program Process
Student Assessment
IP Development
Learning Goals
Approval Process
Program Placement
Your Name
Your Name
“Forward Stride” Results
Reading
Writing
Math
25
20
15
10
5
0
6
7
8
9
10
11
12
JENDOS INDUSTRIES
Division Manager Meeting
Rating Report
Your Name
Company Divisions
Administration
Accounting
Research and
Development
Your Name
Sales and
Marketing
Manufacturing
Efficiency Analysis
■
■
■
Company performance
– Ave. 3.2% inflation: gross profit
6.1%
– After tax and insurance
obligations, NET PROFIT= 2.7%
Sales, Testing, Development &
Manufacturing
– Efficiency up an average of
8.5%
Administration, Accounting &
Research
– Efficiency down an average of
2.3%
Your Name
■
US Manufacturing Assoc. efficiency
ratings
– Company is in a 60-day rating
review
– AA Manufacturing rating
– Jendos needs AA+ rating
Division Performance
Your Name
Division Budgets
Jendos Division Budgets
Fiscal Year
Quarter 1
Administration
$ 89,500.00
Accounting
$ 65,000.00
Manufacturing
$ 155,800.00
Product Testing $ 65,500.00
R&D
$ 25,670.00
Sales/Marketing $ 95,740.00
Total
$ 497,210.00
Your Name
Quarter 2
$ 92,500.00
$ 65,000.00
$ 165,500.00
$ 75,750.00
$ 35,300.00
$ 110,400.00
$ 544,450.00
Quarter 3
$ 89,500.00
$ 65,000.00
$ 185,000.00
$ 45,300.00
$ 42,500.00
$ 105,700.00
$ 533,000.00
Quarter 4
Total
$ 105,500.00 $ 377,000.00
$ 65,000.00 $ 260,000.00
$ 185,500.00 $ 691,800.00
$ 55,300.00 $ 241,850.00
$ 55,000.00 $ 158,470.00
$ 90,400.00 $ 402,240.00
$ 556,700.00 $ 2,131,360.00
Divisions & Managers
Board of Directors
Ned Bosold
CEO & President
Administratio
n Irene
Shivers AVP
Manufacturing
Jan Gorstein
AVP
Product Development
Tim Jordson
AV
P
Your Name
Sales & Marketing
Madeline Jergo
AVP
Product
Testing Su
Ling
AVP
Research &
Developmen
t Genie Goff
AVP
Special
Assistant Alok
Faruk
AVP
1
Community Development
Projects - Kenya
Presented by
Reason2Go
Marketing Dept.
Your Name