Tách nguồn âm thanh sử dụng mô hình phổ nguồn tổng quát trên cơ sở thừa số hoá ma trận không âm
Bạn đang xem bản rút gọn của tài liệu. Xem và tải ngay bản đầy đủ của tài liệu tại đây (2.42 MB, 212 trang )
MINISTRY OF EDUCATION AND TRAINING
HANOI UNIVERSITY OF SCIENCE AND TECHNOLOGY
DUONG THI HIEN THANH
AUDIO SOURCE SEPARATION EXPLOITING NMFBASED GENERIC SOURCE SPECTRAL MODEL
DOCTORAL DISSERTATION OF COMPUTER SCIENCE
Hanoi - 2019
MINISTRY OF EDUCATION AND TRAINING
HANOI UNIVERSITY OF SCIENCE AND TECHNOLOGY
DUONG THI HIEN THANH
AUDIO SOURCE SEPARATION EXPLOITING NMFBASED GENERIC SOURCE SPECTRAL MODEL
Major: Computer Science
Code: 9480101
DOCTORAL DISSERTATION OF COMPUTER SCIENCE
SUPERVISORS:
1. ASSOC. PROF. DR. NGUYEN QUOC CUONG
2. DR. NGUYEN CONG PHUONG
Hanoi - 2019
DECLARATION OF AUTHORSHIP
I, Duong Thi Hien Thanh, hereby declare that this thesis is my original work and
it has been written by me in its entirety. I confirm that:
• This work was done wholly during candidature for a Ph.D. research degree at
Hanoi University of Science and Technology.
• Where any part of this thesis has previously been submitted for a degree or any
other qualification at Hanoi University of Science and Technology or any other
institution, this has been clearly stated.
• Where I have consulted the published work of others, this is always clearly attributed.
• Where I have quoted from the work of others, the source is always given. With
the exception of such quotations, this thesis is entirely my own work.
• I have acknowledged all main sources of help.
• Where the thesis is based on work done by myself jointly with others, I have
made exactly what was done by others and what I have contributed myself.
Hanoi, February 2019
Ph.D. Student
Duong Thi Hien Thanh
SUPERVISORS
Assoc.Prof. Dr. Nguyen Quoc Cuong
i
Dr. Nguyen Cong Phuong
ACKNOWLEDGEMENT
This thesis has been written during my doctoral study at International Research
Institute Multimedia, Information, Communication, and Applications (MICA), Hanoi
University of Science and Technology (HUST). It is my great pleasure to thank
numer- ous people who have contributed towards shaping this thesis.
First and foremost I would like to express my most sincere gratitude to my
supervi- sors, Assoc. Prof. Nguyen Quoc Cuong and Dr. Nguyen Cong Phuong, for
their great guidance and support throughout my Ph.D. study. I am grateful to them
for devoting their precious time to discussing research ideas, proofreading, and
explaining how to write good research papers. I would like to thank them for
encouraging my research and empowering me to grow as a research scientist. I could
not have imagined having a better advisor and mentor for my Ph.D. study.
I would like to express my appreciation to my supervisor in Master cource, Prof.
Nguyen Thanh Thuy, School of Information and Communication Technology HUST, and Dr. Nguyen Vu Quoc Hung, my supervisor in Bachelors course at Hanoi
National University of Education. They had shaped my knowledge for excelling in
studies.
In the process of implementation and completion of my research, I have received
many supports from the board of MICA directors and my colleagues at Speech Communication department. Particularly, I am very much thankful to Prof. Pham Thi
Ngoc Yen, Prof. Eric Castelli, Dr. Nguyen Viet Son and Dr. Dao Trung Kien, who
pro- vided me with an opportunity to join researching works in MICA institute and
have access to the laboratory and research facilities. Without their precious support
would it have been being impossible to conduct this research. My warmly thanks go
to my colleagues at Speech Communication department of MICA institute for their
useful comments on my study and unconditional support over four years both at
work and outside of work.
I am very grateful to my internship supervisor Prof. Nobutaka Ono and the members of Ono’s Lab at the National Institute of Informatics, Japan for warmly
welcoming me into their lab and the helpful research collaboration they offered. I
much appreciate his help in funding my conference trip and introducing me to the
signal processing research communities. I would also like to thank Dr. Toshiya
ii
Ohshima, MSc. Yasu- taka Nakajima, MSc. Chiho Haruta and other researchers at
Rion Co., Ltd., Japan for
ii
welcoming me to their company and providing me data for experimental.
I would also like to sincerely thank Dr. Nguyen Quang Khanh, dean of
Information Technology Faculty, and Assoc. Prof. Le Thanh Hue, dean of Economic
Informatics Department, at Hanoi University of Mining and Geology (HUMG) where
I am work- ing. I have received the financial and time support from my office and
leaders for completing my doctoral thesis. Grateful thanks also go to my wonderful
colleagues and friends Nguyen Thu Hang, Pham Thi Nguyet, Vu Thi Kim Lien, Vo
Thi Thu Trang, Pham Quang Hien, Nguyen The Binh, Nguyen Thuy Duong, Nong
Thi Oanh and Nguyen Thi Hai Yen, who have the unconditional support and help
during a long time. A special thank goes to Dr. Le Hong Anh for the encouragement
and his precious advice.
Last but not the least, I would like to express my deepest gratitude to my family. I
am very grateful to my mother-in-law and father-in-law for their support in the time
of need, and always allow me to focus on my work. I dedicate this thesis to my
mother and father with special love, they have been being a great mentor in my life
and had constantly encouraged me to be a better person. The struggle and sacrifice
of my parents always motivate me to work hard in my studies. I would also like to
express my love to my younger sisters and younger brother for their encouraging and
helping. This work has become more wonderful because of the love and affection that
they have provided.
A special love goes to my beloved husband Tran Thanh Huan for his patience and
understanding, for always being there for me to share the good and bad times. I also
appreciate my sons Tran Tuan Quang and Tran Tuan Linh for always cheering me up
with their smiles. Without love from them, this thesis would not have been
completed.
Thank you all!
Hanoi, February 2019
Ph.D. Student
Duong Thi Hien Thanh
3
CONTENTS
DECLARATION OF AUTHORSHIP . . . . . . . . . . . . . . . . . . . . .
i
i
DECLARATION OF AUTHORSHIP
ACKNOWLEDGEMENT . . . . . . . . . . . . . . . . . . . . . . . . . . .
ii
CONTENTS . . . . . . . . . . . . . . . . . . . . . . . . . . . . . . . . . .
iv
NOTATIONS AND GLOSSARY . . . . . . . . . . . . . . . . . . . . . . . .
viii
LIST OF TABLES . . . . . . . . . . . . . . . . . . . . . . . . . . . . . . .
xi
LIST OF FIGURES . . . . . . . . . . . . . . . . . . . . . . . . . . . . . .
xii
INTRODUCTION . . . . . . . . . . . . . . . . . . . . . . . . . . . . . . .
1
Chapter 1. AUDIO SOURCE SEPARATION: FORMULATION AND STATE OF
THE ART
10
1.1
Audio source separation: a solution for cock-tail party problem . . . .
10
1.1.1
General framework for source separation . . . . . . . . . . .
10
1.1.2
Problem formulation . . . . . . . . . . . . . . . . . . . . . .
11
State of the art . . . . . . . . . . . . . . . . . . . . . . . . . . . . . .
13
1.2.1
. . . . . . . . . . . . . . . . . . . . . . . .
13
1.2.1.1
Gaussian Mixture Model . . . . . . . . . . . . . .
14
1.2.1.2
Nonnegative Matrix Factorization . . . . . . . . . .
15
1.2.1.3
Deep Neural Networks . . . . . . . . . . . . . . .
16
Spatial models . . . . . . . . . . . . . . . . . . . . . . . . .
18
1.2.2.1
Interchannel Intensity/Time Difference (IID/ITD) .
18
1.2.2.2
Rank-1 covariance matrix . . . . . . . . . . . . . .
19
1.2.2.3
Full-rank spatial covariance model . . . . . . . . .
20
Source separation performance evaluation . . . . . . . . . . . . . . .
21
1.3.1
Energy-based criteria . . . . . . . . . . . . . . . . . . . . . .
22
1.3.2
Perceptually-based criteria . . . . . . . . . . . . . . . . . . .
23
Summary . . . . . . . . . . . . . . . . . . . . . . . . . . . . . . . .
23
1.2
1.2.2
1.3
1.4
Spectral models
Chapter 2. NONNEGATIVE MATRIX FACTORIZATION
2.1
NMF introduction . . . . . . . . . . . . . . . . . . . . . . . . . . . .
4
24
24
2.2
2.3
2.1.1
NMF in a nutshell . . . . . . . . . . . . . . . . . . . . . . .
24
2.1.2
Cost function for parameter estimation . . . . . . . . . . . . .
26
2.1.3
Multiplicative update rules . . . . . . . . . . . . . . . . . . .
27
Application of NMF to audio source separation . . . . . . . . . . . .
29
2.2.1
Audio spectra decomposition . . . . . . . . . . . . . . . . . .
29
2.2.2
NMF-based audio source separation . . . . . . . . . . . . . .
30
Proposed application of NMF to unusual sound detection . . . . . . .
32
2.3.1
Problem formulation . . . . . . . . . . . . . . . . . . . . . .
33
2.3.2
Proposed methods for non-stationary frame detection . . . . .
34
2.3.2.1
Signal energy based method . . . . . . . . . . . . .
34
2.3.2.2
Global NMF-based method . . . . . . . . . . . . .
35
2.3.2.3
Local NMF-based method . . . . . . . . . . . . . .
35
Experiment . . . . . . . . . . . . . . . . . . . . . . . . . . .
37
2.3.3.1
Dataset . . . . . . . . . . . . . . . . . . . . . . . .
37
2.3.3.2
Algorithm settings and evaluation metrics . . . . .
37
2.3.3.3
Results and discussion . . . . . . . . . . . . . . . .
38
Summary . . . . . . . . . . . . . . . . . . . . . . . . . . . . . . . .
43
2.3.3
2.4
Chapter 3. SINGLE-CHANNEL AUDIO SOURCE SEPARATION EXPLOITING
NMF-BASED GENERIC SOURCE SPECTRAL MODEL WITH MIXED GROUP
SPARSITY CONSTRAINT
44
3.1
General workflow of the proposed approach . . . . . . . . . . . . . .
44
3.2
GSSM formulation . . . . . . . . . . . . . . . . . . . . . . . . . . .
46
3.3
Model fitting with sparsity-inducing penalties . . . . . . . . . . . . .
46
3.3.1
Block sparsity-inducing penalty . . . . . . . . . . . . . . . .
47
3.3.2
Component sparsity-inducing penalty . . . . . . . . . . . . .
48
3.3.3
Proposed mixed sparsity-inducing penalty . . . . . . . . . . .
49
3.4
Derived algorithm in unsupervised case . . . . . . . . . . . . . . . .
49
3.5
Derived algorithm in semi-supervised case . . . . . . . . . . . . . . .
52
3.5.1
Semi-GSSM formulation . . . . . . . . . . . . . . . . . . . .
52
3.5.2
Model fitting with mixed sparsity and algorithm . . . . . . . .
54
Experiment . . . . . . . . . . . . . . . . . . . . . . . . . . . . . . .
54
3.6.1
Experiment data . . . . . . . . . . . . . . . . . . . . . . . .
54
3.6.1.1
55
3.6
Synthetic dataset . . . . . . . . . . . . . . . . . . .
5
3.6.2
3.6.3
3.7
3.6.1.2
SiSEC-MUS dataset . . . . . . . . . . . . . . . . .
55
3.6.1.3
SiSEC-BNG dataset . . . . . . . . . . . . . . . . .
56
Single-channel source separation performance with unsupervised setting . . . . . . . . . . . . . . . . . . . . . . . . . .
57
3.6.2.1
Experiment settings . . . . . . . . . . . . . . . . .
57
3.6.2.2
Evaluation method . . . . . . . . . . . . . . . . . .
57
3.6.2.3
Results and discussion . . . . . . . . . . . . . . . .
61
Single-channel source separation performance with semi-supervised
setting . . . . . . . . . . . . . . . . . . . . . . . . . . . . . .
65
3.6.3.1
Experiment settings . . . . . . . . . . . . . . . . .
65
3.6.3.2
Evaluation method . . . . . . . . . . . . . . . . . .
65
3.6.3.3
Results and discussion . . . . . . . . . . . . . . . .
65
Summary . . . . . . . . . . . . . . . . . . . . . . . . . . . . . . . .
66
Chapter 4. MULTICHANNEL AUDIO SOURCE SEPARATION EXPLOITING
NMF-BASED GSSM IN GAUSSIAN MODELING FRAMEWORK
68
4.1
Formulation and modeling . . . . . . . . . . . . . . . . . . . . . . .
68
4.1.1
Local Gaussian model . . . . . . . . . . . . . . . . . . . . .
68
4.1.2
NMF-based source variance model . . . . . . . . . . . . . . .
70
4.1.3
Estimation of the model parameters . . . . . . . . . . . . . .
71
Proposed GSSM-based multichannel approach . . . . . . . . . . . . .
72
4.2.1
GSSM construction . . . . . . . . . . . . . . . . . . . . . . .
72
4.2.2
Proposed source variance fitting criteria . . . . . . . . . . . .
73
4.2.2.1
Source variance denoising . . . . . . . . . . . . . .
73
4.2.2.2
Source variance separation . . . . . . . . . . . . .
74
4.2.3
Derivation of MU rule for updating the activation matrix . . .
75
4.2.4
Derived algorithm . . . . . . . . . . . . . . . . . . . . . . .
77
Experiment . . . . . . . . . . . . . . . . . . . . . . . . . . . . . . .
79
4.3.1
Dataset and parameter settings . . . . . . . . . . . . . . . . .
79
4.3.2
Algorithm analysis . . . . . . . . . . . . . . . . . . . . . . .
80
4.2
4.3
4.3.2.1
4.3.2.2
4.3.3
Algorithm convergence: separation results as functions of EM and MU iterations . . . . . . . . . . .
80
Separation results with different choices of λ and γ
81
Comparison with the state of the art . . . . . . . . . . . . . .
6
82
4.4
Summary . . . . . . . . . . . . . . . . . . . . . . . . . . . . . . . .
91
CONCLUSIONS AND PERSPECTIVES . . . . . . . . . . . . . . . . . . .
93
BIBLIOGRAPHY . . . . . . . . . . . . . . . . . . . . . . . . . . . . . . .
96
LIST OF PUBLICATIONS
. . . . . . . . . . . . . . . . . . . . . . . . . . 113
vii
NOTATIONS AND GLOSSARY
Standard mathematical symbols
C
Set of complex numbers
R
Set of real numbers
Z
Set of integers
E
Expectation of a random variable
Nc
Complex Gaussian distribution
Vectors and matrices
a
Scalar
a
Vector
A
Matrix
AT
Matrix transpose
AH
Matrix conjugate transposition (Hermitian conjugation)
diag(a)
Diagonal matrix with a as its diagonal
det(A)
Determinant of matrix A
tr(A)
Matrix trace
A
B
The element-wise Hadamard product of two matrices (of the same dimension)
with elements [A
B]ij = Aij Bij
.(n)
A.(n)
The matrix with entries [A]i
kak1
`1 -norm of vector
kAk1
`1 -norm of matrix
j
Indices
f
Frequency index
i
Channel index
j
Source index
n
Time frame index
t
Time sample index
8
Sizes
I
Number of channels
J
Number of sources
L
STFT filter length
F
Number of frequency bin
N
Number of time frames
K
Number of spectral basis
Mixing filters
A ∈ RI ×J ×L
Matrix of filters
aj (τ ) ∈ RI
delay
Mixing filter of j th source to all microphones, τ is the time
aij (t) ∈ R
Filter coefficient at tth time index
aij ∈ RL
Time domain filter vector
9
aij ∈ CL
b
aij (f ) ∈ C
b
f
Frequency domain filter vector
Filter coefficient at th frequency index
General parameters
x(t) ∈ RI
Time-domain mixture signal
s(t) ∈ RJ
Time-domain source signals cj
(t) ∈ RI
sj (t) ∈ R
Time-domain j th source image
Time-domain j th original source signal
x(n, f ) ∈ CI
Time-frequency domain mixture signal
s(n, f ) ∈ CJ
Time-frequency domain source signals cj
(n, f ) ∈ CI
Time-frequency domain j th source image vj
(n, f ) ∈ R
Rj (f ) ∈ C
Time-dependent variances of the j th source
Time-independent covariance matrix of the j th source
Σj (n, f ) ∈ CI ×I Covariance matrix of the j th source image
Σb x (n, f ) ∈ CI ×I Empirical mixture covariance
Σb x (n, f ) ∈ CI ×I
V ∈ R+F
×N
W ∈ R+F
×K
H ∈ R+K
×N
U ∈ R+F
×K
Empirical mixture covariance
Power spectrogram matrix
Spectral basis matrix
Time activation matrix
Generic source spectral model
10
Abbreviations
APS
Artifacts-related Perceptual Score
BSS
Blind Source Separation
DoA
Direction of Arrival
DNN
Deep Neural Network
EM
Expectation Maximization
ICA
Independent Component Analysis
IPS
Interference-related Perceptual Score
IS
Itakura-Saito
ISR
source Image to Spatial distortion Ratio
ISTFT
Inverse Short-Time Fourier Transform
IID (i.i.d)
Interchannel Intensity Difference
ITD (i.t.d)
Interchannel Time Difference
GCC-PHAT Generalized Cross Correlation Phase Transform
GMM
Gaussian Mixture Model
GSSM
Generic Source Spectral Model
KL
Kullback-Leibler
LGM
Local Gaussian Model
MAP
Maximum A Posteriori
ML
Maximum Likelihood
MU
Multiplicative Update
NMF
Non-negative Matrix Factorization
OPS
Overall Perceptual Score
PLCA
Probabilistic Latent Component Analysis
SAR
Signal to Artifacts Ratio
SDR
Signal to Distortion Ratio
SIR
Signal to Interference Ratio
SiSEC
Signal Separation Evaluation Campaign
SNMF
Spectral Non-negative Matrix Factorization
SNR
Signal to Noise Ratio
STFT
Short-Time Fourier Transform
TDOA
Time Difference of Arrival
T-F
Time-Frequency
TPS
Target-related Perceptual Score
LIST OF TABLES
2.1
Total number of different events detected from three recordings in
spring
Total number of different events detected from three recordings in
40
sum- mer
. . . . . . . . . . . . . . . . . . . . . . . . . . . . . . .
41
42
3.1
.Total
. . .number of different events detected from three recordings in
winter
List of snip songs in the SiSEC-MUS dataset. . . . . . . . . . . . . .
3.2
Source separation performance obtained on the Synthetic and SiSEC-
2.2
2.3
MUS dataset with unsupervised setting. . . . . . . . . . . . . . . . .
3.3
Speech separation performance obtained on the SiSEC-BGN.
∗
56
59
indi-
cates submissions by the authors and “-” indicates missing
information [81, 98, 100]. . . . . . . . . . . . . . . . . . . . . . . .
3.4
. . . . .separation
. .
Speech
performance obtained on the Synthetic dataset with
semi-supervised setting. . . . . . . . . . . . . . . . . . . . . . . . . .
4.1
85
Speech separation performance obtained on the SiSEC-BGN-devset Comparison with s-o-t-a methods in SiSEC. ∗ indicates submissions
by the authors and “-” indicates missing information. . . . . . . . . .
4.3
66
Speech separation performance obtained on the SiSEC-BGN-devset Comparison with closed baseline methods. . . . . . . . . . . . . . . .
4.2
60
86
Speech separation performance obtained on the test set of the SiSECBGN. ∗ indicates submissions by the authors [81]. . . . . . . . . . .
.
91
LIST OF FIGURES
1
A cocktail party effect. . . . . . . . . . . . . . . . . . . . . . . . . .
2
2
Audio source separation. . . . . . . . . . . . . . . . . . . . . . . . .
3
3
Live recording environments. . . . . . . . . . . . . . . . . . . . . . .
4
1.1
Source separation general framework. . . . . . . . . . . . . . . . . .
11
1.2
Audio source separation: a solution for cock-tail party problem. . . .
13
1.3
IID coresponding to two sources in an anechoic environment. . . . . .
19
2.1
Decomposition model of NMF [36]. . . . . . . . . . . . . . . . . . .
25
2.2
Spectral decomposition model based on NMF (K = 2) [66]. . . . . .
29
2.3
General workflow of supervised NMF-based audio source separation.
30
2.4
Image of overlapping blocks. . . . . . . . . . . . . . . . . . . . . . .
34
2.5
General workflow of the NMF-based nonstationary segment extraction. 35
2.6
Number of different events were detected by the methods from (a) the
recordings in Spring, (b) the recordings in Summer, and (c) the recordings in Winter . . . . . . . . . . . . . . . . . . . . . . . . . . . . . .
39
3.1
Proposed weakly-informed single-channel source separation approach.
45
3.2
Generic source spectral model (GSSM) construction. . . . . . . . . .
47
3.3
Estimated activation matrix H: (a) without a sparsity constraint, (b)
with a block sparsity-inducing penalty (3.5), (c) with a component
sparsity-inducing penalty (3.6), and (d) with the proposed mixed
sparsityinducing penalty (3.7). . . . . . . . . . . . . . . . . . . . . . . . . .
3.4
48
Average separation performance obtained by the proposed method with
unsupervised setting over the Synthetic dataset as a function of MU iterations. . . . . . . . . . . . . . . . . . . . . . . . . . . . . . . . . .
3.5
61
Average separation performance obtained by the proposed method with
unsupervised setting over the Synthetic dataset as a function of λ and γ. 62
3.6
Average speech separation performance obtained by the proposed methods and the state-of-the-art methods over the dev set in SiSEC-BGN. .
3.7
63
Average speech separation performance obtained by the proposed methods and the state-of-the-art methods over the test set in SiSEC-BGN. .
xii
63
4.1
General workflow of the proposed source separation approach. The
top green dashed box describes the training phase for the GSSM
construc- tion. Bottom blue boxes indicate processing steps for
source separa- tion. Green dashed boxes indicate the novelty
compared to the existing works [6, 38, 107]. . . . . . . . . . . . . .
4.2
73
.Average
. . . . separation
. . . . . . performance
. . .
obtained by the proposed method over
stereo mixtures of speech and noise as functions of EM and MU iterations. (a): speech SDR, (b): speech SIR, (c): speech SAR, (d): speech
ISR, (e): noise SDR, (f): noise SIR, (g): noise SAR, (h): noise ISR . .
4.3
81
Average separation performance obtained by the proposed method over
stereo mixtures of speech and noise as functions of λ and γ. (a): speech
SDR, (b): speech SIR, (c): speech SAR, (d): speech ISR, (e): noise
SDR, (f): noise SIR, (g): noise SAR, (h): noise ISR . . . . . . . . . .
4.4
82
Average speech separation performance obtained by the proposed methods and the closest existing algorithms in terms of the energy-based
criteria. . . . . . . . . . . . . . . . . . . . . . . . . . . . . . . . . .
4.5
88
Average speech separation performance obtained by the proposed methods and the closest existing algorithms in terms of the perceptuallybased criteria. . . . . . . . . . . . . . . . . . . . . . . . . . . . . . .
88
4.6
Average speech separation performance obtained by the proposed meth-
4.7
ods and the state-of-the-art methods in terms of the energy-based
89
criteria.
Average speech separation performance obtained by the proposed methods and the state-of-the-art methods in terms of the perceptually-based
criteria. . . . . . . . . . . . . . . . . . . . . . . . . . . . . . . . . .
4.8
89
Boxplot for the speech separation performance obtained by the proposed “GSSM + SV denoising” (P1) and “GSSM + SV separation”
(P2) methods. . . . . . . . . . . . . . . . . . . . . . . . . . . . . . .
xiii
90
INTRODUCTION
In this part, we will introduce the motivation and the problem that we focus on
throughout this thesis. Then, we emphasize on the objectives as well as scopes of
our work. In addition, our contributions in this thesis will be summarized in order to
give a clear view of the achievement. Finally, the structure of the thesis is presented
chapter by chapter.
1. Background and Motivation
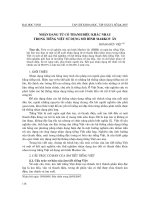
1.1. Cocktail party problem
Real-world sound scenarios are usually very complicated as they are mixtures of
many different sound sources. Fig. 1 depicts the scenario of a typical cocktail party,
where there are many people attending, many conversations going on
simultaneously and various disturbances like loud music, people screaming sounds,
and a lot of hustle- bustle. Some other similar situations also happen in daily life, for
example, in outdoor recordings, where there is interference from a variety of
environmental sounds, or in a music concert scenario, where a number of musical
instruments are played and the au- dience gets to listen to the collective sound, etc.
In such settings, what is actually heard by the ears is a mixture of various sounds that
are generated by various audio sources. The mixing process can contain many sound
reflections from walls and ceiling, which is known as the reverberation. Humans
with normal hearing ability are generally able to locate, identify, and differentiate
sound sources which are heard simultaneously so as to understand the conveyed
information. However, this task has remained extremely challenging for machines,
especially in highly noisy and reverberated environments. The cocktail party effect
described above prevents both human and machine perceiv- ing the target sound
sources [2, 12, 145], the creation of machine listening algorithms that can
automatically separate sound sources in difficult mixing conditions remains an open
problem.
1
Audio source separation aims at providing machine listeners with a similar function to the human ears by separating and extracting the signals of individual sources
from a given mixture. This technique is formally termed as blind source separation
2
(BSS) when no prior information about either the sources or the mixing condition is
available, and is described in Fig. 2. Audio source separation is also known as an
effective solution for cocktail party problem in audio signal processing community
[85, 90, 138, 143, 152]. Depending on specific application, some source separation
approaches focus on speech separation, in which the speech signal is extracted
from the mixture containing multiple background noise and other unwanted sounds.
Other methods deal with music separation, in which the singing voice and certain
instruments are recovered from the mixture or song containing multiple musical
instruments. The separated source signals may be either listened to or further
processed, giving rise to many potential applications. Speech separation is mainly
used for speech enhance- ment in hearing aids, hands-free phones, or automatic
speech recognition (ASR) in adverse conditions [11, 47, 64, 116, 129]. While music
separation has many interest- ing applications, including editing/remixing music
post-production, up-mixing, music information retrieval, rendering of stereo
recordings, and karaoke [37, 51, 106, 110].
Figure 1: A cocktail party effect1 .
Over the last couple of decades, efforts have been undertaken by the scientific
com- munity, from various backgrounds such as Signal Processing, Mathematics,
Statistics, Neural Networks, Machine Learning, etc., to build audio source
3
separation systems as described in [14, 15, 22, 43, 85, 105, 125]. The audio source
separation problem
1
Some icons of Fig. 1 are from: />
4
Figure 2: Audio source separation.
has been studied at various levels of complexity, and different approaches and
systems have come up. Despite numerous effort, the problem is not completely
solved yet as the obtained separation results are still far from perfect, especially in
challenging conditions such as moving sound sources and high reverberation.
1.2.
Basic
challenges
notations
and
target
• Overdetermined, determined, and underdetermined mixture
There are three different settings in audio source separation under the
relation- ship between the number of sources J and the number of
microphones I : In case the number of the microphones is larger than that of
the sources, J < I , the number of observable variables are more than the
unknown variables and hence it is referred to as overdetermined case. If J = I
, we have as many observable variables as unknowns, and this is a
determined case. The more dificult soure separation case is that the number
of unknowns are more than the number of observable variables, J > I , which
is called the underdetermined case.
Furthermore, if I = 1 then it is a single-channel case. If I > 1 then it is a
multi-channel case.
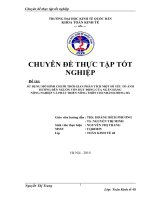
• Instantaneous, anechoic, and reverberant mixing environment
5
Apart from the mixture settings based on the relationship between the
number of sources and the number of microphones, audio source separation
algorithms can also be distinguished based on the target mixing condition they
deal with.
6
The simplest case deals with instantaneous mixtures, such as certain music
mix- tures generated by amplitude panning. In this case, there is no time
delay, a mixture at a given time is essentially a weighted sum of the source
signals at the same time instant. There are two other typical types of the live
recording environments, anechoic and reverberant, as shown in Fig. 3. In the
anechoic environments such as studio or outdoor, the microphones capture
only the direct sound propagation from a source.
With reverberant
environments such as real meeting rooms or chambers, the microphones
capture not only the direct sound but also many sound reflections from walls,
ceilings, and floors. The modeling of the reverberant environment is much
more difficult than the instantaneous and
anechoic cases.
Figure 3: Live recording environments2 .
State-of-the-art audio source separation algorithms perform quite well in instantaneous or noiseless anechoic conditions, but still far from perfect by the amount of
reverberation. These numerical performance results are clearly shown in the recent
community-based Signal Separation Evaluation Campaigns (SiSEC) [5, 99, 101, 133,
134] and others [65, 135].
That shows that addressing the separation of
reverberant mixtures, a common case in the real-world recording applications,
remains one of the key scientific challenges in the source separation community.
Moreover, when the de- sired sound is corrupted by high-level background noise,
i.e., the Signal-to-Noise Ratio (SNR) is up to 0 dB or lesser, the separation
performance is even lower.
7
2
Some icons of Fig. 3 are from: />
8