Nghiên cứu đặc điểm lâm sàng, tổn thương cơ quan đích và tình trạng kháng insulin ở bệnh nhân tăng huyết áp nguyên phát có rối loạn glucose máu lúc đói tt tiếng anh
Bạn đang xem bản rút gọn của tài liệu. Xem và tải ngay bản đầy đủ của tài liệu tại đây (305.95 KB, 27 trang )
MINISTRY OF EDUCATION & TRAINING
MINISTRY OF NATIONAL DEFENSE
108 INSTITUTE OF CLINICAL MEDICAL AND PHARMACEUTICAL SCIENCES
--------
NGUYEN THI HONG VAN
RESEARCHING CLINICAL FEATURES, SOME TARGET ORGAN
LESIONS AND TARGET INSULIN RESISTANCE IN NEW
HYPERTENSIVE PATIENTS WITH IMPAIRED FASTING
GLUCOSE
Major
: Cardiology
Code
: 62720141
SUMMARY OF DOCTORAL DISSERTATION
HA NOI - 2019
THE THESIS WAS DONE AT 108 INSTITUTE OF CLINICAL
MEDICAL AND PHARMACEUTICAL SCIENCES
Full name of supervisor:
1. Dr. VIEN VAN DOAN
2. Associate Prof. Dr. NGUYEN VAN QUYNH
Reviewer 1: Associate Prof. Dr. Nguyen Oanh Oanh
Reviewer 2: Associate Prof. Dr. Vu Bich Nga
Reviewer 3: Associate Prof. Dr. Vu Dien Bien
This thesis will be presented at Institute Council at 108 Institute of
Clinical Medical and Pharmaceutical Sciences
At
Day
Month
Year
The thesis can be found at:
1. National Library of Vietnam
2. Library of 108 Institute of Clinical Medical and
Pharmaceutical Sciences
1
BACKGROUND
Impaired fasting glucose is a new concept developed by the
American Diabetes Association in 1997 and approved by the World
Health Organization in 1998 to address "pre-diabetes" as a risk factor
of type 2 diabetes mellitus. In 2003, the American Diabetes
Association proposed lowering the threshold to 5.6 mmol/l and
impaired fasting glucose was defined when fasting glucose levels
ranged from 5.6 to 6.9 mmol/l for early detection of potential risks of
type 2 diabetes mellitus.
The rate of prediabetes is increasing rapidly, especially in
people with high cardiovascular risk factors.
Although in the pre-diabetic stage, blood glucose levels
increase slightly, it begins to cause damage to the target organs,
especially when combined with other cardiovascular risk factors such
as obesity, hypertension, etc., then the lesions appear early and more.
The glucose tolerance test has not been routinely used in cases
of impaired fasting glucose, therefore, many cases of diabetes are
missed. On the other hand, screening for target lesions in high-risk
individuals for aggressive intervention for the purpose of delaying or
minimizing complications is not concerned. Therefore, this topic is
researched for two goals:
1. Study clinical characteristics, target organ lesions, glucose
tolerance test results and insulin resistance in patients with new
hypertension associated with impaired fasting glucose.
2. Evaluate the relationship between insulin resistance and
target organ lesions in patients with new hypertension associated
with impaired fasting glucose.
2
CHAPTER 1: OVERVIEW
1.1. CONCEPTS OF INSULIN AND INSULIN RESISTANCE
1.1.1. The concept of insulin
Insulin is a hormone secreted by the pancreas β cells to maintain
blood glucose levels. Insulin regulates carbohydrate metabolism, lipid
and protein metabolism, promotes cell division and growth.
1.1.2. The concept of insulin resistance
"Insulin resistance is a decrease in the biological response of
cells, organs, and organizations to the actions of insulin." The
concept of insulin resistance refers to the decline in the biological
response of insulin on the target cells, which is usually expressed by
an increase in insulin levels in the blood.
1.1.3. Methods to determine insulin resistance
Endogenous methods
- Basic fasting insulin measurement: (I0).
- Oral glucose tolerance test: quantifies concentration of
glucose and fasting plasma insulin (G0, I0), after 75 g of glucose
intake for 5-10 minutes. After 120 minutes, blood is taken again to
measure the concentration of glucose and insulin (G120, I120).
Exogenous methods
- The glucose “clamp”: This method is considered to be the
most accurate or "gold standard". Glucose level is "clamped" or fixed
at a certain level while evaluating the secretion of insulin.
If the patient needs a large amount of glucose to maintain
normal blood glucose levels, then it is not insulin resistant.
Some indicators of insulin resistance
- Index HOMA-IR (Homeostasis Model Assessment Insulin
Resistance):
3
HOMA- IR =
- QUICKI index: Quantitative Insulin Sensitivity Check Index.
QUICKI = 1 / log (I 0 + G 0 )
- ß cell function Homeostasis Model Assessment based on
Matthew D.
+ HOMA -% ß =
1.1.4. The pathology and clinical syndrome associated with
insulin resistance
1.4.1.1 The role of insulin resistance in type 2 diabetes
Insulin resistance is a prerequisite in glucose metabolism
disorder. Forms of insulin resistance are also abundant including:
decreased ability to inhibit glucose production in the liver, reduced
ability of glucose uptake in peripheral tissues and reduced ability to
use glucose in organs. The early phase of insulin secretion is reduced
in both impaired fasting glucose and glucose tolerance disorders. In
the late phase of insulin secretion, people with impaired fasting
glucose are normal while glucose tolerance disorder are reduced.
Impaired fasting glucose
In 2003, the American Diabetes Association proposed
lowering the threshold to 5.6 mmol/l (100/mg/dl) and impaired
fasting glucose is determined when fasting plasma glucose level
from 5.6 to 6.9 mmol/l. This standard is widely applied today.
Glucose tolerance disorder
Glucose tolerance disorder is a concept adopted by the World
Health Organization in 1980 for use in pre-diabetes and the
regulation of oral glucose tolerance testing for diagnosing and
quantifying fasting plasma glucose level, followed by 75 g of
glucose dissolved in 250 - 300 ml of drinking water within 5 - 15
4
minutes. After 120 minutes, blood is taken again to quantify glucose
level to evaluate results.
- Glucose level after 2 hour glucose tolerance testing is <7.8
mmol/l: normal glucose tolerance.
- If the glucose level after 2 hour glucose tolerance testing is
7.8 - 11 mmol/l: glucose tolerance disorder.
- If the glucose level after 2 hour glucose tolerance testing is ≥
11.1 mmol/l: diabetes.
1.1.4.2. The role of insulin resistance and hypertension
The relationship between insulin resistance in hypertension is still a
challenge for scientists. Coexistence of insulin resistance and hypertension
can be seen in the causal relationship (insulin resistance causes hypertension
and vice versa) or the independent relationship of the same metabolic
disorder (cumulative calcium accumulation) due to changes in
phosphorylation of glucose transporters and other intracellular substrates.
Studies also report that free Ca ++ levels in the plasma of patients with
hypertension are higher than in those with normal blood pressure, and that
Ca ++ levels are closely related not only to blood pressure but also to
increased blood insulin. Or, insulin resistance is a genetic marker in the
pathogenesis of various metabolic abnormalities commonly associated with
hypertension. Treatment by long-term insulin injections does not cause
hypertension and hyperinsulinemia patients due to pancreatic islet beta
cells are not reported with hypertension.
1.2. TARGET ORGAN LESIONS IN HYPERTENSIONS WITH
IMPAIRED FASTING GLUCOSE
1.2.1. Endothelial dysfunctions
Endothelial dysfunction includes the alteration of
anticoagulants and anti-inflammatory agents in endothelial cells,
defects in the regulation of vascular growth factors, prevention of
vascular recovery, reduction of NO production and other vasodilators
(endothelin-1, thromboxane A2, and angiotensin II). Under basic
conditions, the biological effect of NO in the body plays a role in
lowering blood pressure due to vasodilatation. Endothelial cells also
release acetylcholine, P, serotonin, prostacyclin, etc.
5
1.2.2. Lesions of large blood vessel system
Hypertrophy of myocardial cells, restoration of cardiac
muscle, left ventricular dysfunction, heart failure
Myocardial ischemia, acute coronary syndrome.
Lesions of cerebral vascular system
lesions of aortic system, lower limb artery
1.2.3. Lesions of small blood vessels
Renal failure: Structural and renal dysfunction are almost
present in hypertensive patients with features of arterial injury to
glomerular, but are not specific because they are found in renal
vascular diseases. The artery wall thickening occurs first, followed
by hyaluronation, medial fibrosis in coming arteries and arteries in
the glomerulus. Hypertension causes kidney damage includes two
forms: malignant and benign kidney disease.
Eye lesions: Self-regulation of blood flow helps to stabilize
blood flow to organizations even when there is a change in flow
pressure. When the blood pressure rises or falls, the arteries will
contract or relax to adjust the flow. However, this self-regulation
becomes less effective when blood pressure exceeds the threshold
because the contraction and relaxation of the arterioles are to a
certain degree.
CHAPTER 2
RESEARCH OBJECTS AND METHODS
2.1. RESEARCH SUBJECTS
The study was conducted from October 2011 to October 2014
at Bach Mai Hospital Clinic on 472 objects who met the selection
criteria and exclusion criteria , divided into 3 groups:
2.1.1. Group of diseases
Criteria for selecting patients
The study group consisted of 218 people with primary
hypertension first discovered with BP> 140/90 mmHg and with
impaired fasting glucose according to standards of American
Diabetes Association 2003 when the fasting plasma glucose level
was 5, 6 mmol/L - 6.9 mmol/L.
* Exclusion criteria
Patients with a history of hypertension, diabetes or
hypoglycemic agents, acute pathological conditions: Myocardial
6
infarction, unstable angina, acute stroke, etc., Patients who were or are
under treatment for chronic diseases such as renal failure, severe liver
failure, etc. patients taking certain drugs that affect test results such as
glucocorticoid group, thiazide diuretics, lipid lowering drugs.
2.1.2. Group of pathological symptoms
* Criteria for selecting patients
The study population consisted of 119 people with primary
hypertension first discovered with BP> 140/90 mmHg and with
fasting plasma glucose of < 5.6mol/L. Exclusion criteria are the same
as the exclusion criteria in the preceding group.
2.1.3. Control group:
The control group included 55 people of the same age who
were healthy, without hypertension, with fasting plasma glucose <5.6
mmol/L and the same exclusion criteria as the exclusion criteria in
the upper group. Control group is used to find out limit index.
2.2. RESEARCH METHODOLOGY
Cross-sectional method, descriptive method, controlled study
method
2.2.1. History: Family history, smoking habits, alcohol use, physical
activity, concomitant diseases, drugs used.
2.2.2. Physical examination: Measurement of height, weight, waist
circumference, hip circumference, BMI, blood pressure
measurement, ophthalmology and ophthalmoscopy.
2.2.5. Biochemical Tests - Functional Probe:
* Blood glucose, blood insulin, blood lipids, oral glucose
tolerance test, urine test.
* Calculation of glucose tolerance disorder and insulin
resistance indices: Fasting plasma glucose (G0) at 120 minutes after
glucose tolerance test (G120); fasting insulin level (I0) and at 120
minutes after glucose tolerance test (I120); HOMA-IR, QUICKI.
* Evaluate cell functions by the formula:
HOMA - = 20 x I0/(G0 - 3,5)
* Heart Doppler ultrasound
2.3. RESEARCH DATA PROCESSING : SPSS for windows.
7
CHAPTER 3
RESEARCH FINDINGS
3.1. CLINICAL CHARACTERISTICS, TARGET ORGAN
LESIONS, GLUCOSE TOLERANCE TESTS, INSULIN
RESISTANCE OF RESEARCH OBJECTS
3.1.1. Clinical characteristics
Table 3.2. Characteristics of age groups
Group of
Group of
pathological
Age
diseases
symptoms
distribution
p
(n = 218)
(n = 199)
5-10%/year
n
%
n
%
<50
10
5,0
8
3,7
p>0,05
50-59
40
20,1
55
25,2
p>0,05
60-69
95
47,8
106
48,6
p>0,05
≥70
54
27,1
49
22,5
p>0,05
The average age
63,9 ± 8,2
63,5 ± 7,9
p>0,05
Comment:
The mean age of respondents was 63 years. Age group 60-69
was the highest in both groups, (p> 0,05).
Table 3.4. Anthropometric characteristics between the two research groups
Group of
Group of
pathological
diseases
symptoms
Parameter
p
(n = 218)
(n = 199)
n
%
n
%
Average BMI
22,68 ± 2,25
23,07 ± 2,23
p>0,05
BMI <18.5
5
2,5%
3
1,4%
p>0,05
BMI: 18.5 - 22.9
108
54,3%
111
50,9% p>0,05
BMI: 23 - 24.9
63
31,7%
68
31,2% p>0,05
BMI: 25-29.9
21
10,6%
35
16,1% p>0,05
BMI ≥ 30
2
1%
1
0,5%
p>0,05
Average WHR
0.89 ± 0.05
0.91 ± 0.04
p <0.05
↑ WHR
139
6-8
181
83% p <0.05
8
Comment:
The mean WHR in group of disease is higher than that in group
of pathological symptoms (p <0.05).
The proportion of patients with increased WHR is 83% in the
group of disease and 69.8% in Group of pathological symptoms (p
<0.05).
Table 3.9. Rate of left ventricular hypertrophy between the two
Parameter
Increased LVMI
RWT ≥ 0.42
study groups
Group of
pathological
symptoms
(n = 199)
n
%
64
32,2
46
23,1
Group of
diseases
(n = 218)
n
83
51
%
38,1
23,4
p
p>0,05
p>0,05
Comment:
The proportion of increased LVMI in group of disease is
higher than that in group of pathological symptoms (p>0,050).
Table 3.10. Classification of kidney lesions between two study groups
Group of
Group of
pathological
diseases
symptoms
Parameter
p
(n = 218)
(n = 199)
n
%
n
%
MAU (-)
181
91
169
77,5
MAU (+)
18
9
49
22,5
average eGFR
80,00 ± 23,51
77,45 ± 16,34
p> 0.05
Average ACR
13,74 ± 15,13
22,99 ± 21,81
p <0.01
p <0.01
Comment: MAU (+) in group of disease is higher than MAU (+)
group of pathological symptoms, (p <0.01)
9
Table 3.13. Classification of eyeground lesions between the two groups
Group of
Group of
pathological
diseases
Classification of
symptoms
p
(n = 218)
eyeground lesions
(n = 199)
Not lesions
n
99
%
49,8
n
76
%
34,8
p<0,05
Grade I: Hard
51
25,6
64
29,4
p>0,05
Grade II: Salus günn (+)
46
23,1
55
25,2
p>0,05
3
1,5
20
9,2
p<0,01
0
0
3
1,4
-
Grade III: Hemorrhage
- discharge
Grade IV: papilloedema
Comments: The rate of grade III lesions was 9.2% in the group of
disease and 1.5% in group of pathological symptoms (p <0.01).
3.1.3. Results of oral glucose tolerance test of the group of disease
Table 3.15. Results of oral glucose tolerance test of the group of disease
Results
N
Ratio (%)
Normal
Impaired
glucose
glucose
Diabetes
Total
tolerance
107
tolerance
67
44
218
49,1
30,7
20,2
100
Comment: In the group of disease, diabetes accounts for 20.2%.
10
3.1.4. Insulin resistance status in the study groups
Table 3.18 Levels of blood glucose and blood insulin at intervals
between subgroups
Parameter
Normal
Impaired
glucose
glucose
Diabetes (3)
tolerance (1)
tolerance (2)
(n = 44)
(n = 107)
(n = 67)
p
p 12 > 0.05
G 0 (mmol / l)
5,97 ± 0,31
6,04 ± 0,33
6,27 ± 0,42
13
p <0.01
p 23 <0.01
p 12 > 0.05
I 0 ( Um / l)
12,23 ± 11,42
10,55 ± 6,64
18,98 ± 16,00
13
p <0.01
p 23 <0.01
p 12 <0.01
G 120 (mmol / l)
6,94 ± 0,60
9,45 ± 0,95
13,00 ± 1,96
13
p <0.01
p 23 <0.01
p 12 <0.01
I 120 ( Um / l) 67,32 ± 51,42 76,79 ± 48,52
125,79 ±
110,44
13
p <0.01
p 23 <0.01
Comment:
G0, I0, G120 , I120 are the highest in the diabetic subgroup (p <0.01).
11
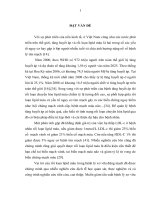
Table 1.1. Evaluation of insulin resistance and beta cell function of
the study groups
Control group
Normal
Group of
Parameter control group pathological
(1)
symptoms (2)
(n = 55)
(n = 199)
Group of
diseases (3)
(n = 218)
p
p 12 > 0.05
1,40±0,60
1,54±1,00
3,54±3,23
p <0.01
p 23 <0.01
p 12 > 0.05
13
HOMA - β 136,68±141,17 138,19±156,77 102,96±92,82 p <0.01
p 23 <0.01
p 12 > 0.05
13
0,97±0,09
0,96±0,11
0,83±0,12
QUICKI
p <0.01
p 23 <0.01
Comment:
Insulin resistance under HOMA - IR is the highest in group of
disease (p <0.01).
HOMA
IR
-
13
Table 3.24. The rate of insulin resistance according to HOMA - IR
between subgroups of group of disease
Group of diseases
(n = 218)
Normal
Impaired
Parameter
glucose
glucose
Diabetes (3)
p
(1)
(2)
tolerance
tolerance
(n = 44)
(n = 107)
(n = 67)
n
%
n
%
n
%
HOMA - IR
Insulin
62
57,9 41 61,2
35
79,5 12
p > 0.05
resistance
p 13 <0.05
No HOMA p 23 <0.05
IR Insulin
45
42,1 26 38,8
9
20,5
resistance
12
Comment: HOMA - IR insulin resistance is the highest in the
diabetic subgroup (p <0.05).
3.2. RELATIONSHIP BETWEEN INSULIN RESISTANCE
AND LESIONS OF SOME TARGET ORGANS
3.2.1. The relationship between insulin resistance and some
cardiovascular events
Table 3.28. Risk of heart damage with insulin resistance (HOMA IR) through multivariate analysis
Element
Increased
LVMI
n
%
Normal
LVMI
n
%
OR
95%
confidence
interval
Gender
Female
46 35,1 85
64,9
1
0,629-5,636
Male
37 42,5 50
57,5 1,883
Age group
<50 years old
1
12,5
7
87,5
1
50 - 59 years old 13 23,6
42
76,4 2,609 0,280 - 24,331
60 - 69 years old 45 42,5
61
57,5 6,829 0,772 - 60,402
≥70 years old
24 49,0
25
51,0 6,898 0,751 - 63,351
HOMA - IR Insulin resistance
With resistance 63 45,7
75
54,3 2,717 1,397 - 5,284
No resistance 20 25,0
60
75,0
1
History of smoking
Yes
24 44,4
30
55,6 0,785 0,295 - 2,088
No
59 36,0 105 64,0
1
History of drinking
Yes
27 43,5
35
56,5 1,148 0,395- 3,335
No
56 35,9 100 64,1
1
Increased waist circumference
Yes
55 41,0
79
59,0 1,665 0,825 - 3,359
No
28 33,3
56
66,7
1
Glucose concentrations after glucose tolerance test
G120 <7.8
43 40,2
64
59,8
1
7,8
65,7 0,735 0,365 - 1,482
G120 ≥11.1
17 38,6
27
61,4 0,652 0,291 - 1,463
Grade of hypertension
Hypertension grade
P
p>0,05
p>0,05
p>0,05
p>0,05
p<0,01
p>0,05
p>0,05
p>0,05
p>0,05
p>0,05
13
I
57
Hypertension grade 22
II
4
Hypertension grade
III
37,3
36,7
80,0
96
38
1
62,7
63,3
20,0
1
0,763
7,360
0,389 - 1,495 p>0,05
0,654 p>0,05
82,859
Comment: The risk of increased LVMI in the HOMA - IR insulin
resistance group increases by 2.717 (1,397 - 5,284).
3.2.2. Relationship with kidney injury
Table 3.32. Kidney injury with HOMA - IR insulin resistance
Element
Gender
Female
Male
through Binary logistic regression analysis
MAU (+) MAU (-)
95%
OR confidence
n %
n
%
interval
32 24,4
17 19,5
Age group
<50 years old
2 25,0
50 - 59 years 16 29,1
old
21 19,6
60 - 69 years 10 20,8
old
≥70 years old
99
70
75,6
1
80,5 0,767
6
39
86
38
75,0
1
70,9 1,934
80,4 0,712
79,2 0,816
HOMA - IR Insulin resistance
38 27,5 100
With resistance
No resistance
11 13,8 69
Family history
Yes
17 20,7 65
No
32 23,5 104
History of smoking
Yes
9 16,7 45
No
40 24,4 124
72,5 2,307
86,2
p
0,196 3,006
p>0,05
0,306 12,240
0,105 4,812
0,115 5,794
p>0,05
p>0,05
p>0,05
1,014 5,250
p<0,05
1
79,3 0,523
76,5
1
0,221 1,240
p>0,05
83,3 0,475
75,6
1
0,143 1,574
p>0,05
14
History of drinking
Yes
13 21,0 49 79,0 1,552
0,392 No
36 23,1 120 76,9
1
6,144
Little exercise
Yes
24 22,2 84 77,8 0,714 0,344-1,481
No,
little 25 22,7 85 77,3
1
exercise
Glucose concentrations after glucose tolerance test
G 120 <7.8
16 15,0 91 85,0
1
7,8
2,635
11.1
2,062 11,975
p>0,05
p>0,05
p>0,05
p<0,01
Comment:
The logistic multivariate regression analysis shows that the
risk of MAU (+) in the HOMA - IR insulin resistance group is 2.307
times higher than that of the non - insulin resistant OR group: 2,307
(95% CI: 1,014 - 5,250).
CHAPTER 4
DISCUSSIONS
4.1.CLINICAL FEATURES, LESIONS OF SOME TARGET
ORGANS, RESULTS OF GLUCOSE TOLERANCE TEST,
INSULIN RESISTANCE OF STUDY GROUPS
4.1.1. Clinical characteristics of the study groups
Characteristics of age
According to the study in Table 3.2 conducted on patients
with an average age of 63.5 ± 7.9, the higher the age is, the
higher the risk of glucose metabolism disorders are.
Gender characteristics
15
The proportion of female patients is 60.1% higher than
that of male patients (39.9%), the difference is not statistically
significant (p> 0,05).
* Characteristics of anthropometry: BMI and WHR
Obesity is now considered to be central to the metabolic
syndrome closely related to insulin resistance. The rate of
obesity is 16.1 % in group of disease and 10.6% in group of
pathological symptoms (p> 0.05).
The WHR (waist circumference) in group of disease is
83%, statistically significant higher than that in group of
pathological symptoms (69.8%), the difference is statistically
significant (p <0, 05).
Thus, it can be seen that Vietnamese people's BMI is not
high, but the proportion of people showing fatty abdomen (large
waist) accounts for a significant one.
* Heart
In our study, the rate of increased LVMI in group of
disease is 38.1% while the rate of increased LVMI in group of
pathological symptoms is 32.2% (p> 0.05) (Table 3.8). For the
analysis in Table 3.10, it is found that the rate of increased LVMI is
different in the subgroups of the disease groups, but the difference is
not statistically significant (p> 0.05).
The rate of Concentric left ventricular hypertrophy is 23.4% in
the group of disease and 23.1% in the group of pathological
symptoms, the difference is not statistically significant (p > 0.05)
(Table 3.8).
Kidney
16
Microalbuminuria is considered to be the best indicator of
endothelial dysfunction that is an early indication for kidney damage.
The results in Table 3.10 show that MAU (+) in the group of
disease is 22.5%, significantly higher than the MAU (+) in the group
of pathological symptoms of 9%, the difference was statistically
significant (p <0.01).
The difference in the frequency of microalbuminuria (+) in our
study and in other studies is due to the choice of subjects, qualitative and
quantitative methods of albuminuria assessment and different criteria of
microalbuminuria. 24 hour urine sampling is an ideal method for
evaluating albumin in urine. However, this technique is difficult to
perform for most patients in the outpatient clinical study. Randomized
morning sampling to calculate albumin and creatinine of the same urine
sample is the most convenient way to be widely used in clinical trials. In
this study, this method is also applied. On the other hand, subjects of
this study are hypertensive patients with impaired fasting glucose, so the
rate of microalbuminuria is also lower than that of patients with
hypertension associated with diabetes.
Table 3.22 shows that the highest MAU (+) in the subgroup of
diabetes is 45.5%, followed by the impaired glucose tolerance
subgroup of 19.4% and the lowest in the normal glucose tolerance
subgroup of 16%, the difference is statistically significant (p <0.01).
It is possible to see that the higher the rate of impaired glucose
is, the greater the rate of microalbuminuria (+)
At eyes:
Many studies show that even in pre-diabetic stage, although
blood glucose levels are not high, patients have retinal damage.
According to the results in Table 3.32, in the group of
diseases, rate of grade I eyeground injury is 29.4 %, rate of grade II
17
eyeground injury is 25.2%, rate of grade I and grade II eyeground
injury in group of pathological symptoms is 25.6% and 23.1%,
respectively, and the difference is not statistically significant (p>
0.05). Grade III eye injury: bleeding, discharge in research group is
9,2 %, much higher than corresponding rate of eyeground injury in
pathological symptoms of 1.5%. The difference is statistically
significant (p <0.01). The rate of patients grade IV eyeground injury
in the research group is 1,4%. In the study, no case of grade IV
eyeground injury is reported.
When evaluating eye injury in hypertensive patients, Nguyen
Dieu Linh noted that the rate of grade I, II, III, IV eyeground injury
was 59%, 27%, 9%, 5%, respectively The higher blood pressure
number is, the more eyeground injury and target organ lesions are
and good management of blood pressure number is related to
changes in eyeground injury.
4.1.2. Results of glucose tolerance test in hypertensive
patients with impaired fasting glucose
The results in Table 3.15 show that the proportion of
people with normal glucose tolerance is 49.1 %, the rate of
impaired glucose tolerance is 30.7% and the diabetes rate is
20.2%. So, if glucose tolerance test is not used, up to 20,2% of
patients with undiagnosed diabetes.
The difference in the rate of diabetes between this study
and other studies is due to the selection of the population and the
criteria used for the diagnosis of impaired fasting glucose. In
previous studies, authors mainly used the old diagnostic criteria,
but in our study, new standards of the American Diabetes
Association, 2003 are applied. The use of the new standards will
18
help to detect early, have more aggressive prevention of early
onset of adverse events.
4.1.3. Insulin resistance status in the study groups
* Average blood glucose levels at times
Insulin resistance is indicated by a number of indicators in
which the most obvious manifestation is increased insulin levels
and fasting glucose levels because insulin resistance in the liver
increases liver's glucose production, while increased glucose
levels after 120 minutes glucose tolerance test is mainly due to
insulin resistance in muscle tissues and fatty tissues.
In the subgroup of the group of disease (Table 3.17), the
research findings show that G 0 and G120 have the highest mean values
in the diabetic subgroup, average values in glucose tolerance subgroup
and the lowest values in the normal glucose tolerance subgroup. When
evaluating the correlation between glucose levels at different times
(Table 3.21), it found a strong correlation between G0 and G120 (r =
0.365; p = 0.0001). The higher the G0 concentration is, the higher the
G120 concentration is.
* Evaluation of insulin resistance by HOMA-IR, QUICKI
There are different methods and indicators to evaluate
insulin resistance in which "glucose clamp" test is the most
accurate method or is considered "gold standard”. In practice,
indirect methods such as Homeostasis Model Assessment
(HOMA) are used to diagnose insulin resistance.
The results in Table 3.19 show that the mean HOMA - IR
score for the group of disease is 3.54 ± 3.23, higher than the
mean HOMA - IR score in the group of pathological symptoms
is 1.54 ± 1.00 (p <0.01).
19
According to results in Table 3.20, the median HOMA -IR
score is the highest in the diabetic subgroup, mean in the normal
glucose tolerance subgroup and the lowest in the subgroup of
impaired glucose tolerance (p <0.01). The mean QUICKI index
is the lowest in the diabetic subgroup, mean in the glucose
tolerance subgroup and the highest in the normal glucose
tolerance subgroup (p <0.01 ).
- According to the results in Table 3.21, the proportion of
insulin resistance by the HOMA - IR index and insulin
resistance by QUICKI index of the study groups, it is higher in
group of disease than that of the control group, the difference is
statistically significant (p <0.01).
- HOMA-IR insulin resistance and QUICKI insulin
resistance are highest in the subgroup diagnosed with diabetes
4.2. RELATIONSHIP BETWEEN INSULIN RESISTANCE
AND TARGET ORGAN LESIONS IN RESEARCH
GROUPS
4.2.1. The relationship between insulin resistance and some
cardiovascular damage
A study by Henry P. found that the risk of cardiovascular
mortality in people with impaired fasting glucose was 2.97 times
higher than that in those with normal fasting glucose tolerance,
OR: 2.97 (95% CI: 1, 58 - 5,55). Also in the study by Francisco
FJ found those with fasting glucose disorders or glucose
intolerance and insulin resistance increases the risk of
cardiovascular complications.
- The results of the logistic mutivariate regression analysis in
Table 3.87 show that the risk of increased LVMI in the HOMA-IR
20
insulin resistance group is 2.717 times higher than that of the noninsulin resistance group: 2,717 (95% CI: 1.397 - 5,284).
Thus, there is a statistically significant association
between HOMA - IR or QUICKI insulin resistance with cardiac
damage in hypertensive group with impaired fasting glucose
compared to that in non-insulin resistance.
Our research is similar to that of other authors.
4.2.2. The relationship between insulin resistance and some
kidney injuries
Microalbuminuria is considered to be the best indicator of
endothelial dysfunction and an early indication for kidney
damage. Microalbuminuria is also a risk factor for morbidity and
mortality from cardiovascular diseases in both diabetic and nondiabetic patients, and is a predictor of renal failure in the future.
Mennno TP's study on 1,255 hypertensive people found
that the proportion of microalbuminuria in people aged 55-64
accounted for 23.6%. Jianzhong Xiao et al studied over 6,092
Chinese people have impaired glucose tolerance, the rate of
microalbuminuria (+) in men and women respectively was
32.6% and 34.3%.
The results of multivariate logistic analysis in Table 3.21
show that the risk of MAU lesions in patients with HOMA-IR
insulin resistance is 2.307 times greater than that of non-insulin
resistance group OR: 2,307 95% CI: 1.014-5.250). The incidence of
MAU (+) in patients with diabetes is 4,969 times higher than in the
normal glucose tolerance subgroup: 4,969 (95% CI: 2,062-11,975).
21
Our results are similar to the results of study of Marín R et
al., on 10,320 hypertensive patients, the MAU (+) is
proportional to blood glucose level: in the normal blood glucose
group, albuminuria accounts for 39.4%, in impaired fasting
glucose group, it accounts for 48.3% and in the diabetic group, it
is 65.6% (p <0.01). The rate of urinary albumin excretion
between the impaired fasting glucose group and the normal
glucose group is statistically significant: 1.74 (95% CI: 1.082.80). Studies have documented that nearly half of hypertensive
patients with impaired fasting glucose have elevated
microalbuminuria, increased the incidence of cardiovascular
events and renal failure compared with those without impaired
fasting glucose.
CONCLUSION
After studying 472 people in which 218 people of disease
group have hypertension and impaired fasting glucose, 199 of
pathological symptom group have hypertension without impaired
fasting glucose and 55 healthy people in control group, the
conclusions are made as the following:
1. Clinical features, some target organ lesions, results of glucose
tolerance test, and target insulin resistance in new hypertensive
patients with impaired fasting glucose.
Clinical features:
- Age: mean age of 63,5. The proportion of women is higher
than that of men (p> 0.05).
22
- BMI is mostly normal, but abdominal obesity accounts
for 83%.
Some target organ lesions
- Cardiovascular: left ventricular hypertrophy and
concentric hypertrophy are higher than those in pathological
symptom group, with no difference between the subgroups of the
disease group (p> 0.05).
- Kidney: The rate of MAU (+) disease group is higher
than that in the pathological symptom group, the highest in the
diabetic subgroup and lowest in subgroup of normal glucose
tolerance (p <0.01).
- Eyes: the rate of eyeground injury in disease group is
higher than that in pathological symptom group, the highest in the
diabetic subgroup and the lowest in the normal glucose tolerance
subgroup (p <0.01).
Results of glucose tolerance test:
- The rate of impaired glucose tolerance is 30.7% and the rate
of diabetes is 20.2%.
Insulin resistance:
The rate of HOMA-IR insulin resistance and QUICKI insulin
resistance for the disease group is 63.3% and 62.4%, respectively,
the highest in the diabetic subgroup and lowest in normal glucose
tolerance subgroup(p <0.05).
2. Relationship between insulin resistance and some target organ
lesions in new hypertensive patients with impaired fasting
glucose:
23
- Results of logistic multivariate regression analysis show that
the risk increased LVMI in those with HOMA - IR insulin resistance
increased 2,717 times compared with no insulin resistance OR: 2.717
(95% CI: 1.397 to 5.284). Similarly, the risk of increased LVMI in
the QUICKI insulin resistance increased 2.623 times compared to the
non-insulin resistance OR: 2.623 (95% CI: 1.379 - 4.989).
- Results of logistic multivariate regression analysis show that
the risk of MAU (+) in the group with HOMA - IR insulin resistance
increased 2,307 times compared to no insulin resistance OR: 2.307
(95% CI: 1.014 to 5.250 ). Similarly, risk of MAU (+) in the
QUICKI insulin resistance increased 2,389 times higher compared to
no insulin resistance OR: 2.389 (95% CI: 1.058 to 5.396). The rate of
MAU (+) in patients in the diabetic subgroup is 5.038 times higher
than that in the normal glucose tolerance subgroup: 5,038 (95% CI:
2,089-12,152).
- The results of logistic multivariate regression analysis
indicate that the risk of haemorrhagic injury, discharge in patients
with HOMA - IR insulin resistance is 4,057 times higher than those
without insulin resistance OR: 4.057 (95% CI: 1.124 - 14.468).
Similarly, the risk of haemorrhagic injury in patients with QUICKI
nsulin resistance is 4.032 times higher than that in those without
insulin resistance: 4,232 (95% CI: 1.173 - 15.262).