Nghiên cứu sự biến đổi đặc trưng, tính chất và hình thái cấu trúc của polyethylene tỷ trọng cao trong quá trình thử nghiệm tự nhiên tại bắc trung bộ tt tiến anh
Bạn đang xem bản rút gọn của tài liệu. Xem và tải ngay bản đầy đủ của tài liệu tại đây (1.64 MB, 28 trang )
MINISTY OF EDUCATION ANH TRAINING
VINH UNIVERSITY
**********
LE DUC MINH
STUDY ON THE CHANGE IN CHARACTERISTICS, PROPERTIES AND
MORPHOLOGY OF HIGH DENSITY POLYETHYLENE EXPOSED
NATURALLY IN NORTH CENTRAL
SUMMARY OF CHEMISTRY DISSERTATION
Sepcialization:
Organic chemistry
Code:
9.44.01.14
NGHE AN - 2018
The present study has been completed at:
Department of Physico – Chemistry of non - metallic materials
Institute for tropical technology – Vietnam Academy of Science and
Technology and Specialized Lab Organic Chemistry - Faculty of Chemistry Vinh University
Supervisors:
Prof. Dr. Thai Hoang
Assoc. Prof. Dr. Le Duc Giang
Reviewer 1: ....................................................................................................
Reviewer 2: ....................................................................................................
Reviewer 3: ....................................................................................................
Thesis will be presented and protected at school-level thesis vealuating
Council at: Vinh University, 182 Le Duan, Vinh City, Nghe An Province
Dissertation is stored in:
National libarary of Vietnam
Nguyen Thuc Hao Library and Information Center of Vinh University
PUBLISHED WORKS
1. Le Duc Minh, Nguyen Thuy Chinh, Nguyen Thi Thu Trang, Nguyen Vu
Giang, Tran Huu Trung, Mai Duc Huynh, Tran Thi Mai, Le Duc Giang, Thai Hoang
(2016), Study on change of some characters and morphology of polyethylene
compound exposed naturally in Dong Hoi-Quang Binh, Vietnam Journal of
Chemistry, 54(2), 153-159.
2. Le Duc Minh, Nguyen Thuy Chinh, Nguyen Vu Giang, Tong Cam Le, Dau
Thi Kim Quyen, Le Duc Giang, Thai Hoang (2017), Study on change of color and
some properties of high density polyethylene/organo-modified calcium carbonate
composites exposed naturally at Dong Hoi-Quang Binh, Vietnam Journal of
Chemistry, 55(4), 417-423.
3. Le Duc Minh, Nguyen Thuy Chinh, Le Duc Giang, Tong Cam Le, Dau Thi
Kim Quyen, Thai Hoang (2018), Prediction of service half-life time of high density
polyethylene/organo-modified calcium carbonate composite exposed naturally at
Dong Hoi – Quang Binh, Vietnam Journal of Chemistry 56(6), pp. 767-772.
4. Le Duc Minh, Nguyen Thuy Chinh, Nguyen Vu Giang, Le Duc Giang,
Tong Thi Cam Le, Dau Thi Kim Quyen, Tran Huu Trung, Mai Duc Huynh, Thai
Hoang (2017), Study on the change in characteristics and morphology of high density
polyethylene/organo-modified calcium carbonate composites exposed naturally at
Dong Hoi – Quang Binh, Asian Workshop on Polymer Processing 2017, Hanoi
University of Science and Technology, Program & Proceedings book, 154-159.
5. Le Duc Minh, Nguyen Thuy Chinh, Le Duc Giang, Tong Thi Cam Le, Dau
Thi Kim Quyen, Thai Hoang (2019), Study on the change in characteristics and
prediction of service half-life time of high density polyethylene/organo-modified
calcium carbonate composite exposed naturally at Dong Hoi – Quang Binh, Journal
Chemical industry (accepted).
1
INTRODUCTION
1. Preamble
High density polyethylene (HDPE) is the typical polymer hydrocarbon of
thermoplastic and is widely used in technical and life. Under different methods,
HDPE is applied in the manufacture of food containers, covers for electric wires and
cables, communication cables, hard tubes, twisted pipes for construction,
architecture, electricity, telecommunication, etc.
In the process of use, especially in the outdoors, polymers in general and HDPE,
PE composites in particular are always affected by sunlight and other environmental
factors. Oxidation reactions occurring when polymer is illuminated play an important
role in polymer aging and affect the lifetime of HDPE.
The results of research on the photo-oxidation process of HDPE under the
influence of sunlight in some parts of the world show that the mobility of HDPE
macromolecular is changed, HDPE circuit is broken, the mechanical properties are
greatly reduced over time.
In Vietnam, the study on the changes in properties and morphology of PE, PVC
and rubber under natural exposure has been conducted in Hanoi, Quang Ninh, Da
Nang and Ho Chi Minh City following different times. However, natural exposure of
HDPE with additive CaCO3 modified with steatic acid has not been conducted in
Dong Hoi (Quang Binh), which is one of the locations showing the typical climate of
the North Central region. With average rainfall and number of rainy days are small in
the year, meanwhile, relative humidity and average annual temperature are large,
Dong Hoi (Quang Binh) has quite a harsh natural conditions. Therefore, the process
of thermal oxidation degradation, photodegradation, photo-oxidation degradation,
ozone degradation for polymer composites may occur more strongly than other parts
in our country. In addition, there has not been any study in Vietnam that conducts
both natural exposure and accelerated weather testing for HDPE/m-CaCO3 composite
to compare the change of characteristics (infrared spectra, ultraviolet-visible spectra,
nuclear magnetic resonance, molecular weight of products formed when HDPE was
degraded, crystallinity percentage, etc.), mechanical properties, thermal properties,
durability heat and morphology of HDPE. Thus, no correlation coefficient has been
determined between natural exposure and accelerated weather testing of HDPE as
well as the lifetime prediction of this polymer.
From the research results in the country as well as the world, we found the study
on changes in characteristics, properties, morphology, determining the lifetime of
composites based on HDPE natural exposure in Dong Hoi (Quang Binh) combined
with accelerated weather testing is very necessary, with both scientific and practical
meaning. Therefore, researcher has chosen to implement the thesis with the topic:
“Study on the change in characteristics, properties and morphology of high
density polyethylene exposed naturally in North Central”.
2
2. Objects
The research object of the thesis is the high density polyethylene/organomodified calcium carbonate composites exposed naturally at Dong Hoi City, Quang
Binh province.
3. Tasks
- The natural exposure the HDPE/m-CaCO3 composites was conducted at Dong
Hoi City, Quang Binh province; The accelerated weather testing the HDPE/m-CaCO3
composites was carried out in a UV condensation weather device.
- Study on the change in characteristics, properties and morphology of high
density polyethylene/organo-modified calcium carbonate composites exposed
naturally and accelerated weather testing.
- Determining the correlation coefficient between the accelerated weather testing
and natural exposure for lifetime prediction of the HDPE/m-CaCO3 composites.
- Proposing solutions to improve weather durability and increase the lifetime of the
HDPE/m-CaCO3 composites exposed naturally in North Central.
4. New contributions of the thesis
- The natural exposure the HDPE/m-CaCO3 composites were the first studied
at Dong Hoi City, Quang Binh province (Viet Nam) - is a typical climate location of
the North Central region.
- The change in characteristics, properties and morphology of the HDPE/mCaCO3 composites is closely related to weather factors, especially solar radiation and
temperature during natural exposure.
- The correlation coefficient between the accelerated weather testing and
natural exposure were determined for lifetime prediction of the HDPE/m-CaCO3
composites when studying the remained percentage of tensile strength, the remained
percentage of elongation at break and the molecular weight of HDPE in HDPE/mCaCO3 composites.
5. Structure of the thesis
It is displayed in a total of 133 pages with 21 tables, 58 figures, 7 diagrams and
136 references. Its major sections include: Introduction (3 pages), overview (45
pages), methods and experiment (12 pages), results and discussion (52 pages),
conclusion (2 pages), published works (1 page) and references (17 pages). Morever,
there is an appendix with 49 spectra, tables, figures and diagrams of the high density
polyethylene/organo-modified calcium carbonate composites.
3
CHAPTER 1: OVERVIEW
The thesis has conducted a literature review content:
1. Basic information about polyethylene: introdution about polyethylene;
photodegradation reaction and photo-oxidation degradation reaction of polyethylene.
2. High density polyethylene (HDPE): introdution about HDPE; structure,
characteristics and properties of HDPE.
3. High density polyethylene/organo-modified calcium carbonate composites.
4. Natural exposure and accelerated weather testing of polymer.
5. Lifetime of polymer: effect of temperature; effect of humidity, steam; effect
of weather.
6. Research situation natural exposure, accelerated weather testing and lifetime
prediction of polymer.
CHAPTER 2: METHODS AND EXPERIMENT
2.1. Chemicals and equipment
2.1.1. Chemicals: High density polyethylene, calcium carbonate, acid stearic.
2.1.2. Equipment: Preparation of the HDPE/m-CaCO3 composites samples (Haake
internal mixer); measuring instrument IR, UV-Vis, 13C-NMR, XRD, DSC, TGA,
SEM; instrument used for the accelerated weather testing (Atlas UVCON);
measuring instrument the tensile properties (Zwich Z2.5), the color parameters
(ColourTec PCM), electric properties (TR-10C) and viscosity (Ubbelohde).
2.2. Methods for polymer composite preparation
Composites containing high density polyethylene, 30 wt.% calcium carbonate
and 1 wt.% acid stearic were prepared by melt mixing in a Haake internal mixer at
160oC for 5 minutes. Immediately after melt mixing, the composites were hot-pressed
in melting state at 160oC with the pressure of about 5 MPa into about 1-1.2 mmthickness sheets.
2.3. Natural exposure and accelerated weather testing
- Natural exposure: The HDPE/m-CaCO3 composites were exposed on outdoor
testing shelves at the Natural Weathering Station of the Institute for Tropical
Technology in Dong Hoi sea atmosphere region (Quang Binh). The inclining angle of
shelves in comparison with the ground was 450. Total exposure time of the samples
was 36 months.
- Accelerated weather testing: The instrument used for accelerated weather
testing was the UV-CON 327 (USA). Test conditions were set according to the
ASTM D 4329-99. Each cycle of the accelerated weathering test included 8 hours of
UV irradiation at 60oC and 4 hours of condensation (with evaporation) at 50oC. Total
testing time was 720 hours (60 cycles). The UV-CON 327 was set on the automatic
irradiance control mode with an irradiance level of 0.8 w/m2 at 313 nm. After every
six cycles, the samples were withdrawn and stored under standard condition.
2.4. Methods
Infrared (IR), ultraviolet (UV), nuclear magnetic resonance spectroscopic 13C-NMR,
X-ray diffraction (XRD), Scanning Electronic Microscopy (SEM), differential scanning
calorimetry (DSC), thermo gravimetric analysis (TGA), electric properties measurement,
tensile properties measurement, color measurement, viscosity measurement.
4
CHAPTER 3: RESULTS AND DICUSSION
% Transmittance
3.1. The change in morphology and structure of HDPE/m-CaCO3 composites
exposed naturally
3.1.1. Infrared spectra (IR)
IR spectra of M0, M12, M24, M36 samples of HDPE/m-CaCO3 composites
presented in Fig. 3.1.
3370
1639
1380
725
1715
2921
2854
1465
Wavenumbers (cm-1)
Figure 3.5. IR spectra of HDPE/m-CaCO3 composites versus natural exposure time
In the IR spectrum of M0, M12, M24 and M36 samples, some peaks
characterize for stretching and bending vibrations of CH groups in HDPE were found
at 2921, 2854, 1465 and 1380 cm-1. Beside, a peak corresponding to out-of-plane
bending vibration of CH group appears at 725 cm-1. The absorption peak around 1735
cm-1 characterizes for the stretching vibrations of carbonyl groups was seen clearly in
IR spectra of the exposed samples. In addition, photolysis of ketones results in the
formation of vinyl-type unsaturations with absorption band appearing at 1639 cm-1.
A small increase in the region of 3300-3500 cm-1 was attributed to hydroxyl
groups. This is caused by the formation of the carbonyl groups such as ketone,
lactone carbonyl and aliphatic ester occurring in photodegradation process of HDPE
according to the Norish 1 and Norish 2 reaction and mechanism has been well
described in the scheme 3.1.
Table 3.1. Peaks characterize of some groups in the HDPE/m-CaCO3 composites
Pic (cm-1)
Groups
M0
M12
M24
M36
719
724
721
724
CH (bending vibration)
1376 1373
1376
1376 CH3 (bending vibration)
1463 1465
1463
1463 CH2 (bending vibration)
1639
1639
1639 C=C (stretching vibration)
1715
1716
1716 Carbonyl (stretching vibration)
2849 2852
2850
2850 CH3 (stretching vibration)
2918 2915
2920
2931 CH2 (stretching vibration)
3345
3370
3370 OH (stretching vibration)
5
HDPE
h
CH2
CH2
CH
CH2
CH2
O2, PE
H
CH2
CH2
C
CH2
O
CH2
OH
h
H
CH2
CH2
C
O
CH2
CH2
OH
H
CH2
CH2 C
CH2
CH2 CH2
CH2
OH
CH2
CH2 C CH2
carboxylic acid
ester
lactone
h
CH2
CH2
CH2
O
Norrish 2
CHO + CH2
Norrish 1
CH2 C CH3 + H2C CH CH2
O
CH2
CH2 C + CH2
O
CH2
hNorrish 2
CH
CH2 + CH3COCH3
P +
CH2
CH
CH2
C CH
O
CH
CH2
h
saturated ketone
CH
CH
CH2 + P
CH CH3
PE
CH CH CH3 (vinylene)
Scheme 3.1. Simplified photo-degradation mechanism of HDPE
To quantify relatively the carbonyl group content existed in the exposed
samples, carbonyl index (CI) was calculated using the following equation:
CI
I1715
I1462
Carbonyl index (CI)
Where, I1725 and I1465 are absorption peak intensity at 1715 cm-1 and 1462 cm-1.
Figure 3.2 shows the change of CI index of natural exposure samples versus
exposed time.
Time (months)
Figure 3.2. CI value of HDPE/m-CaCO3 composites versus natural exposure time
6
Absorbance
Figure 3.2 exhibits a increase of CI index as increasing the natural exposure
time. After 6 months of natural exposure, the CI index of composite sample increase
1.7 times compared with the initial value and increase 3.0 times after 36 months of
natural exposure. The significant increase of the CI was observed for the samples
exposed from 0 to 6 months, from 12 to 18 months and from 24 to 30 months (hot
season) while from 6 to 12 months, from 18 to 24 months and from 30 to 36 months
(cold season) the CI varies more slowly.
3.1.2. UV-Vis spectra
The UV-Vis spectra showed an increase of the absorption intensity of HDPE in
the composites between 200 and 300 nm wavenumber. In the UV-Vis spectrum of
initial sample (M0 sample), there was one very strong absorption band at 226 nm.
The absorption at 226 nm must be associated with the π – π* transition of the
ethylenic group of the α,β-unsaturated carbonyl of impurity chromophores of the
enone type in photo-oxidation degraded HDPE.
Wavenumber, nm
Figure 3.3. UV-Vis spectra of HDPE/m-CaCO3 composites versus natural exposure time
3.1.3. Nuclear magnetic resonance spectroscopic 13C-NMR
Nuclear magnetic resonance spectroscopic 13C-NMR of HDPE sample (M0n),
HDPE/m-CaCO3 composites samples before natural exposure (M0) and HDPE/mCaCO3 composites samples after 36 months natural exposure (M36) were performed
in figures 3.4 - 3.6.
Figure 3.4. 13C-NMR spectra of HDPE sample (M0n)
7
Figure 3.5. 13C-NMR spectra of M0 sample before natural exposure
Figure 3.6. 13C-NMR spectra of M36 sample after 36 months natural exposure
Figures 3.4 and 3.5 showed that, the resonances at 30.04 ppm and 32.80 ppm of
M0n sample, 30.02 ppm and 32.86 ppm of M0 sample assigned to amorphous regions
and to orthorhombic crystalline regions, respectively. For the M36 sample, the 13CNMR spectra also indicate the resonances at 30.05 ppm and 32.83 ppm assigned to
amorphous regions and to orthorhombic crystalline regions, respectively. Besides, the
new peaks between 25 and 175 ppm were found in the spectrum of the M36 sample.
8
Characteristic peaks are 25.12, 43.18, 75.06 and 175.16 ppm could be assigned as
follows. The peak at 25.12 ppm is from carbons alpha (-*C-CO-) to carbonyl group.
The peak at 43.18 ppm is from carbons alpha to carboxyl group (-*C(R)-COO-). The
peak at 75,06 ppm was assigned as carbon alpha to ester oxygen (-COO-*C-) and the
peak at 175,16 ppm as carboxyl acid or ester carbons (-*COO-).
Figure 3.2. The pics of 13C-NMR spectra and the groups
Samples Pic (ppm)
30,04
32,80
30,02
32,86
25,12
30,05
32,83
43,18
75,06
175,16
M0n
M0
M36
Carbon position
-*CH2- amorphous region
-*CH2- orthorhombic crystalline region
-*CH2- amorphous region
-*CH2- orthorhombic crystalline region
-*C-COO-*CH2- amorphous region
-*CH2- orthorhombic crystalline region
-*C(R)-COO-COO-*C-*COO-
3.1.4. X-ray diffraction
The XRD patterns of HDPE/m-CaCO3 composites before and after 36 months
natural exposure were demonstrated in figures 3.7 and 3.8.
Figure 3.7. XRD patterns of M0 sample
9
Figure 3.8. XRD patterns of M36 sample
Before natural exposure, the M0 sample mainly exhibited a strong reflection peak
at 21.6° followed by a less intensive peak at 23.9°, which correspond to the typical
orthorhombic unit cell structure of (110) and (200) reflection planes, respectively. The
two weak peaks at around 30.0° and 36.2° were attributed to reflection planes (210)
and (020), respectively. In addition, there were several other weak reflection planes in
the range of 40° to 50° angle. In the XRD pattern of M0 sample, there was a peak at
29.5°, representing the planes (104) of distance 3.038 Å for m-CaCO3. The shape of
XRD patterns for the M36 sample was almost similar to that of the M0 sample. The
diffraction peak position of all samples was not changeed while the intensity and width
of each peak were different, depending on the exposure time of the samples.
The intensity of the peaks observed corresponding to (110) and (200) was used
to determine percentage of crystallinity and crystallite size of the samples by Eqs. 1
and 2.
C
IC
(1) and d k (2)
B cos
I C I a
It was seen that the crystallinity percentage (C) of HDPE/m-CaCO3 composites
was increased with rising natural exposure time, from 43.06% to 49.86% (table 3.3).
In the first 12 months of natural exposure, it may be attributed to the strong increase
in the crystallinity of the samples (5.26%). After 12 to 36 months 12 natural
exposure, the crystallinity percentage of the samples was slightly increased (from
48.32% to 49.86%). The crystallite size (for (110) plane) was increased from 9.8 to
12.5 nm when increasing natural exposure time.
Table 3.3. Crystallite size and crystallinity percentage of HDPE/m-CaCO3 composites
versus natural exposure time
Samples
2 (o)
d110 (nm)
C (%)
M0
M6
M12
M18
M24
M30
M36
21,55
21,55
21,55
21,53
21,55
21,54
21,54
9,8
10,5
11,1
11,7
12,2
12,3
12,5
43,06
46,43
48,32
48,90
49,39
49,58
49,86
10
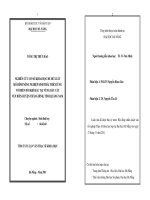
3.1.5. Morphology
(a)
(b)
(c)
(d)
(e)
(g)
(h)
Figure 3.9. SEM images of M0 (a); M6 (b); M12 (c); M18 (d); M24 (e); M30 (g);
M36 (h) samples versus natural exposure time
Figure 3.9 demonstrates the surface images of the samples before and after
natural exposure. Before natural exposure, the sample surface was relatively smooth,
only had some small cracks (M0 sample). After 6 - 36 natural exposure months, there
were more cracks found on the surface of the exposed samples. The number and size
of cracks were increased with increasing natural exposure time. The cracks also
became bigger and deeper.
3.1.6. Color change
Figure 3.10. The change of a*, b*, L* and E* value of HDPE/m-CaCO3
composites according to natural exposure time
11
The change in values for three color parameters (L*, a* and b*) as well as the
total color change (E) of the composites as a function of natural exposure time was
displayed in table 3.4 and figure 3.10. The surface of the samples of HDPE/m-CaCO3
composites was lightened continuously, the L* and E values were increased with
increasing natural exposure time. The changes in E values for the samples were
found to be consistent with the change in L* values. The results of color change
indicated that the surface of the samples of HDPE /m-CaCO3 composites was faded
continuously with increasing natural exposure time expressed by a constant increase
in L* value and significant loss in both redness and yellowness. This phenomenon
may be due to the change in morphology and existence of double bonds inside the
HDPE macromolecules during photodegradation HDPE/m-CaCO3 composites. The
mechanism of forming some double bonds of composite samples were presented in
the schemes 3.2 – 3.5.
H
C
H
C
H
H
C
H
O
H
h
O
H
H
C
O
P
C
H
O
O
H
C
H
+
H
H
H
O
H
P
P
Scheme 3.2. Schematic representation of the formation of trans-vinylene in HDPE chain
H
h
CH2CH2CH2 - C
O
CH
O
C
CH2
H2C
CH3 - C
CH=CH2 + CH2=C
O
OH
Scheme 3.3. Schematic representation of Norrish type II reaction in HDPE chain
C
C
C
H2
C
H2
+
H2C
CH2
CH2
CH2
Scheme 3.4. Schematic representation of beta scission in HDPE chain
H
O
CH
H
C
C
C
O
h
O
H
O
O
CH
O
H
H
H
CH
H
Scheme 3.5. Schematic representation of the formation of carbonyl in HDPE chain
Table 3.4. The a*, b*, L* and E value of HDPE/m-CaCO3 composites according
to natural exposure time
Samples
a*
b*
L*
E
M3
3,27
1,04
2,99
4,03
M6
2,63
0,10
3,11
4,26
M9
2,33
-0,06
3,77
4,44
M12
2,05
-0,18
5,27
5,71
M15
1,71
-0,95
7,22
7,64
M18
1,41
-1,75
7,62
8,00
M21
1,21
-1,89
7,98
8,33
12
M24
M27
M30
M33
M36
1,11
1,027
0,957
0,902
0,836
-2,07
-2,71
-3,51
-3,75
-3,94
9,24
10,08
10,32
10,83
12,07
9,73
10,85
11,12
11,38
12,43
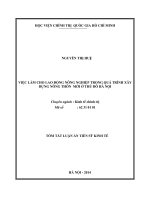
3.1.7. Average molecular weight
The M v of the samples significantly was decreased during natural exposure
time (figure 3.11). After 12 and 36 months of natural exposure, the Mv of M12 and
M36 samples were 47.83 and 71.74% of its initial value of M0 sample, respectively.
The result can be explained by considerable influence of weather factors as solar
irradiation, temperature and humidity on deterioration in average molecular weight of
HDPE, especially in the starting progress of its natural exposure.
Table 3.5. Average molecular weight of HDPE/m-CaCO3 composites versus natural
exposure time
Samples
M6
160000
M12
120000
M18
100000
M24
80000
M30
70000
M36
65000
Average molecular
weight, đvC
Mv
M0
230000
Samples
Figure 3.11. Average molecular weight of HDPE/m-CaCO3 composites versus
natural exposure time
3.2. The change in tensile properties, thermal properties and electric properties
of HDPE/m-CaCO3 composites versus natural exposure time
3.2.1. Tensile property
The remained percent of tensile strength (σ), elongation at break (ε) of
HDPE/m-CaCO3 composites were decreasing with increasing natural exposure time
(figure 3.12). They were decreased significantly during the first 6 months of natural
exposure with 29,4 and 81,4%, respectively. After first 6 months of natural exposure,
the tensile strength and elongation at break of HDPE/m-CaCO3 composites were
decreased more slowly.
Table 3.6. The remained percent of tensile strength, elongation at break and Young
modulus of HDPE/m-CaCO3 composites versus natural exposure time
Times (months)
σ (%)
ε (%)
E (%)
0
100
100
100
6
12
18
24
30
36
70,6 60,4 52,6 50,2 47,5 46,2
18,6 13,4 11,2
9,5
7,4
6,9
117,4 146,1 164,2 168,4 171,5 174,1
The remained percent of
elongation at break, ε (%)
The remained percent of
tensile strength, σ (%)
13
(a)
0
6
12
18
24
30
(b)
0
36
6
12
18
24
30
36
Time (months)
Time (months)
The remained percent of
Young modulus, E (%)
Figure 3.12. The remained percent of tensile strength (a), elongation at break (b) of
HDPE/m-CaCO3 composites versus natural exposure time
0
6
12
18
24
30
36
Time (months)
Figure 3.13. The remained percent of Young modulus of HDPE/m-CaCO3
composites versus natural exposure time
The Young modulus (E) of HDPE/m-CaCO3 composites was increased with
increasing natural exposure time (figure 3.13). After 6, 12, 18, 24, 30 and 36 months
of natural exposure, it was increased 17.4, 46.1, 64.2, 68.4, 71.5 and 74.1% compared
with the unexposed HDPE/m-CaCO3 composites, respectively.
3.2.2. Thermal properties
The thermal datas and DSC curves of HDPE/m-CaCO3 composites before and
after natural exposure was displayed in table 3.7 and figures 3.14 – 3.17.
Table 3.7. Melting temperature (Tm), melting enthalpy (Hm) and relative degree
crystalline (C) of HDPE compoundversus natural exposure time
C (%)
Samples
Tm, PE (oC)
Hm, PE (J)
M0
144
168,5
57,4
M3
143
169,3
57,7
M6
144
169,3
57,7
M9
143
179,7
61,2
M12
145
179,1
61,2
M15
142
179,5
61,3
M18
142
179,8
61,6
M21
142
180,4
62,3
M24
144
180,3
62,1
M27
144
180,9
62,7
M30
143
181,4
62,6
M33
143
181,8
62,7
M36
144
181,7
63,4
14
Figure 3.14. DSC curve of M0 sample
Figure 3.15. DSC curve of M12 sample
15
Figure 3.16. DSC curve of M24 sample
Figure 3.17. DSC curve of M36 sample
The melting temperature (Tm) of exposed and unexposed samples is almost
constant, around 144 oC. Table 3.7 exhibits a slight increase of melting enthalpy and
relative degree crystalline during the first 6 months of natural exposure with 169.3J
and 57.7%, respectively. The significant increase of melting enthalpy and relative
degree crystalline was observed for the samples exposed from 6 to 9 months while
16
from 9 to 36 months, the melting enthalpy and relative degree crystalline varies more
slowly.
The thermo gravimetric (TG) data of HDPE/m-CaCO3 composites samples
exposed naturally are listed in table 3.8.
Table 3.8. Initial degradation temperature (Tini), maximum degradation temperature
(Tmax) and remained weight at different temperature of HDPE/m-CaCO3 composites
exposed naturally
Samples
Tini, oC
Tmax, oC
M0
M3
M6
M9
M12
M15
M18
M21
M24
M27
M30
M33
M36
463
462
455
453
451
450
449
449
448
447
446
445
445
467
465
459
461
460
460
458
457
457
456
453
454
453
Remained weight (%) at
400 (oC) 450 (oC) 500 (oC)
89,55
56,75
3,45
88,55
55,92
2,72
87,46
54,82
1,22
87,44
53,60
1,40
86,77
52,27
1,07
86,11
51,89
1,05
85,83
51,12
1,05
85,21
50,47
1,04
85,02
50,02
0,92
84,66
48,93
0,94
84,19
48,86
0,93
83,81
48,23
0,93
83,62
47,32
0,86
The TG curves demonstrate first weight loss stage of the samples observed at
300-465oC. Then, the highest weight loss stage of the samples is at 465-500oC, and
finally, small weight loss stage is at 500-600oC. The results in table 3.8 show the
initial thermo-degradation temperature, maximum thermo-degradation temperature,
as well as remained weight of the samples to have a decrease trend versus natural
exposure time and aging temperature. This confirms the influence of natural exposure
time on decrease of average molecular weight and chemical durability of HDPE
macromolecules.
3.2.3. Electric properties
3.2.3.1. Dielectric constant
It can be seen that the effective dielectric constant of the M0 sample was very
weakly dependent on frequency, which is the typical characteristic of non-polar
polymers. The M0 sample contained non-dipolar units and there were not frequency
characteristics in the range of 100 – 106 Hz. For the exposed samples, the interfacial
polarization can cause an increase of dielectric constant when compared with the M0
sample. When the chains of HDPE in HDPE/m-CaCO3 composites were scissed, the
free volumes could be decreased and may cause the increase of dielectric constant.
Additionally, it was caused by the formation of the carbonyl groups such as ketone,
lactone carbonyl and aliphatic ester occurring in photo-degradation process of
HDPE/m-CaCO3 composites.
Dielectric loss
Dielectric constant
17
Frequency (Hz)
Frequency (Hz)
Figure 3.18. Frequency dependence of dielectric constant (a) and dielectric loss (b) of
HDPE/m-CaCO3 composites according to natural exposure time
3.2.3.2. Dielectric loss
The dielectric loss of HDPE/m-CaCO3 composites was decreased with
increasing natural exposure time and frequency because a higher frequency voltage
can yield higher electrical conductivity as shown in figure 3.18b. Unlike the
dependence of dielectric constant, the dielectric loss of the samples decrease when
increasing natural exposure times. There were two competitive factors that affect the
dielectric loss of the samples such as hindrance in charge transport and the
incorporation of charge.
3.2.3.3. Electrical breakdown voltage
The value of electrical breakdown voltage of the samples was decreased
gradually with increasing natural exposure time. This observation is of vital
importance for engineering application because the dielectric rupture always occurs
at the weakest points. In other words, the real dielectric strength of the samples is
determined by the weakest part of their insulation. Firstly, when increasing natural
exposure time, the relative crystalline degree of the samples was reduced. This can be
explained by the scission photo-degradation of HDPE macromolecules in HDPE/mCaCO3 composites leading to decrease crystalline regions of HDPE/m-CaCO3
composites. In the result, the intrinsic strength of the samples was decreased.
Secondly, the mobility of charges in the HDPE/m-CaCO3 composite insulation is
much higher with inreasing natural exposure time. Therefore, the charges are wider
distributed in the HDPE/m-CaCO3 composites and the screening effect is less
pronounced. The above reasons make decrease the electrical breakdown voltage of
the composites according to natural exposure time.
Table 3.9. Electrical breakdown voltage data of HDPE/m-CaCO3 composites
according to natural exposure time
Samples
E (kV/mm)
Samples
E (kV/mm)
M0
24,17
M21
15,89
M3
21,89
M24
15,34
M6
21,55
M27
15,21
M9
18,33
M30
14,86
M12
17,54
M33
14,46
M15 M18
17,04 16,23
M36
14,23
3.2.4. Test and evaluation of fungal spores in HDPE/m-CaCO3 composite
Figure 3.19 reflects incubation results of composite samples at 23°C, through
72 hours after 6 months and 40 months of natural exposure. Observation results of the
composites with naked eye and a template on a microscope (x100) showed no
development of mold on both samples in the same testing conditions. This can be
explained by the petroleum origin of HDPE, a thermoplastic resin which is quite
18
inert, resistant to biological agents, including mold attack. Although HDPE matrix
was photo-oxidation degraded forming the products are low-molecular compounds
with oxygen-containing groups, including ester, hydroperoxide groups, etc. HDPE
still has a relatively high average molecular weight, so it cannot be a nutrient source
for fungal spores in the air to localize and develop in three dimensions of the sample,
first of all on the sample surface.
Figure 3.19. The samples tested for fungal spores
Where, well 1,4: M1 sample; well 2,5: M2 sample; well 3,6: for control
3.3. Lifetime rediction of the HDPE/m-CaCO3 composites exposed naturally in
North Central
3.3.1. Prediction of service half-life time of HDPE/m-CaCO3 composite
3.3.1.1. Prediction of service half-life time based on remained percentage of tensile strength
The change in remained percent of tensile strength (σ) of HDPE/m-CaCO3
composites exposed naturally condition was described by the trend types including to
linear, exponential and polynomial types were applied for points of σ at the different
testing times in figure 3.20. The equations and regression coefficients obtained from
fitting these types were listed in table 1 in which, y is the remained percentage of
tensile strength; x is the natural exposure time. Among the different orders of
polynomial functions, the 6th order polynomial function exhibited a highest regression
coefficient (R2 = 1). It means that the tendency of decrease in tensile strength of the
HDPE/m-CaCO3 composite vs. exposure time complied with 6th orderpolynomial
function. This was a complex process and combined multi-effects. From figure 3.20,
it can be observed the service half–life time of HDPE/mCaCO3 composite according
to the tensile strength was 25.6 months.
Table 3.10. Trend type, equation and regression coefficient (R2) of variation of tensile
strength during 36 months of natural exposure
No. Trend type
Equation
R2
1
2
3
4
5
6
Linear
Exponential
Polynomial
Polynomial
Polynomial
Polynomial
7
Polynomial
y = -1.2964x + 84.407
y = 83.886e-0.02x
y = 0.0624x2 – 3.544x + 95.645
y = -0.0026x3 + 0.2048x2 – 5.4422x + 99.062
y = 0.0001x4 – 0.0107x3 + 0.3829x2 - 6,.6586x + 99.804
y = -7.10-6x5 + 0.0007x4 – 0.0294x3 + 0.6197x2 – 7.6485x +
99.952
y = 10-6x6 – 0.0002x5 + 0.0065x4 – 0.1389x3 + 1.5534x2 –
10.447x + 100
0.7694
0.8476
0.9621
0.9939
0.9982
0.999
1
19
Figure 3.20. Remained percentage of tensile strength (σ) of the HDPE/m-CaCO3
composite vs. exposure time
3.3.1.2. Prediction of service half-life time based on remained percentage average
molecular weight of HDPE in the composite
Table 3.11. Trend type, equation and regression coefficient (R2) of variation of
average molecular weight during 36 months of natural exposure
No.
Trend type
Equation
R2
1
2
3
4
5
Linear
Exponential
Polynomial
Polynomial
Polynomial
0,8713
0,9645
0,9826
0,9945
0,9984
6
Polynomial
7
Polynomial
y = -4279,8x + 197036
y = 203983e-0,035x
y = 147,16x2 – 9577,4x + 223524
y = -5,0154x3 + 417,99x2 - 13188x + 230024
y = 0,3303x4 – 28,795x3 + 946,23x2 - 16796x +
232225
y = 0,0016x5 + 0,1856x4 – 24,262x3 + 888,94x2 16557x + 232189
y = -0,0052x6 + 0,5642x5 – 22,661x4 + 405,38x3 –
2774,7x2 - 5575x + 232000
0,9984
1
Table 3.21. Variation of average molecular weight of HDPE chains in
HDPE/m-CaCO3 composite vs. natural exposure time
The equations and regression coefficients obtained from fitting these types were
listed in table 3.11 (y is the average molecular weight of HDPE in HDPE/m-CaCO3
20
composite, x is the natural exposure time). Accordingly, the variation trend of
average molecular weight of HDPE chains in HDPE/m-CaCO3 composite was also
fitted to the 6th order polynomial function like the variation trend of tensile strength
as above discussed. However, from figure 3.21, the service half-life time of
HDPE/mCaCO3 composite based on average molecular weight of HDPE in the
composite was only 11.2 months. This value was much different from that value
obtained owing to remained percentage of tensile strength.
3.3.2. Lifetime prediction based on correlation between the natural exposure and
accelerated weather testing
3.3.2.1. Correlation between the natural exposure and accelerated weather testing in
tensile strength
The remained percent of tensile strength (σ) of HDPE/m-CaCO3 composite
natural exposure and accelerated weather testing were demonstrated in table 3.12.
Table 3.12. The remained percent of tensile strength of HDPE/m-CaCO3 composite
natural exposure and accelerated weather testing
Natural
Artificial
Days
σ (%)
Hours
σ (%)
0
180 360 540 720 900 1080
100 70.6 60.4 52.6 50.2 47.5 46.2
0
72 144 216 288 360 432 504 576 648 720
100 83.5 70.2 62.5 56.4 52.7 49.8 48.2 46.1 45.2 45.1
The equations and regression coefficients for the remained percentage of tensile
strength of HDPE/m-CaCO3 composite in both testing conditions were given as follows:
r2 = 0.9939
YN 99.06 0.1814X N 2.275 *10 4 X 2N 0.9764 *107 X 3N
YA 99 .54 0.2504 X A 4.159 * 10 4 X 2A 2.424 * 10 7 X 3A
r2 = 0.9987
Remained percent of
tensile strength (%)
Natural
Artificial
Times (natural: days; arfiticial: hours)
Figure 3.22. Correlation coefficient between natural exposure and accelerated weather
testing based on remained percentage of tensile strength of the HDPE/m-CaCO3
composite according to natural exposure and accelerated weather testing time
As presented in figure 3.22, 412.6 hours of accelerated weather testing was
corresponded to 710 days of natural exposure for the remained percentage of tensile
strength 50%.
3.3.2.2. Correlation between the natural exposure and accelerated weather testing in
elongation at break
The remained percent of elongation at break (ε) of HDPE/m-CaCO3 composite
natural exposure and accelerated weather testing were demonstrated in table 3.13.
21
Table 3.13. The remained percent of elongation at break of HDPE/m-CaCO3
composite natural exposure and accelerated weather testing
Natural
Artificial
Days
σ (%)
Hours
σ (%)
0
180 360 540 720
100 18.6 13.4 11.2 9.5
0
72 144 216 288
100 45.5 22.7 13.5 10.7
900
7.4
360
8.5
1080
6.9
432
6.6
504
5.4
576
4.6
648
4.1
720
3.2
The equations and regression coefficients for the remained percentage of
elongation at break of HDPE/m-CaCO3 composite in both testing conditions were given
as follows:
YN 99 .93 0.8944 X N 3.404 * 10 3 X 2N 6.016 * 10 6 X 3N 4.95 * 10 9 X 4N 1.535 * 10 12 X 5N
r2 = 0.9993
YA 98 .99 1.393 X A 8.314 * 10 3 X 2A 2.299 * 10 5 X 3A 2.933 * 10 8 X 4A 1.397 * 10 11 X 5A
r2 = 0.9949
Remained percent of
elongation at break (%)
Natural
Artificial
Times (natural: days; arfiticial: hours)
Figure 3.23. Correlation coefficient between natural exposure and accelerated weather
testing based on remained percent of elongation at break of the HDPE/m-CaCO3
composite according to natural exposure and accelerated weather testing time
From the figure 3.23, the correlation factor determined by the elongation at
break that for 46.52 hours accelerated weather testing was as the same as the case
tested for 74.19 days in natural exposure condition.
3.3.2.3. Correlation between the natural exposure and accelerated weather testing in
average molecular weight of HDPE in the composite
The average molecular weight of HDPE in the composite natural exposure and
accelerated weather testing were demonstrated in table 3.14.
Table 3.14. Average molecular weight of HDPE in the composite natural exposure
and accelerated weather testing
Natural
Artificial
Days
M v (đvC, 103)
Hours
M v (đvC, 103)
0 180
230 160
360
120
540
100
720
80
900
70
1080
65
0
72
230 185
144
150
216
125
288
110
360
96
432
85
504
73
576
61
648
57
720
51