Phương pháp xây dựng và tính chỉ số tổng hợp đánh giá chất lượng cuộc sống ở việt nam tt tiếng anh
Bạn đang xem bản rút gọn của tài liệu. Xem và tải ngay bản đầy đủ của tài liệu tại đây (200.23 KB, 13 trang )
1
2
INTRODUCTION
2. Research purpose
Research purpose of the thesis is to develop a system of statistical
indicators measuring quality of life and calculation method of quality of life
index on the basis of determining concept framework of quality of life in
order to serve for the work of socio-economic macro management and
activity of comparability and assessment of quality of life in Viet Nam.
To obtain the aforementioned purposes, the thesis must answer the
following research questions:
Which direction should the study on quality of life in Viet Nam
be implemented?
How is the concept of quality of life in Viet Nam understood?
Which components does structure of concept of quality of life
include?
How is system of statistical indicators measuring quality of life
in Viet Nam developed and which indicators are included?
Which methodology is quality of life index developed by? How
are weights and method of aggregation determined?
3. Subjects and research scope
Objects and research coverage of the thesis are quality of life in Viet
Nam, system of statistical indicators measuring quality of life and
composite index of quality of life in Viet Nam.
However, quality of life is a huge research theme meanwhile data
sources are limited, the thesis only focuses on measuring objective aspect
but temporarily does not consider about measuring subjective aspect of
quality of life.
Data in 2016 will be collected to pilot calculate the composite index
of quality of life at national level.
4. Research methodology
As quality of life is one of new issues that have not been much
studied in Viet Nam, qualitative research methodology consisting of
literature review and in-depth interview with experts are used throughout
the research in order to study and find out issues such as research approach
and measurement of quality of life, components of quality of life; system of
1. Reasons for choosing theme
Quality of Life and improving the quality of people’s life are key
contents in the human development strategy. This objective is put at the
forefront in the socio-economic development strategy of every nation and
gets much attention from many countries in the world as well as Viet Nam.
In the last years, on the basis of the previous studies on quality of life
of scholars worldwide, many international organizations and countries have
raised different viewpoints and concepts on quality of life, depending on
the extent of development, socio - cultural notions, and traditions of each
nation and region. Along with the development of concept of quality of life,
international organizations and nations have also studied and developed
systems of indicators measuring quality of life, satisfaction and well-being
with life. On the basis of these indicators, international organizations and
nations have calculated composite index in order to evaluate quality of
people’s life, changes in quality of life over time or compare among
nations, regions, or inhabitant communities.
However, such academic researches on this theme are relatively
limited in Viet Nam. The quality of life of Viet Nam is just only
internationally evaluated and compared in the aspect of the world. At
national level, we just standstill at discussions, exchanges of concept but do
not clarify rationale or background of constituting concept. Some other
researches only consider partly quality of life as satisfaction with life or
measurement of quality of life of each specific group such as children,
elderly persons in the aspect of psychology, health, etc. The concept itself
and insight of concept of quality of life in Viet Nam are not currently
apparent. Indicators measuring quality of life are dispersed and
unsystematic, so it hardly evaluates comprehensively quality of life. This is
a research gap in the quality of life in Viet Nam.
Having originated from practical basis in term of existing policy and
research gap, it is absolutely necessary to carry out the thesis “Method of
developing and calculating composite index to measuring the quality of life
in Viet Nam”.
3
statistical indicators measuring quality of life; calculation method of
composite index; etc.
In addition, to pilot calculate composite index of quality of life, the
thesis uses method of collecting secondary data from available sources;
method of collecting primary data by interviewing experts in order to
determine weights of component indices; method of processing and
analyzing data; method of comparison, assessment on the influence of the
components on quality of life in general in the study.
5. New contributions of the thesis
The thesis has new theoretical knowledge contributions as follows:
- Rationale of the research and measuring concept of the quality of
life in Viet Nam, of which determining study approach and developing
theoretical framework on the quality of life including concept and structure
of the concept.
- System of statistical indicators measuring quality of life in Viet Nam.
- Methodology of building and calculating composite index of
quality of life in Viet Nam.
- Additionally, the thesis also contributes to practical aspect when
pilot calculating composite index of quality of life in Viet Nam in 2016.
This is a useful reference for making policies to improve quality of
people’s life.
6. Thesis structure
Apart from Introduction and Conclusion, the thesis consists of 3
chapters:
Chapter 1. Theoretical basis on quality of life
Chapter 2. System of statistical indicators measuring quality of life in
Viet Nam
Chapter 3. Developing calculation method of quality of life index in
Viet Nam.
4
CHAPTER 1. THEORETICAL BASIS ON QUALITY OF LIFE
1.1. General theoretical issues on quality of life
1.1.1. Research approaches to quality of life
Literature review shows that there are some approaches to determine
the quality of life. Initially, quality of life is evaluated by purely economic
approach basing utility theory and through a unique indicator as GDP per
capita. However, this notion has been gradually changed since many theories
mentioned quality of life as a multi-dimensional cross-sectoral concept.
In the 1960s, there were two oppositely traditional approaches in
measuring quality of life, i.e. objective and subjective approaches.
Objective approach based on the resources focuses on measuring people’s
objective circumstances. Meanwhile, subjective approach based on utility
theory is the measurement of subjective wellbeing. In the 1970s, the utility
theory was replaced by the basic needs approach. The basic needs theory
stated that quality of life was defined as the level of satisfaction of most
members in the given society with the hierarchical needs (Sirgy, 1986).
Capability approach to the quality of life was established in the
1980s and became popular in the 1990s. According to Stiglitz et al.
(2009:42), “this approach conceives a person’s life as a combination of
various ‘doings and beings’ (functioning) and of his or her freedom to
choose among these functioning (capabilities)”. This approach is
considered to have covered both the objective approach based on resources
and the basic needs approach. At present, this approach is one of the most
influential theories and is the premise for the Human Development Index,
the Millennium Development Goals, and many other development issues at
the global level.
1.1.2. Some debates related to concept of quality of life
Due to heterogeneous approaches as well as personal perceptions,
different concepts of the quality of life were mentioned but no widely
accepted concept exists. This leads to many debates related to concept of
the quality of life and how to measure quality of life.
However, in the social science researches, there were two approaches
in measuring quality of life which are discussed the most, including
5
6
objective or subjective approaches and concept of quality of life whether as
uni-dimension or multi-dimension and which dimensions are concerned.
The objective measurements on quality of life are presented by
evaluating external living conditions while subjective measurements consider
personal assessments on those conditions. According to Borthwick-Duffy
(1992) (quoted in Felce & Perry, 1995, 54), there are 3 perspectives on this
issue, including: (1) by objective approach, consider quality of life as quality
of living conditions; (2) by subjective approach, quality of life is considered
as satisfaction with life; (3) a combination of two subjective and objective
approaches in measuring quality of life based on conceding their strengths
and weaknesses. Then, the quality of life is considered as a combination
between living conditions and satisfaction with life. According to Cummins
(2000), Hagerty et al. (2001), Costanza et al. (2007), Stiglitz et al. (2009),
etc, many researchers agree with the third perspective.
In the viewpoint of social research, quality of life is an abstract concept,
accordingly it is often considered with different components (dimensions).
Nowaday, there is a high concurrence in considering quality of life as a multidimensional concept (Cummins, 1997; Felce, 1997; Snoek, 2000; Hagerty et
all, 2001; …). Along with this concurrence, many researchers found out the
way to determine dimensions or components of quality of life. However, they
still did not reach consistency on how many dimensions as well as which
dimensions they are (Alkire, 2008). Generally, three aspects of physical,
psychology and society are considered when studying quality of life.
1.1.3. Some measurements of quality of life of international
organizations and nations worldwide
In the last years, on the basis of the previous studies on quality of life
of scholars worldwide, many international organizations and countries have
conducted different studies on measuring and assessing the changes in
quality of life among nations, cities, communities, etc.
Accordingly, many composite indices measuring the quality of life
have been widely published such as United Nations’ World Happiness
index (WHI), Better Life Index of the Organization for Economic
Cooperation and Development (OECD), Where-to-be-born index of the
Economist Intelligence Unit (EIU), the Happy Planet Index (HPI) of the
New Economics Foundation (NEF), etc.
Not only international organizations but also many countries
worldwide have studied, developed a system of indicators measuring
quality of life and calculating composite index reflecting quality of life or
similar concepts. Many countries such as England, France, New Zealand,
and Canada conducted periodical surveys to collect information for
research on quality of life in their nations. Some countries in the same
region with Viet Nam have spent many years studying this theme such as
Malaysia Quality of Life (MQL) of Malaysia, Green and Happiness Index
(GHI) of Thailand, etc.
The common point of these studies is that the majority of them
evaluate quality of life in a multi-dimensional manner. Rationale of concept
and structure of the concept of quality of life or similar concepts are always
determined on the basis of theoretical cornerstone or certain philosophies.
In order to measure quality of life, depending on its construct, criteria of
indicator selection and data collection ability, each research determines its
certain indicators. However, many researches combined considering
objective and subjective indicators in measuring and assessing quality of
life. Of which, objective indicators often reflect people’s living conditions
which are easily collected by different sources, particularly from available
and official statistics sources. The most discussed objective aspects in the
assessment on quality of life include: economic conditions, housing
conditions, education, health, environment, family life and community,
people’s safety and participation. The subjective indicators reflecting
people’s perception of life are collected by social surveys.
1.2. Theoretical framework on quality of life in Viet Nam
1.2.1. Socio-economic viewpoints and objectives in Viet Nam
In spite of existing many issues need solving, development
perception of Viet Nam is comprehensive-oriented development for every
aspect of socio-economic life, of which focusing on human rights
guarantee; satisfying people’s needs for human development, improve
quality of life. The socio-economic development objectives of Viet Nam as
well as international commitments have clearly indicated that.
7
8
Article 3 of the Constitution of the Socialist Republic of Viet Nam
2013 stated: “The State guarantees and promotes the people's mastery;
acknowledges, respects, and protects human rights and citizens’ rights;
implements the objectives of affluent people, powerful state, democracy,
justice, civilization, and that all people enjoy abundant, free, and happy life
and are given conditions for all-sided development”.
The socio - economic development strategy for the period of 2011- 2020
clearly states that commitment of Viet Nam Government: “Economic growth
should be combined with cultural development, implementation of social
advance and equality, continuous improvement of people’s life quality,…”.
1.2.2. Approaches to measuring quality of life in Viet Nam
From the aforementioned analysis, the author suggests that the
quality of life in Vietnam should be considered in the capability approach,
also known as human development approach (Cobb, 2000), in combination
with the subjective wellbeing approach. This means that the quality of life
in Vietnam needs to be measured by both objective and subjective factors.
This combination in the measurement of quality of life in Vietnam is both
methodological and in line with the general trend of the world. All experts
who took part in the in-depth interview agree with this suggestion.
1.2.3. Propose theoretical framework on quality of life in Viet Nam
With the aforementioned approaches, the quality of life in Viet Nam
is a multi-dimensional concept. Of which, objective quality of life is
measured by socio-economic indicators in order to reflect at extent to what
the needs of people’s living conditions are met or can be met; subjective
quality of life is measured by the extent of happiness, wellbeing,
satisfaction or similar states of each individual. Therefore, from the author's
point of view, the quality of life in Vietnam should be interpreted as
follows: "Quality of life is the extent to which objective human needs of
living condition are fulfilled in relation to personal perceptions of
subjective wellbeing”.
Structure of this concept will be defined on the basis of top-down
approach. Additionally, it should be based on theory in combination with
using selected available list and based on availability of data. These
components must be not only compliance with the context of Viet Nam but
also appropriate with international practice.
The objective dimensions of quality of life in Vietnam were
identified based on Allardt (1993) and Stiglitz et al. (2009), according to
the capability approach. Meanwhile, personal perceptions - the subjective
dimension of quality of life in Vietnam- are considered based on theory of
subjective wellbeing. Experiences of international organizations and
countries worldwide as well as real situation in Viet Nam currently are
practical basis.
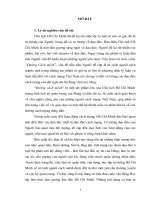
Then, the theoretical framework of the quality of life in Vietnam is
proposed in Figure 1 below.
Objective dimensions:
Economic conditions
Housing conditions
Education
Health
Family relationship
Participating
community
Nature environment
Social environment
Governance
Political voice
QUALITY
OF LIFE
Subjective dimension:
Satisfaction with Life
Figure 1. Theoretical framework of Quality of Life in Vietnam
Source: Author’s suggestion.
This theoretical framework is the basis for practicing measurement
and assessment of the quality of life in Viet Nam in a systematic and
scientific manner.
9
10
CONCLUSION FOR CHAPTER 1
The objective of chapter 1 is to develop theoretical framework on the
quality of life in Viet Nam, which consists of concept and its construct.
This theoretical framework must be developed on the basis of robust
rationale and practice.
Fundamental rationale for the development of theoretical framework
on the quality of life in Viet Nam is theories on the quality of life in the
world. Generally, quality of life is approached in the tendency of multidimension and multidisciplinary. Theories on quality of life can be
developed by different approaches such as objective approach focused on
the resources and living conditions; subjective approach based on personal
well-being; basic needs approach or capability approach. The
heterogeneous approaches lead to different perceptions on quality of life.
However, not any concepts are widely accepted.
Practical basis for the development of theoretical framework on the
quality of life in Viet Nam is development perspective, socio-economic
development objectives as well as current socio-economic background in
Viet Nam and experience of international organizations, nations in studying
quality of life. The analysis shows that the quality of life in Viet Nam
closely associates with human development, economic development,
cultural development, social equity and development of safety and healthy
living environment.
Accordingly, the thesis goes to conclusion that quality of life in Viet
Nam is a multi-dimensional concept which should be considered in line
with capability approach in combination with subjective well-being
approach. Therefore, the quality of life in Viet Nam must be measured by
both subjective and objective indicators. The structure of concept of the
quality of life in Viet Nam is divided by 11 components, of which 10
components reflect the needs of objective living condition that should be
met, including: (1) economic conditions, (2) housing conditions, (3)
education, (4) health, (5) family relationship, (6) participating in
community, (7) natural environment, (8) social environment, (9)
governance and (10) political voice; component (11) reflects people’s
subjective perception to life through their satisfaction with life.
CHAPTER 2. SYSTEM OF STATISTICAL INDICATORS
MEASURING QUALITY OF LIFE IN VIET NAM
2.1. General issues on the development of indicator system measuring
quality of life
2.1.1. Method of developing indicator system measuring quality of life
The thesis uses the top-down approach (theoretical approach) to
develop indicator system measuring quality of life. The thesis applies
hierarchical design by Maggino & Zumbo (2012), starting from concept
model, identifying components of the concept, determining variables, basic
indicators, finally these indicators are arranged in an appropriate manner in
the indicator system.
By this approach, the process of measuring quality of life requests
for a sound theoretical framework. Then, these indicators not only simply
provide information but also present relationship with concept model.
2.1.2. Requirements and principles of the development of system of
statistical indicators measuring quality of life in Viet Nam
According to Noll (2004), a system of indicators must satisfy general
requirements, including: (1) being developed on the scientific basis with
theoretical approach and apparent concept; (2) as a comprehensive and
integrated system; (3) using the most appropriate indicators (valuable and
reliable); and (4) using the best available database and guarantee
comparability among nations (or localities).
Apart from the aforementioned requirements, a system of statistical
indicators measuring quality of life in Viet Nam must cover completely
key aspects of the quality of life, meet requirements of measuring quality of
life in Viet Nam in conformity with certain historic background; indicators
are strictly regulated in term of content, coverage, calculation method and
guarantee legality and consistency; make sure of stability in a relatively long
time but being changeable in conformity with conditions in each period;
In order to meet the aforementioned requirements, the development
of system of statistical indicators measuring quality of life must comply
with the following principles to assure: (1) targeted orientation; (2)
systematization; (3) concretization; (4) accuracy; (5) feasibility; (6)
international comparability; (7) adaptation; (8) efficiency.
11
12
Criteria to select statistical indicators measuring quality of life
The thesis uses both direct and indirect indicators (proxy) to measure
quality of life. Besides, types of indicator - input, output or outcome can be
used simultaneously, in which, the output indicators and outcome indicators
are preferred.
The thesis uses 14 criteria used by Jacksonville Community Council,
Incorporated (Florida, United States) when selecting quality of life indicators.
These criteria include: (1) purposefulness, (2) importance, (3) validity and
accuracy, (4) relevance, (5) responsiveness, (6) anticipation, (7)
understandability, (8) availability and timeliness, (9) stability and reliability,
(10) outcome orientation, (11) asset orientation, (12) scale, (13) clarity, and
(14) representativeness.
2.1.4. Process of developing system of statistical indicators measuring
quality of life
As mentioned above, contents of subjective measurement of quality of
life exceed over the coverage of the thesis. With the components of
measuring the extent of fulfilling the needs of objective living conditions,
determining indicators is carried out by the following steps:
Step 1: Literature review, study international experience in the
development of system of statistical indicators measuring quality of life;
considering national development goals; study related statistical indicator systems.
Step 2: Make the list of indicators and develop a summary of their
properties.
Step 3: Select indicators in line with mentioned criteria and guarantee
requirements of indicator system as well as comply with principles of
developing indicator system.
Step 4: Consult with experts about the list of indicators proposed in step 3.
Step 5: Sum up experts’ ideas, study again data properties and
selection criteria to make the final indicator system.
2.2. Propose a system of statistical indicators measuring quality of life
in Viet Nam
The system of statistical indicators measuring quality of life in Viet
Nam is divided by 12 groups, of which the first 10 groups reflect objective
aspects of the quality of life, group 11 reflects subjective aspect of the quality
of life and the group 12 reflects the overall quality of life.
2.2.1. Indicators for measuring the economic conditions
Indicator 1.1: Employment rate (aged 15 and over) (%)
Indicator 1.2: Monthly average income per capita (VND)
Indicator 1.3: Poverty rate (%)
Indicator 1.4: Percentage of respondents reporting that their
economic condition has improved in the past 5 years (%)
Indicator 1.5: Percentage of laborers having social insurance (%)
2.2.2. Indicators for measuring the housing conditions
Indicator 2.1: Percentage of households having permanent house (%)
Indicator 2.2: Average dwelling area per capita (m2)
Indicator 2.3: Percentage of households using hygienic water (%)
Indicator 2.4: Percentage of households using electricity (%)
Indicator 2.5: Percentage of households using hygienic toilet (%)
Indicator 2.6: Percentage of households having or using at least one
of the information and communication equipments (%)
2.2.3. Indicators for measuring the education
Indicator 3.1: Literacy rate in population aged 15 and over (%)
Indicator 3.2: Percentage of population with high school diploma or
higher (%)
Indicator 3.3: Number of pupils per teacher
Indicator 3.4: Net enrolment rates (%)
Indicator 3.5: Completion rate (primary, secondary and high school) (%)
Indicator 3.6: Percentage of children under 5 years who are
monitored for development in health, education and social psychology (%)
Indicator 3.7: Number of years of schooling for the population aged
15 and over
2.2.4. Indicators for measuring the health
Indicator 4.1: Life expectancy at birth
Indicator 4.2: Infant mortality rate (per 1000 live births)
Indicator 4.3: Number of doctors per 10000 people
Indicator 4.4: Number of patient beds per 10000 people
2.1.3.
13
Indicator 4.5: Percentage of children under 1 year old immunized
fully vaccinations (%)
Indicator 4.6: Percentage of children under 5 years old malnutrition (%)
Indicator 4.7: Percentage of people having health insurance (%)
2.2.5. Indicators for measuring family relationships
Indicator 5.1: Percentage of household having a cultural family certificate (%)
Indicator 5.2: Divorce rate (per 1000 people)
Indicator 5.3: Percentage of household having family violence (%)
Indicator 5.4: Sex ratio at birth
2.2.6. Indicators for measuring the participating community
Indicator 6.1: Percentage of villages having cultural house (%)
Indicator 6.2: Percentage of villages having a cultural village certificate (%)
Indicator 6.3: Percentage of respondents having voluntary
contribution to local projects (%)
2.2.7. Indicators for measuring the nature environment
Indicator 7.1: Percentage of respondents reporting that the water
quality has declined in the past three years (%)
Indicator 7.2: Percentage of respondents reporting that the air quality
has declined in the past three years (%)
Indicator 7.3: Forest area (% of land area)
Indicator 7.4: Living solid waste collection rate (%)
2.2.8. Indicators for measuring the social environment
Indicator 8.1: Criminal rate (per 10000 people)
Indicator 8.2: Percentage of respondents reported they were victims
of one of the four types of crime (%)
Indicator 8.3: Percentage of respondents said they felt safe walking
alone around the area they live during the night (%)
Indicator 8.4: Safety levels in localities
Indicator 8.5: Road traffic death rate (per 100000 people)
2.2.9. Indicators for measuring the governance
Indicator 9.1: Transparency of local decision-making index
Indicator 9.2: Control of corruption index
Indicator 9.3: Public administrative procedures index.
14
2.2.10. Indicators for measuring the political voice
Indicator 10.1: Percentage of people voted in the National Assembly election (%)
Indicator 10.2: Percentage of people voted in the Commune People’s
Council Election (%)
Indicator 10.3: Percentage of people voted in the Village Head
Election (%)
Indicator 10.4: Percentage of respondent said that the Candidate was
not suggested (%)
2.2.11. Indicators for measuring the satisfaction with life
Indicator 11.1: Lever of satisfaction with life
2.2.12. Indicators for measuring the overall quality of life
Indicator 12.1: The quality of life index
In Viet Nam, at present, there are not any researches publishing data
on the satisfaction of the people with their life. Additionally, similarly to
the quality of life, satisfaction with life is an abstract concept that is often
measured by a multi-item scale. Developing this scale is a complex process
that needs implementing in a specific research project. This exceeds over
the author’s ability. Therefore, in the coverage of this thesis, the author
only raises issue: it needs to study on the satisfaction with life when
carrying out measurement of quality of life in Viet Nam. The contents and
measurement method of satisfaction with life will be continuously studied
in the future.
Contents related to composite index of quality of life will be
presented in the chapter 3 of this thesis.
15
CONCLUSION FOR CHAPTER 2
The objective of chapter 2 is to develop system of statistical
indicators measuring quality of life in Viet Nam. This system must satisfy
general requirements of the indicator system such as scientific basis, a
comprehensive and integrated system includes appropriate indicators,
available data and guarantee spatial comparability. Besides that, in order to
measure quality of life, this system must cover completely key aspects of
the quality of life; make sure of stability in a long time but being
changeable to be appropriate in line with each period.
The process of developing indicator system for measuring quality of
life must comply with the principles such as: targeted orientation;
systematization; concretization; accuracy; feasibility; international
comparability; adaptation; and efficiency.
Indicators are selected according to these criteria, include:
purposefulness, importance, validity and accuracy, relevance,
responsiveness, anticipation, understandability, availability and timeliness,
stability and reliability, outcome orientation, asset orientation, scale, clarity,
and representativeness.
Fundamentally, system of indicators measuring quality of life is
developed by hierarchical design in relation with theoretical approach. This
process results in a system of statistical indicators divided by 12 groups, of
which the 10 first groups measure 10 components of objective quality of
life, consisting of 48 indicators; group 11 measures subjective quality of
life and group 12 measures overall quality of life.
Each indicator in the system is presented comprehensively with
content, meaning, calculation method and data sources. The indicator
measuring subjective quality of life is not studied in the coverage of this thesis.
16
CHAPTER 3. DEVELOPING CALCULATION METHOD OF
QUALITY OF LIFE INDEX IN VIET NAM
3.1. Overview of methods of developing composite index
3.1.1. Concept and strengths, weaknesses of composite index
According to OECD (2008), composite index is an index which is
built on the basis of combining separated indicators based on basic model
of measured multi-dimensional concept.
Composite index is often used to explain about complex issues that
hardly grasp in large fields such as economics, society and environment. Its
strengths include: easy to explain, enable to have an overall look at
complex multi-dimensional issues to support decision makers; allow to
implement simple comparisons among nations, regions and localities, etc.
However, its weakness is to mislead easily policies if it is explained
incorrectly or process of developing composite index is not transparent or
not based on a sound conceptual framework. Besides that, high subjective
shown by selecting indicators and weights can be issue causing a lot of debates.
3.1.2. Calculation method of composite index
Currently, there are two methods of calculating composite index that
are paid much attention by researchers, particularly calculating composite
index of quality of life or similar indices. They are OECD’s method and
Alkire-Foster one. Generally, each method has its own strengths and
weaknesses. Selecting which method will depend mainly on data conditions
as well as socio-economic background of each nation.
However, the biggest challenge for Alkire-Forster method is to
require all data to be collected by the same survey to enable to identify
consistently missing objects in accordance with a certain criterion (Alkire
& Santos, 2011). Additionally, the lack of shortage thresholds of quality of
life in Viet Nam is also a big obstacle. Therefore, the author proposes to
develop the quality of life index in Viet Nam by method of OECD (2008).
3.1.3. Selection of calculation method for composite index
Method of developing composite index of OECD (2008) is relatively
complicated with different options in each step of the process, especially in
the contents of data standardization, determining weights and composite
method.
17
18
According to Mazziotta & Pareto (2013), 4 main factors to take into
account in the choice of the best method for calculating composite index
are as follows: (1) type of indicator (substitutable/non-substitutable); (2)
type of aggregation (simple/complex); (3) type of comparison (absolute/
relative); and (4) type of weights (subjective/objective). It depends on each
assumption, requirement and real condition to select appropriate solutions.
3.2. Propose calculation method of quality of life index in Viet Nam
The thesis proposes the composing of Vietnam quality of life index
including the following steps: (1) Developing the theoretical framework;
(2) Selecting indicators; (3) Normalization of data; (4) Determining
weights; and (5) Calculating component indices and the composite index.
Steps 1 and 2 have been solved in detail in the first two chapters of
the thesis. The methods in steps 3, 4 and 5 will be selected based on
suggestions of Mazziotta & Pareto (2013), available data and the ability to
apply in practice.
3.2.1. Normalization of Data
Normalization to ensure comparability across indicators is required
prior to data aggregation.
The thesis chooses Min-Max to normalize data for its simplest and
most common normalization procedure. Then, all normalized indicators
have the same range of variation (0.1), but not necessarily the same
variance. The higher normalized indicator is, the better quality of life is.
ܺே௭ௗ =
ܺோ − ܺெ
ܺெ௫ − ܺெ
(3.1)
In case of highly skewed indicators, we should use the logarithmic
transformation, as follow.
ܺே௭ௗ =
ln(ܺோ ) − ln(ܺெ )
(3.2)
ln(ܺெ௫ ) − ln(ܺெ )
In case of negative indicators, normalization is used to transform the value
into positive orientation. Then the normalized equation is defined as follows:
ܺே௭ௗ =
ܺெ௫ − ܺோ
ܺெ௫ − ܺெ
(3.3)
In case of indicators having optimal value, meaning that the value of
these indicators should be close to a certain central value (the optimal
threshold). The normalized equation is defined as follow:
ܺே௭ௗ = 1 −
|ܺோ − ܺ௧ |
ܺெ௫ − ܺெ
(3.4)
For indicators which have absolute value/or ratio value/or value per
capita, the minimum and maximum values are determined based on the
respective minimum and maximum values in practice; or the actual values
achieved in units (i.e. provinces) for many years (it is advisable to widen
the achievement gap); or the minimum and maximum values established by
international organizations for published indicators.
For indicators which have percentage value, the thesis chooses the
minimum value as 0 and the maximum value as 100.
3.2.2. Weighting
Determining weights is a source of contention. In general, weights
should be selected in connection with both the theoretical framework and
the data properties.
Weights can be defined objectively or subjectively. Objective
weights are determined by statistical methods based on mathematical
models, therefore, they are more objective and less controversial. However,
due to lack of accordant data, it is impossible for the thesis to use these
methods to determine the objective weights.
The subjective weights will be used to calculate the quality of life
index in Vietnam. Since the structure of the quality of life concept is
composed of several dimensions, we must calculate the component indices
before calculating the composite index. Based on the results of in-depth
expert interviews and available data, the thesis chooses equal weights for
individual indicators in calculating component indices but unequal weights
for components in calculating the composite index.
The budget allocation approach (BAP) is used to determine unequal
weights for components of the quality of life. This is a method of
determining subjective weights based on expert interviews.
3.2.3. Aggregation
In general, the choice of how the index is aggregated depends on the
view about whether compensability between individual indicators or
dimensions is allowed.
In this thesis, the arithmetic mean should be used to calculate
components indices. It means that compensation among indicators in each
dimension is allowed. Because of equal weights among indicators in each
dimension, the component indices are calculated by simple mean formula:
ܫ =
∑
ୀଵ ܺே௭ௗ ݆
݉
19
20
തതതതത
݊); n is the number
where ܫ is component index of dimension i (i=1,
of components; ܺே௭ௗ ݆ is value of individual indicator j after
തതതതതത
normalization in each component (j=1,
݉); and m is the number of
indicators in each component.
However, with a view of partially compensation, that the quality of
life index should be calculated by geometric mean will encourage the equal
development of all quality of life’s components in Vietnam. Because of
unequal weights among components, the quality of life index is calculated
by weighted geometrics mean, as follow:
=ܫ
∑
ඩෑ ܫ
ୀଵ
(3.5)
(3.6)
where I is the quality of life index; Ii is the component index I; fi is
weight of the component index i.
According to the United Nations’s experience when developing the
Human Development Index, the author proposes to evaluate the quality of
life in Vietnam depending on the index’s value as follows.
Table 3.1. Value framework of the quality of life index in Viet Nam
Value of the quality of life index
I < 0,3
0,3 ≤ I < 0,5
0,5 ≤ I < 0,7
0,7 ≤ I < 0,8
0,8 ≤ I < 0,9
I ≥ 0,9
Conclusion
Very low quality of life
Low quality of life
Medium quality of life
Fairly high quality of life
High quality of life
Very high quality of life
Source: Author’s suggestion.
3.3. Pilot calculate the quality of life index in Viet Nam
3.3.1. Result of pilot calculating the quality of life index in Viet Nam
Due to the heterogeneous spatial and temporal data, the thesis only
calculates the quality of life index in Vietnam at the national level in 2016. In
addition, this composite index is calculated based on 10 groups of indicators
measuring the objective quality of life because of unavailable data on the
satisfaction with life.
48 individual indicators are normalized by the Min-Max
transformation with the minimum and maximum values determined as stated
in section 3.2.1.
The weightings of the component indices are determined by the BAP
method using the constant sum scaling. The mean score of each component is
the basis for determining the weight of that component. Besides, pair sample
t-test is useful to examine whether there is a significant difference in mean
scores among the quality of life’s dimensions. Results show that 10 quality of
life’s dimensions can be divided into 4 groups. Then, weight of each
dimension in each group is calculated by simple mean of mean scores of all
dimensions in that group dividing by 10. Hence, sum of weights is 10. As a
result, weight of each component in group 1 (economic conditions) is 1.9;
group 2 (housing conditions, education, health and family relationship) is
1.2; group 3 (nature environment and social environment) is 0.9; and group 4
(participating community, governance and political voice) is 0.5.
Component indices are calculated according to formula 3.5, which is
the simple mean of normalized indicators.
Table 3.7. Results of calculating component indices
No
1
2
3
4
5
6
7
8
9
10
Component
Economic conditions
Housing conditions
Education
Health
Family relationship
Participating community
Natural environment
Social environment
Governance
Political voice
Symbol
I1
I2
I3
I4
I5
I6
I7
I8
I9
I10
Component index
0.617
0.791
0.608
0.695
0.864
0.574
0.601
0.733
0.572
0.564
Source: Author’s own calculation.
The composite index is calculated by using the formula 3.6. As a
result, with the value of 0.671, the achievement of quality of life in
Vietnam is at medium level.
21
22
Issues raised from results of pilot calculation
Based on the results of pilot calculation, the thesis finds out some
issues as follows: (1) data used for calculating composite index is relatively
plentiful and available from official sources; (2) applying the
aforementioned methodology to calculate the quality of life index in Viet
Nam guarantees science and feasibility; (3) expert method, particularly
BAP is relatively easy to apply with low cost but brings relatively accurate
results when determining weights; (4) calculated results are relatively
conformity with currently real situation.
However, results from pilot calculation still reveal some limitations,
mainly due to lack of data. Therefore, calculated quality of life index only
consists of 10 components measuring objective quality of life. The
relationship between subjective and objective quality of life is not
mentioned yet. In addition, pilot calculation is only fulfilled at national
level in one year so it limits comparability and assessment of quality of life
over time and space. Results from pilot calculation are not compared,
checked correlation to indicators, indices reflecting similar concepts.
3.4. Recommendations to improve method of developing and
calculating the quality of life index in Viet Nam
The thesis exists some limitations as follows: (1) indicator system
measuring quality of life is not really complete, needs supplementing and
more improving; (2) subjective quality of life is not measured; (3)
relationship between subjective and objective quality of life is not
mentioned yet; (4) inherent subjective in the process of developing and
calculating quality of life index is unavoidable; and (5) assessment on
robustness and sensitivity of index is not implemented as well as
connection between index and other related indicators, indices is not done.
Thus, the author suggests continuing to develop researches on
quality of life and similar themes in the future. Particularly: (1) improve
theoretical framework on quality of life in Viet Nam, especially by
developing quality of life scale; (2) study to develop satisfaction with life
scale; (3) agencies of data production should comply strictly with
regulations on production and dissemination of data; (4) expanding
research on quality of life in Viet Nam to provincial level to meet
requirements of comparing spatial quality of life; (5) study to better
improve calculation methodology of quality of life index in Viet Nam; and
(6) integrate quality of life index in the list of national statistical indicators
to be calculated annually.
CONCLUSION FOR CHAPTER 3
3.3.2.
The objective of chapter 3 is to propose method of calculating the
quality of life index in Viet Nam in a scientific and feasible manner.
On the basis of studying calculation method of composite index,
experience of the international organizations and nations in composing
composite index and similar indices, data condition and author’s research
capacity, the thesis propose calculation method of the quality of life index
in Viet Nam consisting of 5 steps: (1) develop theoretical framework on
quality of life; (2) select indicator system; (3) normalize data; (4) determine
weights and (5) calculate component indices and composite index. The first
2 steps of the process are presented in the chapter 1 and chapter 2 of the
thesis. The last 3 steps are discussed in chapter 3.
The author chooses Min-Max transformation to normalize data. The
minimum and maximum values are defined based on the properties of the
indicator.
The subjective weight is the same for each individual indicator when
calculating the component index and different for each component when
calculating the quality of life index by method of budget allocation process.
With the viewpoint of allowing compensability among indicators in
one component, thus arithmetic mean is used to calculate component
indices; but it only allows partly compensability among components so
geometric mean is used to calculate composite index of quality of life.
The result of pilot calculation with data in 2016 shows that the
quality of life in Viet Nam is at medium level with the value of 0.671.
On the basis of analysis, the thesis points out some limitations of the
research and proposes some recommendations to improve contents of the
research in the future.
23
24
CONCLUSION
Over the past years, the quality of life has been a subject attracting
the attention of many researchers, policy makers, and people all over the
world. In Viet Nam, although quality of life is an issue that has been raised
in national agendas, research on quality of life is still limited. In fact, the
quality of life of the Vietnamese people is improving relatively slowly and
being evaluated by many international organizations at low level in
comparison with other countries in the world.
The thesis is done with the desire to contribute to fill a small corner
of the large research gap in quality of life in Viet Nam. With the main
objective of proposing the method of developing and calculating composite
index to measure quality of life in Viet Nam, the thesis has in turn
answered the research questions.
Research results show that there are many different approaches to
studying and measuring quality of life. However, with Viet Nam’s current
development perspective, quality of life in Viet Nam is closely associated
with human development, economic development, cultural development,
social justice and building a healthy and safe living environment.
Therefore, the thesis has chosen to study and measure quality of life
according to a capability approach in combination with a subjective wellbeing approach. By this way, quality of life in Vietnam is interpreted as:
“Quality of life is the extent to which objective human needs of living condition
are fulfilled in relation to personal perceptions of subjective wellbeing.” In
particular, objective quality of life includes 10 components: economic
conditions; housing conditions; education; health; family relationship;
participating in community; natural environment; social environment;
governance; and political voice. Subjective quality of life is measured by
subjective well-being with the component of satisfaction with life.
Based on the concept of quality of life and its construct, the thesis
proposes a statistical indicator system to measure quality of life in Viet
Nam. The statistical indicator system to be built must meet the basic
requirements and ensure certain principles. Selected indicators for this
system are based on defined criteria. According to the hierarchical design,
the indicator system measuring quality of life includes 12 groups of
indicators, of which the first 10 groups include 48 individual indicators
measuring objective quality of life; the 11th group measures subjective
quality of life and the 12th group measures the composite index.
The thesis proposes the method of calculating the quality of life
index in Vietnam on the basis of studying the method of calculating the
composite index in general and the world’s quality of life index in
particular. In general, this index is calculated by the methodology proposed
by OECD (2008) but with a simpler process. The methods used in this
process are selected to suit each other, in accordance with the data
conditions as well as the practical application.
With the proposed method, the thesis has calculated quality of life
index for 2016 at the national level. Since there are no data reflecting
satisfaction with life, the quality of life index includes only 10 components
that measure the objective aspect of quality of life in Viet Nam. The value
of the composite index calculated by 0.671 shows that, quality of life in
Viet Nam is only at medium level.
Although the goal has been achieved, but because this is a new
research topic, moreover, the limitation of qualifications, resources and
time, the research results are still limited, such as: the indicator system
measuring quality of life also lack many indicators to reflect the ‘real’
quality of life; the subjective quality of life is not measured; the
relationship between objective and subjective quality of life is not studied;
the robustness and sensitivity of the index is not evaluated yet, the
subjectivity in the selection of indicators and methods, etc.
Therefore, the thesis proposes to continue to develop studies on
quality of life and similar theme such as happiness, satisfaction with life,
etc. in the future. Studies should focus on improving the theoretical
framework of quality of life; developing a satisfaction with life scale;
studying the relationship between subjective and objective quality of life,
especially in calculating quality of life index; studying the factors which
affect quality of life; expanding the research to regional and province,
completing the method of calculating quality of life index, etc. In addition,
the thesis also recommends that data production agencies need to comply
with regulations on production and publication of data under their rights
and responsibilities; integrating quality of life index into the list of national
statistical indicators to be calculated and published annually.
Although there are many limitations, the author hopes that the thesis
will contribute to the development of relatively new research field in
quality of life in Viet Nam. The results of the thesis will help researchers
and policy makers get the overall "view" of quality of life as well as its
aspects. These are good scientific bases and evidences for policy making in
Viet Nam to improve quality of life of the people.
25
LIST OF PUBLISHED WORKS
1. Nguyen Thi Xuan Mai (2018). ‘Measuring the quality of life in
Vietnam’. Eurasian Journal of Social Sciences, 6(4), 2018. DOI:
10.15604/ejss.2018.06.04.001. Online ISSN: 2148-0214. Trang 1-13.
2. Nguyễn Thị Xuân Mai (2018). ‘Kiểm định thang đo sự hài lòng với
cuộc sống ở Việt Nam’. Tạp chí Kinh tế và Phát triển, số 252 (II),
tháng 6/2018. ISSN: 1859-0012. Trang 11-19.
3. Nguyễn Thị Xuân Mai (2018). ‘Một số phương pháp xác định trọng số
khi tính chỉ số tổng hợp đo lường các hiện tượng kinh tế, xã hội’. Tạp
chí Con số và Sự kiện, số 533, tháng 4/2018. ISNN 0866-7322. Trang
48-49.
4. Nguyễn Thị Xuân Mai (2017), 'Nghiên cứu khía cạnh chủ quan trong
khái niệm chất lượng cuộc sống’. Kỷ yếu Hội thảo khoa học quốc gia:
Các vấn đề kinh tế-xã hội trong thực hiện các Mục tiêu phát triển bền
vững (SDG) 2030 của Việt Nam. Đại học Kinh tế quốc dân, Viện Dân
số và các vấn đề xã hội. NXB Lao động Xã hội, 6/2017. Trang 100-108.
5. Nguyễn Thị Xuân Mai (2016), ‘Đo lường chất lượng cuộc sống ở Việt
Nam: cách tiếp cận chủ quan hay khách quan’. Tạp chí Kinh tế và Phát
triển, số 232 (II), tháng 10/2016. ISSN: 1859-0012. Trang 15-22.
6. Nguyễn Thị Xuân Mai (2016), ‘Quality of Life dimensions in Viet
Nam’. International Conference Proceedings: Emerging issues in
Economics and Business in the context of international intergration
(EIEB 2016), Volume 02, Hanoi, November 4, 2016. National
Economics University Press. Trang 54-68.
7. Nguyễn Thị Xuân Mai, Nguyễn Đăng Khoa (2015), ‘Hệ thống chỉ tiêu
thống kê phản ánh chất lượng cuộc sống ở Việt Nam’. Kỷ yếu Hội thảo
khoa học quốc tế: Hoàn thiện hệ thống chỉ tiêu Kế hoạch phát triển
Kinh tế - Xã hội. Ban Kinh tế Trung ương, Đại học Kinh tế quốc dân,
Ngân hàng thế giới, Ủy ban kinh tế của Quốc hội, Hà Nội, 6/2015,
trang 103-113.