Apress pro SQL server 2008 analytics delivering sales and marketing dashboards may 2009 ISBN 1430219289 pdf
Bạn đang xem bản rút gọn của tài liệu. Xem và tải ngay bản đầy đủ của tài liệu tại đây (8.25 MB, 282 trang )
CYAN
MAGENTA
YELLOW
BLACK
PANTONE 123 C
Books for professionals by professionals ®
Pro SQL Server 2008 Analytics:
Dear Reader,
Brian Paulen
Jeff Finken
Companion eBook
See last page for details
on $10 eBook version
When implementing an analytics solution, the primary goal is to give corporate
decision makers and information workers the right information, in the right
format, at the right time. This enables them to take actions that will lead to the
attainment of corporate objectives. Attaining this goal requires that companies
meet the challenges of clearly understanding what metrics are critical to grow and
manage the business, selecting and implementing appropriate technologies, and
recognizing that analytics initiatives require continual improvement to keep up
with changes in the business.
In this book, our goal is to provide you with an incremental approach that
allows you to effectively leverage the core Microsoft business intelligence (BI)
platform made up of SQL Server 2008 and SharePoint to deliver a comprehensive
analytics solution. While many analytics books focus solely on the technical
components that make up reports and dashboards, we also explore the business
approach necessary to define good metrics, the range of available Microsoft
technologies, and implementation suggestions that will help to ensure the analytics initiative is a success. This combined functional and technical approach
will provide you with the breadth and depth necessary to recognize full value
from your investment.
The book surrounds technical information on the Microsoft BI platform,
especially SQL Server 2008, with the functional information necessary to successfully implement an analytics solution and realize its true value. Specifically,
we will begin by providing information on project preparation and overall keys
to success. Subsequent chapters focus on how to implement the platform, and
we will finish with implementation suggestions and information on how we
have successfully implemented solutions for past customers.
We hope you enjoy this book and are able to take full advantage of the information it provides.
Brian Paulen and Jeff Finken
Madrona Solutions Group
Pro SQL Server 2008
Analysis Services
SQL Server 2008
Analytics
Delivering Sales and Marketing Dashboards
Create at-a-glance dashboards showing
key performance indicators to guide your
business to success
Pro SQL Server 2008
Analytics
ISBN 978-1-4302-1928-6
54999
US $49.99
Shelve in
Databases/SQL Server
Paulen,
Finken
SOURCE CODE ONLINE
User level:
Intermediate
Pro
THE APRESS ROADMAP
Accelerated
SQL Server 2008
www.apress.com
Companion
eBook
Available
Pro SQL Server 2008 Analytics
Delivering Sales and Marketing Dashboards
The EXPERT’s VOIce ® in SQL Server
Brian Paulen and Jeff Finken
Foreword by Bryan Nielson
Director, Worldwide Product Marketing
Microsoft Dynamics CRM and CRM Analytics
Microsoft Corporation
9 781430 219286
this print for content only—size & color not accurate
spine = 0.651" 280 page count
Paulen_19286 FRONT.fm Page i Friday, May 1, 2009 5:01 PM
Pro SQL Server 2008
Analytics
Delivering Sales and
Marketing Dashboards
■■■
Brian Paulen and Jeff Finken
Paulen_19286 FRONT.fm Page ii Friday, May 1, 2009 5:01 PM
Pro SQL Server 2008 Analytics: Delivering Sales and Marketing Dashboards
Copyright © 2009 by Brian Paulen and Jeff Finken
All rights reserved. No part of this work may be reproduced or transmitted in any form or by any means,
electronic or mechanical, including photocopying, recording, or by any information storage or retrieval
system, without the prior written permission of the copyright owner and the publisher.
ISBN-13 (pbk): 978-1-4302-1928-6
ISBN-13 (electronic): 978-1-4302-1929-3
Printed and bound in the United States of America 9 8 7 6 5 4 3 2 1
Trademarked names may appear in this book. Rather than use a trademark symbol with every occurrence
of a trademarked name, we use the names only in an editorial fashion and to the benefit of the trademark
owner, with no intention of infringement of the trademark.
Lead Editors: Mark Beckner, Jonathan Gennick
Technical Reviewer: Vidya Vrat Agarwal
Editorial Board: Clay Andres, Steve Anglin, Mark Beckner, Ewan Buckingham, Tony Campbell,
Gary Cornell, Jonathan Gennick, Michelle Lowman, Matthew Moodie, Jeffrey Pepper, Frank Pohlmann,
Ben Renow-Clarke, Dominic Shakeshaft, Matt Wade, Tom Welsh
Project Manager: Sofia Marchant
Copy Editor: Heather Lang
Associate Production Director: Kari Brooks-Copony
Production Editor: Katie Stence
Compositor: Susan Glinert
Proofreader: April Eddy
Indexer: BIM Indexing & Proofreading Services
Artist: April Milne
Cover Designer: Kurt Krames
Manufacturing Director: Tom Debolski
Distributed to the book trade worldwide by Springer-Verlag New York, Inc., 233 Spring Street, 6th Floor,
New York, NY 10013. Phone 1-800-SPRINGER, fax 201-348-4505, e-mail , or
visit .
For information on translations, please contact Apress directly at 2855 Telegraph Avenue, Suite 600,
Berkeley, CA 94705. Phone 510-549-5930, fax 510-549-5939, e-mail , or visit http://
www.apress.com.
Apress and friends of ED books may be purchased in bulk for academic, corporate, or promotional use.
eBook versions and licenses are also available for most titles. For more information, reference our Special
Bulk Sales–eBook Licensing web page at />The information in this book is distributed on an “as is” basis, without warranty. Although every precaution
has been taken in the preparation of this work, neither the author(s) nor Apress shall have any liability to
any person or entity with respect to any loss or damage caused or alleged to be caused directly or indirectly
by the information contained in this work.
The source code for this book is available to readers at . You will need to answer
questions pertaining to this book in order to successfully download the code.
Paulen_19286 FRONT.fm Page iii Friday, May 1, 2009 5:01 PM
Contents at a Glance
Foreword . . . . . . . . . . . . . . . . . . . . . . . . . . . . . . . . . . . . . . . . . . . . . . . . . . . . . . . . . . . . . . . . . . . . . . ix
About the Authors . . . . . . . . . . . . . . . . . . . . . . . . . . . . . . . . . . . . . . . . . . . . . . . . . . . . . . . . . . . . . . . xi
About the Technical Reviewer . . . . . . . . . . . . . . . . . . . . . . . . . . . . . . . . . . . . . . . . . . . . . . . . . . . . xiii
Acknowledgments . . . . . . . . . . . . . . . . . . . . . . . . . . . . . . . . . . . . . . . . . . . . . . . . . . . . . . . . . . . . . xv
■CHAPTER 1
An Overview of Analytics . . . . . . . . . . . . . . . . . . . . . . . . . . . . . . . . . . . . . . 1
■CHAPTER 2
Seven Keys to Successful Reporting Projects . . . . . . . . . . . . . . . . . . 23
■CHAPTER 3
Key Performance Indicators . . . . . . . . . . . . . . . . . . . . . . . . . . . . . . . . . . 37
■CHAPTER 4
Microsoft Platform Components for Dashboards . . . . . . . . . . . . . . . 53
■CHAPTER 5
Core Components of SQL Server 2008 . . . . . . . . . . . . . . . . . . . . . . . . 99
■CHAPTER 6
SQL Server Analysis Services . . . . . . . . . . . . . . . . . . . . . . . . . . . . . . . 143
■CHAPTER 7
Performance Management . . . . . . . . . . . . . . . . . . . . . . . . . . . . . . . . . 171
■CHAPTER 8
Implementation and Maintenance of the Integrated System . . . 195
■CHAPTER 9
Case Studies . . . . . . . . . . . . . . . . . . . . . . . . . . . . . . . . . . . . . . . . . . . . . . . 223
■INDEX . . . . . . . . . . . . . . . . . . . . . . . . . . . . . . . . . . . . . . . . . . . . . . . . . . . . . . . . . . . . . . . . . . . . 251
iii
Paulen_19286 FRONT.fm Page iv Friday, May 1, 2009 5:01 PM
Paulen_19286 FRONT.fm Page v Friday, May 1, 2009 5:01 PM
Contents
Foreword . . . . . . . . . . . . . . . . . . . . . . . . . . . . . . . . . . . . . . . . . . . . . . . . . . . . . . . . . . . . . . . . . . . . . . ix
About the Authors . . . . . . . . . . . . . . . . . . . . . . . . . . . . . . . . . . . . . . . . . . . . . . . . . . . . . . . . . . . . . . . xi
About the Technical Reviewer . . . . . . . . . . . . . . . . . . . . . . . . . . . . . . . . . . . . . . . . . . . . . . . . . . . . xiii
Acknowledgments . . . . . . . . . . . . . . . . . . . . . . . . . . . . . . . . . . . . . . . . . . . . . . . . . . . . . . . . . . . . . xv
■CHAPTER 1
An Overview of Analytics
..................................1
Understanding Analytics . . . . . . . . . . . . . . . . . . . . . . . . . . . . . . . . . . . . . . . . 1
The Value of Analytics . . . . . . . . . . . . . . . . . . . . . . . . . . . . . . . . . . . . . . . . . . 2
Why Analytics Implementations Fail . . . . . . . . . . . . . . . . . . . . . . . . . . . . . . . 2
Environment Preparations . . . . . . . . . . . . . . . . . . . . . . . . . . . . . . . . . . . . . . . 4
Summary . . . . . . . . . . . . . . . . . . . . . . . . . . . . . . . . . . . . . . . . . . . . . . . . . . . . 22
■CHAPTER 2
Seven Keys to Successful Reporting Projects
. . . . . . . . . . . 23
The Seven Keys Approach . . . . . . . . . . . . . . . . . . . . . . . . . . . . . . . . . . . . . 23
Key 1: Developing Executive Sponsorship . . . . . . . . . . . . . . . . . . . . . . 23
Department Managers . . . . . . . . . . . . . . . . . . . . . . . . . . . . . . . . . . . . . 24
Senior Executives . . . . . . . . . . . . . . . . . . . . . . . . . . . . . . . . . . . . . . . . . 24
Key 2: Identifying Organizational Key Performance Indicators . . . . . . . . 24
Key 3: Delivering Structured, Ad Hoc Reports . . . . . . . . . . . . . . . . . . . . . . 25
Selecting Appropriate Technologies . . . . . . . . . . . . . . . . . . . . . . . . . . 25
Reviewing the Appropriate Microsoft BI Tools for Various
User Roles . . . . . . . . . . . . . . . . . . . . . . . . . . . . . . . . . . . . . . . . . . . . 27
Identifying and Prioritizing Final Phase-One
Solution Components . . . . . . . . . . . . . . . . . . . . . . . . . . . . . . . . . . . 30
Key 4: Ensuring Data Availability . . . . . . . . . . . . . . . . . . . . . . . . . . . . . . . . 32
Key 5: Proactively Reviewing Data Quality . . . . . . . . . . . . . . . . . . . . . . . . . 33
Key 6: Adjusting Core System Business Rules . . . . . . . . . . . . . . . . . . . . . 33
Key 7: Delivering Organization-wide Performance Management . . . . . . 34
Summary . . . . . . . . . . . . . . . . . . . . . . . . . . . . . . . . . . . . . . . . . . . . . . . . . . . . 35
v
Paulen_19286 FRONT.fm Page vi Friday, May 1, 2009 5:01 PM
vi
■C O N T E N T S
■CHAPTER 3
Key Performance Indicators
. . . . . . . . . . . . . . . . . . . . . . . . . . . . . . 37
Keeping KPIs Forward Looking . . . . . . . . . . . . . . . . . . . . . . . . . . . . . . . . . . 37
Understanding the Core Principles for KPIs . . . . . . . . . . . . . . . . . . . . . . . . 39
Using Specific Metrics . . . . . . . . . . . . . . . . . . . . . . . . . . . . . . . . . . . . . 39
Ensuring Clear Metric Ownership . . . . . . . . . . . . . . . . . . . . . . . . . . . . 40
Keeping Metrics Measurable . . . . . . . . . . . . . . . . . . . . . . . . . . . . . . . . 40
Using Timely Metrics . . . . . . . . . . . . . . . . . . . . . . . . . . . . . . . . . . . . . . 40
Limiting the Quantity of KPIs for a Given Scorecard . . . . . . . . . . . . . 40
Assigning Targets to KPIs . . . . . . . . . . . . . . . . . . . . . . . . . . . . . . . . . . 41
Aligning the KPI with Organizational Goals . . . . . . . . . . . . . . . . . . . . 41
Developing a KPI Step By Step . . . . . . . . . . . . . . . . . . . . . . . . . . . . . . . . . . 41
Assembling a Team to Define KPIs . . . . . . . . . . . . . . . . . . . . . . . . . . . 42
Categorizing Potential Metrics. . . . . . . . . . . . . . . . . . . . . . . . . . . . . . . 42
Brainstorming Possible Metrics . . . . . . . . . . . . . . . . . . . . . . . . . . . . . 43
Prioritizing Draft Metrics . . . . . . . . . . . . . . . . . . . . . . . . . . . . . . . . . . . 43
Performing a Final Filter on Metrics . . . . . . . . . . . . . . . . . . . . . . . . . . 46
Setting Targets for Selected Metrics . . . . . . . . . . . . . . . . . . . . . . . . . 49
Combining the KPIs into a Scorecard . . . . . . . . . . . . . . . . . . . . . . . . . . . . . 51
Summary . . . . . . . . . . . . . . . . . . . . . . . . . . . . . . . . . . . . . . . . . . . . . . . . . . . . 51
■CHAPTER 4
Microsoft Platform Components for Dashboards
. . . . . . . . 53
Understanding the Analytics Pyramid . . . . . . . . . . . . . . . . . . . . . . . . . . . . . 53
Creating Basic Analytics . . . . . . . . . . . . . . . . . . . . . . . . . . . . . . . . . . . . . . . . 54
Step 1: Mapping KPIs to Source Systems . . . . . . . . . . . . . . . . . . . . . 55
Step 2: Identifying Specific Analytics Stakeholders . . . . . . . . . . . . . 58
Step 3: Prioritizing Scorecards and Reports . . . . . . . . . . . . . . . . . . . 59
Step 4: Developing Initial Reports and Dashboards . . . . . . . . . . . . . 61
Moving into Intermediate Analytics . . . . . . . . . . . . . . . . . . . . . . . . . . . . . . . 80
Step 1: Developing a Basic Analysis Services Cube . . . . . . . . . . . . 81
Step 2: Designing an Approach to Deliver Trend Data . . . . . . . . . . . 95
Step 3: Developing Your Data Mart and SSAS Cube . . . . . . . . . . . . 95
Step 4: Evaluating Limitations in Your BI Platform . . . . . . . . . . . . . 96
Considering Advanced Analytics . . . . . . . . . . . . . . . . . . . . . . . . . . . . . . . . . 96
Summary . . . . . . . . . . . . . . . . . . . . . . . . . . . . . . . . . . . . . . . . . . . . . . . . . . . . 97
■CHAPTER 5
Core Components of SQL Server 2008
. . . . . . . . . . . . . . . . . . . 99
Developing a Sales Manager Dashboard . . . . . . . . . . . . . . . . . . . . . . . . . 100
Developing the Marketing Campaign Dashboard . . . . . . . . . . . . . . . . . . 121
Summary . . . . . . . . . . . . . . . . . . . . . . . . . . . . . . . . . . . . . . . . . . . . . . . . . . . 141
Paulen_19286 FRONT.fm Page vii Friday, May 1, 2009 5:01 PM
■C O N T E N T S
■CHAPTER 6
SQL Server Analysis Services
. . . . . . . . . . . . . . . . . . . . . . . . . . . 143
Understanding Sales Trends . . . . . . . . . . . . . . . . . . . . . . . . . . . . . . . . . . . 144
Identifying the Sales Trend Measures . . . . . . . . . . . . . . . . . . . . . . . 145
Identifying the Sales Trend Dimensions . . . . . . . . . . . . . . . . . . . . . . 145
Tracking Search Engine Marketing . . . . . . . . . . . . . . . . . . . . . . . . . . . . . . 157
Indentifying the SEM Measures. . . . . . . . . . . . . . . . . . . . . . . . . . . . . 158
Identifying the SEM Dimensions . . . . . . . . . . . . . . . . . . . . . . . . . . . . 158
Summary . . . . . . . . . . . . . . . . . . . . . . . . . . . . . . . . . . . . . . . . . . . . . . . . . . . 170
■CHAPTER 7
Performance Management
. . . . . . . . . . . . . . . . . . . . . . . . . . . . . . 171
Defining “Performance Management” . . . . . . . . . . . . . . . . . . . . . . . . . . . 171
Managing Sales Performance . . . . . . . . . . . . . . . . . . . . . . . . . . . . . . . . . 173
Creating the Dashboard Display . . . . . . . . . . . . . . . . . . . . . . . . . . . . 173
Drilling into the KPI Details . . . . . . . . . . . . . . . . . . . . . . . . . . . . . . . . 179
Managing Marketing Performance . . . . . . . . . . . . . . . . . . . . . . . . . . . . . 185
Summary . . . . . . . . . . . . . . . . . . . . . . . . . . . . . . . . . . . . . . . . . . . . . . . . . . . 193
■CHAPTER 8
Implementation and Maintenance of the
Integrated System . . . . . . . . . . . . . . . . . . . . . . . . . . . . . . . . . . . . . 195
Understanding the Project Management Phases . . . . . . . . . . . . . . . . . . 195
Beginning with the Envisioning Phase . . . . . . . . . . . . . . . . . . . . . . . . . . . 196
Identifying the Project Scope . . . . . . . . . . . . . . . . . . . . . . . . . . . . . . . 197
Calculating the ROI . . . . . . . . . . . . . . . . . . . . . . . . . . . . . . . . . . . . . . . 197
Selecting the Project Scope . . . . . . . . . . . . . . . . . . . . . . . . . . . . . . . . 198
Planning the Project . . . . . . . . . . . . . . . . . . . . . . . . . . . . . . . . . . . . . . 199
Initiating the Design Phase . . . . . . . . . . . . . . . . . . . . . . . . . . . . . . . . . . . . 203
Designing the Schema . . . . . . . . . . . . . . . . . . . . . . . . . . . . . . . . . . . 203
Designing the User Interface . . . . . . . . . . . . . . . . . . . . . . . . . . . . . . 204
Developing Use Cases . . . . . . . . . . . . . . . . . . . . . . . . . . . . . . . . . . . . 205
Working Through the Build Phase . . . . . . . . . . . . . . . . . . . . . . . . . . . . . . . 206
Moving into the Test Phase . . . . . . . . . . . . . . . . . . . . . . . . . . . . . . . . . . . . 206
Releasing the Solution During the Deployment Phase . . . . . . . . . . . . . . 208
Training Various Resources . . . . . . . . . . . . . . . . . . . . . . . . . . . . . . . . 209
Releasing the Solution . . . . . . . . . . . . . . . . . . . . . . . . . . . . . . . . . . . . 209
Maintaining the System . . . . . . . . . . . . . . . . . . . . . . . . . . . . . . . . . . . . . . 212
Performing Core Maintenance. . . . . . . . . . . . . . . . . . . . . . . . . . . . . . 213
Moving Past the Initial Implementation . . . . . . . . . . . . . . . . . . . . . . 214
vii
Paulen_19286 FRONT.fm Page viii Friday, May 1, 2009 5:01 PM
viii
■C O N T E N T S
Performing Overall Project Management Tasks . . . . . . . . . . . . . . . . . . . 217
Categorizing Project Management Tasks. . . . . . . . . . . . . . . . . . . . . 217
Using SharePoint As a Project Management Tool . . . . . . . . . . . . . . 220
Summary . . . . . . . . . . . . . . . . . . . . . . . . . . . . . . . . . . . . . . . . . . . . . . . . . . . 221
■CHAPTER 9
Case Studies
. . . . . . . . . . . . . . . . . . . . . . . . . . . . . . . . . . . . . . . . . . . . . 223
Case Study 1: Reporting in a Hosted Business Application
Environment . . . . . . . . . . . . . . . . . . . . . . . . . . . . . . . . . . . . . . . . . . . . . . 223
Identifying the Customer’s Challenges . . . . . . . . . . . . . . . . . . . . . . 223
Exploring the Solution . . . . . . . . . . . . . . . . . . . . . . . . . . . . . . . . . . . . 224
Seeing the Results . . . . . . . . . . . . . . . . . . . . . . . . . . . . . . . . . . . . . . . 234
Case Study 2: Implementing Embedded Analytics . . . . . . . . . . . . . . . . . 235
Identifying the Customer’s Challenges . . . . . . . . . . . . . . . . . . . . . . . 236
Exploring the Solution . . . . . . . . . . . . . . . . . . . . . . . . . . . . . . . . . . . . 236
Seeing the Results . . . . . . . . . . . . . . . . . . . . . . . . . . . . . . . . . . . . . . . 243
Case Study 3: Adding Web Analytics . . . . . . . . . . . . . . . . . . . . . . . . . . . . 244
Identifying the Customer’s Challenges . . . . . . . . . . . . . . . . . . . . . . 245
Exploring the Solution . . . . . . . . . . . . . . . . . . . . . . . . . . . . . . . . . . . . 246
Seeing the Results . . . . . . . . . . . . . . . . . . . . . . . . . . . . . . . . . . . . . . . 247
Summary . . . . . . . . . . . . . . . . . . . . . . . . . . . . . . . . . . . . . . . . . . . . . . . . . . . 249
■INDEX . . . . . . . . . . . . . . . . . . . . . . . . . . . . . . . . . . . . . . . . . . . . . . . . . . . . . . . . . . . . . . . . . . . . 251
Paulen_19286 FRONT.fm Page ix Friday, May 1, 2009 5:01 PM
Foreword
M
ost of you have long since started a promising analytics journey and have experienced the
deceptively rocky road firsthand, with only fleeting glimpses of the promise of fully realized
analytics. These challenges vary by organization, and issues can be data-driven, process-driven,
technology-driven, or often people-driven.
The result is that one or more of these obstacles, left unchecked, can lead to poor decision
making and operational misalignment with business strategy, which can be catastrophic for a
business, especially in the current economic climate where there is very little room for error.
Using applications, like Microsoft Dynamics CRM, that are designed to work the way your
people work, through familiar Microsoft Office and Outlook user interfaces, is one of the key
ways in which you can ensure that end users rapidly adopt your solution to capture necessary
customer data and context.
Oftentimes, organizations build analytics and dashboards solely for executives to monitor
and track historical activities. Keeping with the theme that analytics is a journey, this is similar
to driving a Maserati in first gear on a straight road—while fun to do, it doesn’t take advantage
of the car’s full potential or the reality of curved and winding roads. As a result, these organizations can be left far behind. Analytics and dashboards are not only the province of the executive
suite but have tremendous value to managers and individual sales and marketing professionals.
Implemented correctly, these can help users make better decisions and find root causes, empower
front-line marketing and sales users, improve operational efficiency, and drive action. The right
analytics delivered to the right users at the right time ensures organizational alignment for
executives, accountability for managers, and agility for end users. Business insight requires an
approach that is as sophisticated as the results you are trying to achieve.
Analytics is a journey on which your organization cannot afford to be left behind. Effective
and fully realized analytics will help you measure the past, understand the present, and even
project the future. Unlike using a Magic 8 Ball, marketing and sales analysis and forecasting is a
legitimate way for organizations to see a potential future based on today’s reality and to help
you make better decisions now to avoid upcoming disasters or improve capacity plans for
impending success.
To help in this journey, Microsoft Business Intelligence provides flexible and powerful lowcost analytical tools that can help organizations of all sizes with a wide variety of analytical
needs. Because this journey is different from organization to organization, relevant guidance
on how to take the key concepts and tasks associated with successful analytics projects and
implement them efficiently is required.
Pro SQL Server 2008 Analytics: Delivering Sales and Marketing Dashboards combines
important functional concepts with technical information on the available Microsoft Business
Intelligence tools to form an end-to-end guide for individuals and organizations looking to
successfully implement a powerful analytics solution. While Microsoft has always been committed
to providing powerful analytics tools, with the release of Microsoft SQL Server 2008, the tools,
graphics, and capabilities available to users and developers grew significantly.
ix
Paulen_19286 FRONT.fm Page x Friday, May 1, 2009 5:01 PM
x
■F O R E W O R D
In the end, being able to appropriately set the stage for your analytics engagement by
correctly defining requirements, selecting the appropriate Microsoft technologies, and working
through a proven implementation methodology will position you on the road to success. Brian
Paulen and Jeff Finken have written this book with you, the reader, in mind.
For analysts and executives, this book will provide the planning, requirement-gathering,
and project management tools necessary to ensure your implementation goes smoothly.
Developers, this book will enable you to further understand the tools available from Microsoft
and how they can most successfully be implemented in your organization by beginning with
basic steps and progressing to more advanced concepts.
Finally, for those using Microsoft Dynamics CRM 4.0 and Microsoft Office SharePoint,
additional exercises are provided to further enhance your usage of these applications.
This book is full of sensible concepts and direction for a successful analytics deployment
based on the authors’ real-world analytics and CRM projects and experiences. I’m confident
that this book can help your organization run a little smoother, and I hope you find this guide
as informative and useful as I have.
I wish you every success with your marketing and sales analytics journey.
Bryan Nielson
Director, Worldwide Product Marketing
Microsoft Dynamics CRM and CRM Analytics
Microsoft Corporation
Paulen_19286 FRONT.fm Page xi Friday, May 1, 2009 5:01 PM
About the Authors
■BRIAN PAULEN cofounded Madrona Solutions Group in July 2005.
He has overall responsibility for the firm’s growing business and for
managing client and partner relationships. Additionally, Brian works
to ensure that Madrona can offer an exciting and challenging “work”
environment for its employees.
Prior to founding Madrona Solutions, Brian was the director of the
CRM practice at a large consulting firm in the northwest, where he had
responsibility for sales and client delivery of CRM solutions. Earlier,
Brian was a member of the CRM team at Equarius (now EMC), working primarily with clients in
the pacific northwest. His career began at Accenture (formerly Andersen Consulting), working
out of their New York office.
Throughout his career, Brian has developed extensive project and program management
experience and is an expert in delivering strategic sales and marketing solutions for organizations large and small.
■JEFF FINKEN cofounded Madrona Solutions Group in July 2005 and
brings years of experience to Madrona’s Business Intelligence practice.
He brings a particular focus on working with sales, marketing, and
IT leaders to define key performance indicators that drive improved
organizational performance.
Jeff spends much of his time working hands-on with clients on both the
development of metrics as well as the technical implementation leveraging
the most appropriate tools from Microsoft’s Business Intelligence platform.
Throughout his career, Jeff has worked to deliver technology-driven sales and marketing
solutions for large organizations while working with Deloitte Consulting and Onyx Software.
xi
Paulen_19286 FRONT.fm Page xii Friday, May 1, 2009 5:01 PM
Paulen_19286 FRONT.fm Page xiii Friday, May 1, 2009 5:01 PM
About the Technical Reviewer
■VIDYA VRAT AGARWAL is a Microsoft .NET purist and an MCT, MCPD,
MCTS, MCSD.NET, MCAD.NET, and MCSD. He is also a lifetime member
of the Computer Society of India (CSI). He started working on Microsoft
.NET with its beta release. He has been involved in software development, evangelism, consultation, corporate training, and T3 programs
on Microsoft .NET for various employers and corporate clients. He has
been the technical reviewer of many books published by Apress and an
author for the Apress titles Beginning C# 2008 Databases: From Novice to
Professional, Beginning VB 2008 Databases: From Novice to Professional, and Pro ASP.NET 3.5 in VB
2008: Includes Silverlight 2Pro. His articles can be read at www.ProgrammersHeaven.com and his
reviews of .NET preparation kits at www.UCertify.com.
He lives with his beloved wife, Rupali, and lovely daughter, Vamika (“Pearly”). He believes
that nothing will turn into a reality without them and that his wife is his greatest strength. He
is the follower of the concept “no pain, no gain.” He is a bibliophile, and he blogs at http://
dotnetpassion.blogspot.com. You can reach him at
xiii
Paulen_19286 FRONT.fm Page xiv Friday, May 1, 2009 5:01 PM
Paulen_19286 FRONT.fm Page xv Friday, May 1, 2009 5:01 PM
Acknowledgments
W
e would like to begin by thanking the team at Madrona Solutions Group for their assistance
and patience as we worked through this process for the first time. Specifically, we would not
have been able to complete the work without technical guidance and extensive editing support
from Katie Plovie, Tri Pham, Phong Nguyen, and Megan Conyers. We truly appreciate the long
hours you have committed to make the book what it is. We can’t imagine how this could have
come together without your dedication, insight, and knowledge of SQL Server. We’d also like to
thank Julie Paulen for taking the time to review the book and helping us improve the overall
structure and flow. Finally, we would like to thank the team at Apress for giving us this opportunity.
Particularly, we are grateful for the work that Mark Beckner did getting us engaged in the process.
You have all been great people to work with.
Brian Paulen and Jeff Finken
I would like to thank my wife, Phoebe, for giving me the time and freedom to work on this project.
It took more time than I’d ever imagined. I want to also thank my daughter, Zoe, who continues
to grow and motivate me every day. Finally, I would like to thank Jeff for owning the tough parts
of this book. As always, it was a pleasure working with you on this project.
Brian Paulen
Deb, you are the best. You have been incredibly patient with the amount of time it took for this
project to come to completion, and I can’t tell you how much I have appreciated your support
every day. Gracie, you are always an inspiration, and your skeptical glances always cause me
to double-check my work. Finally, Brian, it is always enjoyable. I really did not know how this
would come together in the beginning, but it has been a great project, and I can’t tell you how
thankful I am for the steady approach you have brought to coordinating all the moving pieces.
Jeff Finken
xv
Paulen_19286 FRONT.fm Page xvi Friday, May 1, 2009 5:01 PM
Paulen_19286 C01.fm Page 1 Friday, May 1, 2009 2:38 PM
CHAPTER 1
■■■
An Overview of Analytics
M
ost organizations’ existing business applications deliver the capacity to store a wealth of
valuable data. The challenge is that this data loses its value when it is not readily available to
information workers and business executives in the right format on demand. Far too often,
sales managers don’t have visibility into their pipeline, and they can’t make clear decisions
about discounting, hiring, and resource allocation. Equally challenging are the situations when
finance professionals can’t effectively break down revenue and costs by product line and geography. Yet, with client after client, we encounter situations where significant time and effort
have been spent designing and deploying business applications without putting any investment
into the reporting. The result is that executives have little visibility into how their business is
performing, and information workers and IT professionals spend exorbitant amounts of time
manually pulling reports that become outdated almost as soon as they are delivered.
Understanding Analytics
A practical definition of “analytics” would be to think of them as the ways an organization
arrives at its decisions. Long-time organization employees may base decisions on historical
experience or gut feelings, while those more focused on data analytics or financials will focus
on the reports or information generated by frequently used applications.
Throughout this book, we will utilize the terms “business intelligence” (BI) and “analytics”
interchangeably. At the most fundamental level, we will be discussing the ability to leverage the
available Microsoft tools and data from within an organization to improve the decisions that
are made by people or groups of employees. Information can be accessed via a wide range of
tools in BI environments. On the simple end, for operational or ad hoc reporting, Microsoft
Office products (like Excel) can be combined with reports available within line of business
applications to gather enough data to make more informed decisions. Should more complex
reporting (often referred to as performance management) be necessary, products like SQL
Server Reporting Services, Microsoft SharePoint Server, and even Vista gadgets can be used to
provide varying views of information. Finally, analytics, or BI if you prefer, includes the ability
to present information to consumers where it makes the most sense for them, whether that is
via a desktop PC or a mobile device.
1
Paulen_19286 C01.fm Page 2 Friday, May 1, 2009 2:38 PM
2
CHAPTER 1 ■ AN OVERVIEW OF ANALYTICS
Projects involving analytics frequently include data from a wide range of sources. In addition
to the standard sources like customer relationship management (CRM) or enterprise resource
planning (ERP) applications, initiatives support the inclusion of data from an organization’s
web site, disparate spreadsheets, and single-purpose applications like dispatching tools or
e-mail marketing technologies.
While some of an organization’s data exists in these formats, much of it exists in an
unstructured format. Merrill Lynch estimates that more than 85 percent of all business information exists as unstructured data, commonly appearing in e-mails, notes, web pages, instant
message discussions, letters, general documents, and marketing information. With the growth
of the Internet, considering unstructured data is important. However, this book will focus
primarily on structured data and on providing the most valuable information to end users.
The Value of Analytics
Imagine running a business without the benefits of monthly financial information:
Put yourself in sales representatives’ shoes: what if they don’t have access to customer
satisfaction information before they head into a sales call?
Picture running the same marketing campaign over and over again, without being able to
completely understand the results, conversion rate, and overall return on investment.
These scenarios are examples of struggles that many organizations have when they’re not
able to synthesize data and present it in a manageable fashion.
Analytics are valuable because they can help individuals within an organization make wellinformed decisions. Whether evaluating employee performance, judging the historical and
predicted success of the business, or identifying the next investment opportunity, without
intelligent information people are simply guessing at the correct answer.
Why Analytics Implementations Fail
One significant source of concern is the ultimate failure of business intelligence initiatives
once the data has been gathered and presented. While this and other concerns seem obvious,
many implementations fail because of the following reasons:
• Differing priorities: End users, managers, and executives within an organization frequently
have varying priorities when it comes to managing data. Finding a solution that addresses all
user needs is critical. This can be accomplished by identifying a solution that delivers
the right level of analytics for each role within an organization, specifically:
• End users want information in a timely fashion that helps them better perform their
day-to-day activities. This data must be easy to find, specific to a role, and available
whenever and wherever the employee needs it.
Paulen_19286 C01.fm Page 3 Friday, May 1, 2009 2:38 PM
CHAPTER 1 ■ AN OVERVIEW OF ANALYTICS
• Managers need information that helps them evaluate the performance of their specific
business and/or employees. This information must be a summary but contain enough
detail for managers to provide feedback or change course as needed.
• Executives want data at a very high level. Information is often presented in a datadense format and at a high, rolled-up level.
• Data explosion: Organizations are capturing increasing amounts of data across a broad
array of locations. Many companies now have customer and prospect data spread between
business applications located on premises, in the cloud, and on local hard drives in Excel
and Access files. One of the great challenges facing analytics initiatives is the need to
standardize applications that serve as the system of record for key customer interactions.
At the same time, those organizations must architect analytics solutions that are adept
at pulling data from local servers and cloud-based web applications while applying
effective approaches to scrub and standardize this data to ensure that it performs well in
business metrics.
Failure to appreciate the need to define the system of record for key business data and to
architect for a heterogeneous data environment will lead to a failed analytics implementation: users won’t waste their time with scorecards and dashboards that report on only
a subset of key business data. As more and more data is introduced into an analytics
solution, the complexity of developing the solution and making the results consistent
rises. Identifying quick wins and a manageable set of data for each phase will greatly
improve the likelihood of project success.
• Trust: Employee trust in the data available to them and willingness to work with the
results are crucial to the ultimate success or failure of an analytics solution. While the
direct problem of having to work through reporting issues during a meeting is significant, the permeation of the subsequent distrust throughout the organization should be
given equal weight when addressing issues.
• Application adoption: Many times, BI initiatives fail because the underlying systems
have either poor-quality or incomplete data, which leads to limited usefulness from the
analytics tools. Failures of this kind demonstrate the need for BI projects to be concerned
with having a focus on delivering tools that help drive adoption of key underlying business systems.
• Software-driven projects: Frequently, we’re asked to visit a client who is struggling to
adopt an analytics solution. Invariably, the client has implemented the latest and greatest
business intelligence tool but hasn’t focused on deciding which metrics really matter for
the business and delivering these metrics in a role-based context. One thing this book
will do is to heighten the recognition that successful analytics projects must be driven by
the business and enabled by good technology choices. Both the software and the business are critical for success, and neither alone can lead to successful analytics projects.
3
Paulen_19286 C01.fm Page 4 Friday, May 1, 2009 2:38 PM
4
CHAPTER 1 ■ AN OVERVIEW OF ANALYTICS
Environment Preparations
To successfully navigate the exercises and code presented in future chapters, you need to
familiarize yourself with SQL Server 2008. You may already have a SQL Server 2008 environment
to use throughout this book; if you don’t, Microsoft also publishes a trial version of SQL Server
2008 Enterprise Edition for use. Please navigate to www.microsoft.com/sqlserver/2008/en/us/
trial-software.aspx to download the software and install it in your environment. Additionally, for
many of the scenarios presented in this book, having a platform or an application on which to
build reports and dashboards is important. Based on our experiences, we have chosen Dynamics
CRM and SharePoint as the tools used in these application-specific exercises. If you’re using
these tools, you will be able to implement the exercises in your environment. If you’re using a
different CRM or SharePoint-like application, the same concept can be implemented using
your application.
As anyone familiar with analytics knows, good data often makes or breaks reports, so as we
move through the exercises in the rest of this chapter, we will focus on setting up the SQL Server
environment and associated data to allow for the best exercises and examples in future chapters.
Finally, from time to time, Microsoft releases a 180-day trial Dynamics CRM Virtual PC
environment for evaluation by prospects and partners. If you would like to use this application,
please navigate to www.microsoft.com/downoads/en/default.aspx and search for Dynamic CRM
v4.0 to see if the VPC is currently available.
Exercise 1-1. Restoring the Database
Exercise 1-1 walks you through the steps associated with restoring a database in your SQL Server environment.
This data will be used in subsequent chapters to build reports and provide a structure for upcoming exercises.
1. Restore the CRMDB.bak file located on this book’s page of the Apress web site. Navigate to Start ➤
All Programs ➤ SQL Server 2008 ➤ SQL Server Management Studio.
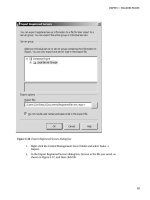
2. Create a new database by right-clicking the databases folder and clicking New Database. Type
Contoso_MSCRM in the “Database name” field, as shown in Figure 1-1.
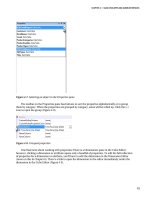
3. Restore the backup file by right-clicking the database and navigating to Tasks ➤ Restore ➤ Database
(see Figure 1-2).
Paulen_19286 C01.fm Page 5 Friday, May 1, 2009 2:38 PM
CHAPTER 1 ■ AN OVERVIEW OF ANALYTICS
Figure 1-1. Type the database name.
Figure 1-2. Restore the database.
5
Paulen_19286 C01.fm Page 6 Friday, May 1, 2009 2:38 PM
6
CHAPTER 1 ■ AN OVERVIEW OF ANALYTICS
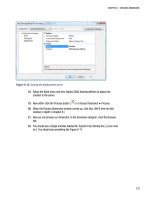
4. Select “From device”, and navigate to the location of the .bak file (see Figure 1-3).
Figure 1-3. Backup file location
5. Navigate to Options. Make sure “Overwrite existing database” is checked. Click OK to begin the restore
process. Once the database has restored successfully, close SQL Server Management Studio.
6. The restored database has built-in security that does not allow individuals to query the filtered views
without meeting specific security requirements. To ensure that you are able to see data in the views, edit the
SystemUserBase table and change the DomainName for AntonK to your own DomainName. For example,
if your domain is Adventureworks and your domain name is jsmith, you will input Adventureworks\JSmith
for the DomainName column of the SystemUserBase table on the row associated with AntonK.
Exercise 1-2 will enable you to familiarize yourself with another important reporting tool,
Microsoft Office Excel. This exercise will focus on installing the Data Mining Add-In. We’ve
found that, in deploying analystics solutions, most users are familiar with Excel’s pivot tables,
but more advanced functionality like data mining remains a mystery. Our goal with this example
is to provide a baseline for some of the advanced Excel functionality that we will delve into
more deeply in later chapters.
Paulen_19286 C01.fm Page 7 Friday, May 1, 2009 2:38 PM
CHAPTER 1 ■ AN OVERVIEW OF ANALYTICS
Exercise 1-2. Installing the Data Mining Add-In in Excel
This exercise will walk through installation and use of the Data Mining Add-In in Excel. To use the Data Mining Add-In
outside of the demonstration environment, Microsoft Office 2007 and Microsoft .NET Framework 2.0 must be installed.
1. Open Internet Explorer in your environment. Type the URL />details.aspx?familyid=896A493A-2502-4795- 94AE-E00632BA6DE7&displaylang=en. Download
the item displayed in Figure 1-4.
Figure 1-4. The Data Mining Add-In download
2. Run the Windows Installer Package you just downloaded. Accept the license agreement, and fill out any
remaining questions appropriately. In the Feature Selection page, click the drop-down next to each item
displayed in Figure 1-5, and select “This feature, and all subfeatures, will be installed on local hard drive.”
Figure 1-5. Data Mining Add-In setup
7