Nghiên cứu khả năng xử lý paraquat và DDT trong môi trường nước bằng vật liệu nano tio2 pha tạp fe, co, ni tt tiếng anh
Bạn đang xem bản rút gọn của tài liệu. Xem và tải ngay bản đầy đủ của tài liệu tại đây (1.92 MB, 28 trang )
MINISTRY OF EDUCATION
AND TRAINING
VIETNAM ACADEMY OF
SCIENCE AND TECHNOLOGY
GRADUATE UNIVERSITY SCIENCE AND TECHNOLOGY
……..….***…………
NGUYEN MANH NGHIA
STUDY ON THE POSSIBILITY OF TREATMENT PARAQUAT
AND DDT IN WATER ENVIRONMENT USING Fe, Co, Ni DOPED
TiO2 NANO MATERIAL
Major: Environmental Technology
Code: 9.52.03.20
SUMMARY OF DOCTORAL THESIS IN ENVIRONMENTAL TECHNOLOGY
Hanoi - 2019
The thesis has been completed at: Institute for Environemtal
Technology – Graduate university science and technology – Vietnam
Academy of Science and Technology
Science supervisor: Assoc. Prof. Dr Nguyen Thi Hue
Reviewer 1:
Reviewer 2:
Reviewer 3:
The thesis was defended at National level Council of Thesis Assessment
held at Graduate University of Science and Technology – Vietnam
Academy of Science and Technology at….on……
Thesis can be futher referred at:
-The Library of Graduate University of Science and Technology
-National Library of Vietnam
LIST OF PUBLICATIONS
1. Nguyen Manh Nghia, Nguyen Thi Hue, Ma Thi Anh Thu, Phung Thi Len,
Vu Thi Thu, Tran Dai Lam, Preparation and Characterization of Fe-Doped
TiO2 Films Covered on SiO2, Journal of Electronic Materials, 2016, 45(7),
3795–3800.
2. Nguyen Manh Nghia, Nguyen Thi Hue, Study on photocatalytic
properties of Fe-doped TiO2 coated on silica-gel, JOURNAL OF SCIENCE OF
VNU, 2016, 32(4), 24-29.
3. Phung Thi Len, Nguyen Manh Nghia, Nguyen Cao Khang, Duong Quoc
Van and Nguyen Thi Hue, Enhanced photocatalytic efficiency of TiO2 by doped
Ni- immobilized on SiO2, JOURNAL OF SCIENCE OF HNUE, Mathematical
and Physical Sci., 2016, 61(7), 151-156.
4. Dang Xuan Thu, Vu Quoc Trung, Nguyen Manh Nghia, Nguyen Cao
Khang, Tran Dai Lam, Effects of Fe Doping on the Structural, Optical, and
Magnetic Properties of TiO2 Nanoparticles, Journal of Electronic Materials,
2016, 45(11), 6033–6037.
5. Nguyen Thi Thanh Hai, Nguyen Manh Nghia, Nguyen Thi Hue, Nobuaki
Negishi, Photocatalytic degradation of formic acid in aqueous with Ni doped
TiO2 coated on SiO2, 2017, Vietnam Journal of Science and Technology 55
(4C), 174-179.
6. Nguyen Manh Nghia, Nobuaki Negishi, Nguyen Thi Hue, Enhanced
Adsorption and Photocatalytic Activities of Co-Doped TiO2 Immobilized on
Silica for Paraquat, Journal of Electronic Materials, 2018, 47(1), 692–700.
7. Tran Thi Minh Phuong, Nguyen Manh Nghia, Nguyen Thi Hue, Evaluate
Photocatalytic Activities of Ni doped TiO2 coated on SiO2, Tạp chí Phân tích
Hóa, Lý và Sinh học, 2018, 23 (1), 66-72.
8. Le Dien Than, Ngo Sy Luong, Vu Dinh Ngo, Nguyen Manh Tien, Ta Ngoc Dung,
Nguyen Manh Nghia, Nguyen Thai Loc, Vu Thi Thu, Tran Dai Lam, Highly Visible
Light Activity of Nitrogen Doped TiO2 Prepared by Sol–Gel Approach, Journal of
Electronic Materials, 2017, 46(1), 158-16.
INTRODUCTION
Insecticides, fungicides, herbicides in our country are mostly imported, semiauthorized, packaged and then marketed to farmers. Vietnam is importing these
chemicals from countries such as China, Germany, Japan, Switzerland, USA, India,
Taiwan, Singapore, Thailand .... Mostly from big chemical companies are Syngenta,
Mosanto, Baier, Du-pont, etc. The volume of chemicals imported has increased ten
times in the last 10 years, while the area of agricultural land has not increased.
Pesticides, fungicides and herbicides are used in most agricultural practices such as
growing rice, maize, potatoes, cassava, ....
The most commonly used herbicides and herbicides are Paraquat and DDT,
which play an important role in ensuring crop yields. But, nowadays, these are abuse,
dependence and misuse when farmers use these high toxic chemicals commonly in
crops.
Paraquat is fast acting and kills the tissues of the grass when exposed. It is used
extensively throughout the world due to its high water solubility, high herbicides and
low cost, however, it is very toxic to animals and humans. Due to over-use and
widespread use, it has caused great consequences to the quality of the surface water
and soil environment. Meanwhile, people in some mountainous areas in the North
such as Hoa Binh and Ha Giang still use spring water, which is the main source of
water for living and dining purposes. DDT is a persistent, persistent chemical that has
been banned for years, but its effects remain long-term.
For treatment of Paraquat (PQ) and DDT, catalytic, adsorption, and biological
technologies have been used. However, these post-processing methods often leave
unwanted by-products, which are costly to invest. Therefore, the development of
environmentally friendly methods for treating polluted water with PQ is a matter for
research to ensure the health of animals and humans.
To solve these problems, some advanced technologies, such as advanced
oxidation (AOP), was applied in decomposing organic pollutants, including
photocatalysts using materials nano Titandioxide (TiO2). Anatase TiO2 is non-toxic,
low cost, and high catalytic activity. However, pure TiO2 has a large band gap (3.2
eV), hence photocatalytic activity is stimulated by ultraviolet radiation which is very
small (<5%) in solar radiation energy. Therefore, to have the material TiO2
photocatalytic properties in the visible light region, the state-doped metal or nonmetal is usually generated between the valence band and the conduction band is used.
1
The photocatalytic activity of TiO2 nanoparticles increased considerably when doped
with non-metals, metals, or copper doped.
TiO2 has a weak affinity for organic pollutants, especially hydrophobic organic
pollutants and during photolysis, TiO2 nanoparticles are easily agglomerated,
preventing light from reaching the activated center. In addition, for the suspension
system, the recovery and reuse of TiO2 nanoparticles from treated water is difficult.
Therefore, to overcome these limitations. Fixed the photocatalytic material on the
support material (such as glass beads, glass plates, activated carbon, zeolite, ...) is
suitable. In particular, SiO2 has high porosity, large surface area of contact, so when
TiO2 coating on it increases the photochemical ability of TiO2 material for large
pollutants.
Therefore, to improve the application of TiO2 in water treatment pollution
pesticides, herbicides, thesis with title ”Study on the possibility of treatment
paraquat and ddt in water environment using Fe, Co, Ni doped TiO2 nano
material” was studied.
The purpose of the study
- The Fe, Co, Ni, Ti was applied into the TiO2 nanocrystals (10-15nm) to obtain the
doped material (Fe, Co, Ni-TiO2) immobilized on the silicagel to improve
photocatalytic activity in the visible light region.
- Investigate the structure, properties of synthesized materials and demonstrate
successfully the photocatalytic ability treated herbicide (Paraquat) and
organochlorine pesticides (DDT) in the aquatic environment.
Scientific and practical significance of the study
- Has proven the ability to decompose some persistent organic compounds as
organochlorine pesticides (DDT) and herbicide (Paraquat) using visible light sources
to replace th UV light source by Solar light.
- The products of the project are highly practical, reducing the cost of processing
when replacing the UV light source by solar energy if deploying pilot scale.
The main research activities
- Study on the optimal conditions for fabrication nanomaterial TiO2 doped Fe, Co, Ni
coated on SiO2.
2
- Research on structural, surface morphology, absorb light ability of fabricated
samples and their oxidation process in decomposing organic compouse (methylene
blue) in the water environment.
- Study and compare the capacity in decomposing Paraquat, DDT in water of the
fabricated materials by different light sources (UV light, visible light).
- Test applied in handling DDT, paraquat in stream water samples taken in the
communes in Mai Chau district, Hoa Binh province.
New findings of the thesis
- Has successfully in synthesis the photocatalytic material TiO2 doped Co, Ni, Fe
coated on SiO2 activating in the visible light region by sol-gel method. The structure
of materials are TiO2 anatase single phase with crystal size is about 10 nm.
- Has found that Fe-TiO2/SiO2 has the best photocatalytic capacity compared to NiTiO2/SiO2 and Co-TiO2/SiO2 materials, but the absorption capacity is the opposite.
The photocatalytic order was Fe- TiO2/SiO2 > Co- TiO2/SiO2 > Ni- TiO2/SiO2.
- Has found that under the influence of natural light, paraquat was completely
oxidized to NO3 - when using TiO2/SiO2 doped Co, whereas DDT was almost
unaffected.
- Has successfully decompose herbicides (representative of Paraquat) and pesticides
(representative of DDT) in surface water in real surface water using TiO2/SiO2 doped
Co under Solar light. Water after treatment reached QCVN 8: 2011 / BTNMT.
The structure of the thesis
The thesis consists of 106 pages with 12 tables, 56 figures, 143 references. The
thesis was composed of 3 pages, 28 pages of literature review, 18 pages of research
subjects and methods, 54 pages of research results and discussion, conclusion of 3
pages.
3
Chapter 0 CHAPTER 1: LITERATURE REVIEW
Compiled documents on: i) Current status of Paraquat and DDT pollution in the
water environment in the world and in Vietnam; ii) Methods of treatment Paraquat,
DDT; iii) pure TiO2 and doped TiO2; iv) Methods of fabrication TiO2 nanoparticles
coated on carrier materials. Research results show that pollution of water sources
with plant protection products can pose a serious threat to aquatic ecosystems and
drinking water. The emergence of pesticides in surface water, wastewater and
groundwater has led to finding appropriate measures to remove persistent pesticides.
Waste water pollution is pesticides have been treated by the above methods to ground
or high cost and unstable performance. Therefore, the development and selection of
pesticide-contaminated water treatment technologies is an important.
Currently, the process of photocatalytic TiO2 is fixed based on the carrier
material are interested in the field of environmental technology. In terms of
technology, the main objective of making up the carrier is TiO 2 removal catalyst
recovery stage after finishing treatment of polluted water. The carrier typically used
to attach TiO2 were glass, actived carbon and some polymers. The main
requirements is needed in a carrier attached TiO2 were heat resistance, has high
specific surface area, high adsorption of pollutants, chemical inertness
The methods commonly used for coating TiO2 on the carrier material: i)
deposition method; ii) plasma coating method; iii) hydrothermal method, iv) sol-gel
method. In particular, sol-gel method combined with impregnation is a simple
method that can be implemented in many laboratories in Vietnam to prepare
TiO2/SiO2.
Based on the review of the research materials, the thesis will focus on the
following issues:
- Provide optimal conditions for fabrication are impregnated TiO2 doped Fe, Co, Ni
nanomaterials coated on SiO2. Determine the structural characteristics, the surface
morphology of the material as well as the ability to absorb light and the ability to
handle organic compounds (methylene blue) in the aquatic environment of the
fabricated material
- Evaluation of processing capability of the material has built in handles Paraquat,
DDT in the aquatic environment by various light sources (UV, visible light). Test
4
applied in handling DDT, paraquat in some form nuoctrong real environment
CHAPTER 2: OBJECTIVES AND RESEARCH METHODS
2.1. The objectives of the thesis
- TiO2 doped Fe, Co, Ni coated on SiO2 with the concentration Fe, Co, Ni metal in
TiO2 catalysts ranges from 0 to 9%.
- Plant protection chemicals: pesticide DDT and herbicide Paraquat. Water samples
containing PQ, DDT of varying concentrations (10 ppm, 20 ppm, 50 ppm) were
mixed from standard and deionized water. Real water samples were taken in Mai
Chau district, Hoa Binh province for processing test PQ and collected at the stockpile
of Thanh Luu (Nghe An), Hon Tro (Ha Tinh) for DDT treatment.
2.2. Equipment
- Scanning electron microscopy (SEM), Hitachi S-4800, National Institute of hygiene
and epidemiology and SEM JSM 6010LA, AIST Institute, Japan to determine TiO2
grain size and TiO2 film thickness. Component analysis of the EDX elements in the
sample was also determined on this device.
- The XRD (D8 Advance - Bruker, Germany), which determines the crystal structure
of the samples, was performed at the laboratory of the Department of Chemistry at
the University of Natural Sciences.
- JEM1010 JEOL System at Chiao-Tung National University, Taiwan and TEM,
Tecnal Osiris 200kV, FEI at AIST Institute, Japan used for HR-TEM imaging.
- Jasco V670 was used in the determination of absorption spectra at Faculty of
Physics, Hanoi National University of Education with visible emission at
wavelengths from 200 nm to 800 nm.
- Adsorption isotherm methods - the adsorption of nitrogen adsorption performed on
3FLEX at Faculty of Physics, Hanoi National University of Education.
- High performance HPLC - UV / VIS LC (Perkin Elmer) liquid chromatography
analyzer used to determine the concentration of paraquat in water samples at a
wavelength of 260 nm was conducted at the Institute of Environmental Technology,
VAST.
- Shimadzu GC-ECD 2010 is used to measure the concentration of DDT and the UV5
VIS 2540, Shimadzu, Japan used to determine the methyl and green methyl
concentrations in samples analyzed at the Institute of Environmental Technology,
VAST.
2.3. Research methods
The research method used in the thesis is an experimental method that combines
experiments with the use of reference materials to investigate the effect of fabrication
conditions on the properties of materials and to present the to explain the relevant
effects.
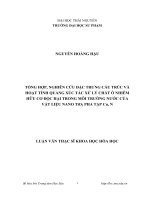
TiO2 doped Fe, Co, Ni coated on SiO2 is made based on sol-gel method combined with
the impregnation method according to the following diagram:
Figure 2.1. Process of synthesizing Ti1-xAxO2/SiO2 (A = Ni, Co, Fe)
The photocatalytic activity of TiO2 doped Fe, Co, Ni samples were evaluated
by the decomposition of MB, Paraquat and DDT in the dark, under UV and visible
light. Use 2 grams of material to treat 250mL of test substance with initial
concentration of 10 ppm. The test environment has a pH value of 6,5 – 7,5.
Processing system diagram is shown in Figure 2.4.
1
2
8
7
5
4
6
3
Figure 2.4. Photocatalytic testing system in the laboratory
6
Chapter 1 CHAPTER 3. RESULTS AND DISCUSSION
3.1. Research, identify the factors affecting to fabrication process TiO2 particles
coated on SiO2
SiO2 as carrier material is suitable for coating TiO2 by sol-gel method. In order
to obtain TiO2/SiO2 material with high specific surface area and good crystallinity
TiO2, the fabrication time is 60 minutes, the heating temperature is 500 oC, the cycle
of immersion, drying, heating are 8 times.
3.2. Characteristic, structure of TiO2 doped with Fe, Co, Ni coating on SiO2
3.2.1. Effects of doping concentration
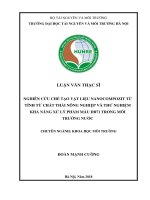
Figure 3.17a shows the XRD patterns of the fabricated materials. It can be seen
that the locations and relative intensities of the peaks in the obtained patterns are
highly consistent with the standard result for TiO2 in anatase form. The inset shows
that the cell parameters decreased with increasing Fe doping concentration. It
is noteworthy that the atomic radii of Fe2+ (0.64 nm) and Fe3+ (0.49 nm) are smaller
than that of Ti4+ (0.68 nm). Therefore, we suppose that a certain
amount of Fe2+ and Fe3+ ions was incorporated substitutionally into the TiO2 lattice at
Ti4+ sites, leading to the reduced global cell parameters.
Figure 3.17. (a) XRD patterns and (b) Raman spectra of Ti1-xFexO2 nanosamples.
Raman spectra of the Ti1-xFexO2 nanoparticles are shown in Fig. 3.17b. The
Raman spectrum of single-crystal anatase has been thoroughly investigated and is
reported to show six allowed modes appearing at 144 cm-1 (Eg), 197 cm-1 (Eg), 399
cm-1 (B1g), 513 cm1 (A1g), 519 cm-1 (B1g), and 639 cm-1 (Eg). Our spectra (Fig. 3.17b)
clearly show these six Raman-active modes with positions and intensities in good
agreement with reference values as previously determined for anatase TiO2. α-Fe2O3
and γ-Fe2O3 do not seem to exhibit prominent Raman bands, as TiO2 powders
7
containing these phases did not show any additional Raman peaks or
bands. Comparing the spectra, it is evident that the Raman bands shifted towards
lower wavenumber while their intensity decreased with increasing dopant content. In
addition, with increasing dopant content, the disorder increased, hence the ideal
symmetry would be destroyed, thus decreasing the Raman peak intensity. These
results support incorporation of Fe atoms at Ti sites in TiO 2. We cannot exclude the
presence of some clusters of Fe and iron oxides in the samples. However, the Raman
spectra along with the XRD results indicate substitution of Fe for Ti in the TiO2
lattice. It can be confirmed with the process of making samples by sol-gel method
that the thesis has done can do the Fe doped concentration up to 13%.
3.2.2. Evaluate the crystal structure
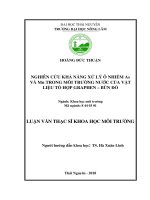
The XRD patterns recorded for Ti1-xAxO2/SiO2 with different doping contents
(A=Fe, Co, Ni; x = 0%, 1%, 3%, 6%, 9%) are given in Fig.3.18. For all samples,
there were only typical diffraction peaks of anatase TiO2 (JCPDS Cards No. 21-1272)
located at 25.3, 37.8, 48.2, 54.0 and 62.8 corresponding to planes <101>, <004>,
<200>, <105> and <204>, respectively. No characteristic peaks derived from metal
or metal oxides were observed.
Figure. 3.18. X-ray diffraction pattern of Ni (a), Co (b), Fe (c) and TiO2 JCPDS 211272 (Right, Bottom).
8
3.2.3. Evaluate the surface morphology and composition analysis
Correlation between the silicagel support and the resulting particle size of
titanium dioxide into them was confirmed by the HR-TEM micrograph. Figure 3.23
shows the high resolution transmission electron microscopy with EDX analysis of
Co-TiO2/SiO2 sample. The TEM image in Fig.3.23b repeseted that the particles have
spherical uniform and their diameter are 10nm. EDX analysis showed that the
element molar percent of O, Si, Co and Ti were 43.3%, 40.3%, 1.1% and 15.3%,
respectively. It is considered that the TiO2 crystals are uniformly distributed on the
silica gel by the EDX mapping as shown in Fig. 3.23c. Moreover, the concentration
distribution in each elemental image is roughly the same shape. This may be from
well dispersed TiO2 crystals on silica gel and Co connected with TiO2.
Figure 3. 1. FESEM (a), TEM images (b) and EDX mapping (c) of 9% Co doped TiO2
covered on silica gel sample.
Figure 3. 2. EDX spectrum of 9% Co doped TiO2 covered on silica gel sample.
9
3.2.4. Evaluate the absorption of light
The UV-vis spectrum was observed to investigate the optical properties of Ti 1xAxO2/silica
gel (A=Fe, Co, Ni). Figure 3.25 presents the changes in the absorption
spectra of Ti1-xAxO2/silica gel with the increase of metal dopant. As shown in Fig.
3.25, an obvious red shift to longer wavelength of the optical absorption edge on the
metal doped TiO2 samples as compared to pure TiO2 sample was observed. It clearly
showed that increasing the Co, Fe, NI doping level makes the optical band gap
reduce. The evolution of this broad band shows that the Co ion generates new
impurity states in the band gap of TiO2. These indicated that Fe, Co, Ni-doping could
be a promising approach for increasing the catalytic activity.
Figure 3. 3. Absorption spectra of Fe, Co, Ni doped TiO2/SiO2 sample
3.2.5. Evaluate the porosity of the material
To estimate the porosity of the samples, the N2 adsorption – desorption isotherm
was measured. Figure 3.26 shows the hysteresis of Ti1-xAxO2/silica gel at 77 K. The
hysteretic shape of all samples is related to the Brunauer Type IV isotherm, which is
characteristic of a mesoporous solid. On the other hand, the isotherms of Co, Fe, Ni
doped TiO2 were not different from the parent silica gel with specific surface area
143 m2/g, pore volume 0.57 cm3/g, pore size 154 Å.
10
Figure 3.26. The hysteresis of Ti1-xAxO2/silica gel at 77 K
3.2.6 Evaluate the possibility of photocatalytic fabricated material
We assessed the ability of the catalytic through decomposition experiment of MB
in solution. Fig. 3.28 displays the degradation of MB using Fe-TiO2/SiO2 material at
different times. When the concentration of doped from 0% to 9% of the remaining
MB concentration is 2.02; 2.94; 3.24; 6.18 and 7.74 ppm. The 3% Fe doped sample
showed the best performance in degradation MB. The performance of
Ti0.91Fe0.09O2/SiO2 sample was lower than Ti0,93Fe0,06O2/SiO2 ones maybe due to the
lighter resistance even higher Fe contents.
Figure 3.28. Results of degrading MB of Ti1-xFexO2/SiO2 samples in dark condition (a),
visible irradiation (b) with doping 0% (0), 1% (1), 3 % (2), 6 % (3), 9% (4).
11
Figure 3.29a is a graph showing the MB absorption of the Ti 1-xCoxO2/SiO2
sample system before illumination for 6h. We found that for the samples in the dark
after 3h, the MB concentration decreased negligible, almost unchanged. In particular,
Co 1% showed the strongest absorption and Co 9% showed the weakest absorption.
In particular, the photocatalytic potential of the Co 3% sample is best. Thus, a
concentration of 3% is the optimum concentration for a strong photocatalytic activity.
Figure 3.29. Results of degrading MB of Ti1-xCoxO2/SiO2 samples in dark condition (a),
visible irradiation (b) with doping 0% (0), 1% (1), 3 % (2), 6 % (3), 9% (4).
We assessed the ability of the catalytic through decomposition experiment of
MB in solution. Fig.4 displays the degradation of MB at different times. The
TiO2/SiO2 sample showed the highest adsorption of MB because of its large surface
area. It can be seen that Ni-doped TiO2 shows higher activity for degradation of MB
in an aqueous solution compared to pure TiO2. Moreover, Ni2+ activated an important
role in trapping the electrons and helps in charge separation, and therefore
photocatalytic activity is comparatively good. Ti0,93Ni0,06O2/SiO2 sample showed the
best performance in degradation MB. The performance of Ti0.91Ni0.09O2/SiO2 sample
was lower than Ti0,93Ni0,06O2/SiO2 ones maybe due to the lighter resistance even
higher Ni contents
Figure 3.30. Results of degrading MB of Ti1-xNixO2/SiO2 samples in dark condition (a),
visible irradiation (b) with doping 0% (0), 1% (1), 3 % (2), 6 % (3), 9% (4).
12
Remarks: The results of MB's performance testing of treatment doped materials
show that:
i) the ability of the photocatalyst Fe-doped sample to the largest but the adsorption
capacity of the smallest.
ii) compared to doped Fe, Ni or Co doped samples are less photocatalytic but have
better absorption capacity. In which, Co-doped samples showed better photocatalytic
efficiency than doped Ni samples.
3.3. Evaluation of Paraquat treatment of Fe, Co, Ni doped TiO2 covered on SiO2
3.3.1. Effect of doped elements
The photocatalytic activity of the TiO2 photocatalysts evaluated by the
photocatalytic degradation of 10 ppm PQ under 365nm UV, visible light irradiation
and dark condition is found in Fig. 3.34. It seems that the PQ concentration decreases
with progress of reaction, even in dark conditions for non-doped TiO2/silica gel. In
the case of the dark condition, it seems that the change of concentration almost
stopped after 30 min of circulation suggesting adsorption equilibrium. However,
under UV or visible light irradiation, the changes of PQ concentration resembled first
order kinetics. It seems that TiO2/silica gel had photocatalytic ability under UV-vis
light irradiation. For Co or Ni doped materials, the concentration of Paraquat was
significantly reduced and the PQ concentration was reduced similarly under visible
light conditions, 365 nm UV and even in the dark. In contrast to Fe-doped material,
the PQ concentration did not change even when illuminated by ultraviolet light.
13
Figure 3. 4. Photocatalytic degradation profiles of PQ aqueous solutions obtained in
a continuous reactor using TiO2 (A) and và TiO2 doped 9% Ni (B), Co (C), Fe (D)
covered on SiO2.
On the other hand, the reduction of PQ was not dependent on light irradiation
when the Co-doped TiO2 photocatalyst was used. As shown in Table 1, the specific
surface area of Co doped TiO2 photocatalyst was smaller than bare TiO2/silica gel
photocatalyst. However, as shown in Fig. 8, the formation of final product of PQ with
photocatalytic degradation was very small when compared with TiO 2/silica gel. This
result shows that the decrease of PQ concentration in the Ti 0.91Co0.09O2 system was
caused by adsorption. However, under UV or visible light irradiation, formation of
NO3- was observed. This final product of PQ was not observed under the dark
condition. One remarkable difference in photocatalytic tendency between TiO 2/silica
gel and Ti0.91Co0.09O2 is the formation of NH4+. Under visible light irradiation,
TiO2/silica gel photocatalyst only generated NH4+, while the Ti0.91Co0.09O2
photocatalyst generated only NO3-. It can be considered that the NO3- formation is the
result of NH4+ oxidation by photocatalysis. Photocatalytic activity of Ti 0.91Co0.09O2 is
lower than TiO2/silica gel, however, it is considered that the oxidation ability of
Ti0.91Co0.09O2 is higher than TiO2/silica gel under visible light irradiation. Therefore,
Ti0.91Co0.09O2/silica
gel
photocatalyst
showed
the
enhanced
visible
light
photocatalytic activity to oxidize paraquat compared to bare TiO 2/silica gel. This
enhancement could result from the reduction of band gap energy. The band gap of
Ti0.91Co0.09O2/silica gel (2.64 eV) was smaller than bare TiO2/silica gel (3.32 eV), and
hence under visible light irradiation, only electrons from the valence band of the Codoped sample could transfer into the conduction band. This means that e - - h+ pairs
14
were created and allowed to generate hydroxyl radicals OH [6]. The OH radical
was extremely strong such that paraquat was oxidized to the final product NH4+.
Figure. 3. 5. Time course of photocatalytic degradation of PQ and formation of
intermediates and/or final products by TiO2/silica gel in dark (a), visible light (b), UV light
(c) and Ti0.91Co0.09O2/silica gel in dark (d), visible light (e), UV light (f).
Remarks:
i) TiO2 coated on silica gel shows good performance in treatment PQ in water
environment when using 365 nm UV source activated. The PQ concentration in the
solution decreases due to both the adsorption and photocatalytic processes as
illustrated in Figure 3.36. In this, the silica gel adsorbed strongly PQ, its
concentration was reduced in the solution and the pollutant was bringed close to TiO 2
crystals. When TiO2 is irradiated with light of photon energy larger than the TiO 2
band gap, electrons can be continuously excited from the valance band to the
15
conduction band to generate free electrons (e-) and holes (h+). The electrons react
with oxygen and form superoxide radicals (O2.-), while the holes can combine with
water (H2O) or hydroxyl ion (OH-) to generate hydroxyl radicals (OH.-). These
radicals react easily to many organic compounds; breaking them down into byproducts.
Figure 3. 36. Schematic description of adsorption / photocatalysis of TiO2/SiO2.
ii) Doped samples are better able to adsorb than non-doped samples. When the
porosity of two materials is equal, their organic adsorption can be explained by point
of zero charge - pzc. The pzc value shown in Fig. 3.37 shows that the dopant Co into
the TiO2 crystalline lattice leads to an increase in the point of zero charge from pzc =
5.2 for non-doped TiO2/SiO2 to pzc = 6.6 for the Co 9% doped sample 9CoTiO2/SiO2. Therefore in a neutral environment, the surface of the material with the
negatively charged hydroxyl groups can adsorb well the organic compounds which
included positive charge as MB, PQ, DDT.
Figure 3. 37. Graph of point of zero Figure 3. 38. Fluorescence spectrum of
charge of SiO2, TiO2/SiO2 and 9Co- 1Co-TiO2/SiO2 (4), 3Co- TiO2/SiO2 (3),
TiO2/SiO2
6Co- TiO2/SiO2 (2) và 9Co- TiO2/SiO2 (1).
16
Figure 3. 39. Schematic description of the photocatalytic process of Co doped TiO 2
iii) Doped samples has photocatalytically activity when using visible light sources,
but photocatalysis was weaker than non-doped samples when using UV 365nm
sources. Co dopant also generates impurity levels below the conductor band, which
reduces the band gap 2.6 eV (Figure 3.39) for the TiO2/SiO2 sample resulting in
oxidation of PQ to inorganic nitrogen NO3- when using visible light. In addition,
when the doped concentration increases, it also increases the electron-hole
recombination rate as shown in the fluorescence spectrum of figure 3.38, which
results in the photocatalytic efficiency of the Co-doped sample less than that of the
non-mixed sample when using UV 365nm light source.
3.3.2. Evaluate the ability of Paraquat treatment in water environment with
10L/day test system
a, Effect of initial concentration
Pollutant concentration is an important parameter affecting the treatment of
organic pollutants by photocatalysis. As the concentration of pollutants increases, the
adsorption rate and catalytic speed increase. When the concentration of contaminant
concentrations greater than the limit, the processing speed increased pollutant
concentrations due to the OH radicals derived from the catalyst do not increase. To
investigate the initial PQ concentration effect on the processing efficiency of 9CoTiO2/SiO2, solutions with initial PQ concentrations of 10 ppm, 20 ppm, 50 ppm were
fed into the 10 L reaction system under visible light condition. The results are shown
in Fig. 3. 40 shows that when initial PQ concentration increases, the decomposition
rate of PQ decreases. This phenomenon may be from the initial concentration of PQ
increases, it prevent the catalysts from forming the OH group leading to a decrease
in photocatalytic efficiency.
17
Figure 3. 40. Effect of initial concentration on PQ treatment efficiency
b, Effect of flow rate
To investigate the effect of flow rate on the adsorption capacity of the material,
operate the system with different flow rates (10mL/ph; 20 mL/ph và 30mL/ph) was
set up. Test results for PQ at different flow rates are shown in Figure 3.41. The higher
the flow, the lower the catalytic capacity of the material. This may be because the
exposure time of the material to the deoxidized element decreases. Therefore, to
achieve optimum processing efficiency, the 20mL/min flow rate is optimal for the
treatment system.
Figure 41. Influence of flow rate to PQ removal
c. Ability to reuse
The ability to reuse is one of the key parameters of the catalyst. To evaluate the
catalytic recyclability of the 9Co-TiO2/SiO2 material, the test with a visible light
source, the initial PQ concentration of 10 ppm, the speed of 20 mL/min was
investigated. Results in Figure 3.42 shows that after 7 times of use, the material is
still good PQ treating capabilities that performance was 75% without reconstitution.
To the 8th cycle, the performance PQ began to decline to only 60% after 7pm testing.
18
Figure 3. 42. The ability to reuse of material in Paraquat treatment under fluorescent
lighting conditions
3.4. Evaluation of DDT treatment of Fe, Co, Ni doped TiO2 covered on SiO2
3.4.1 The ability of DDT treatment TiO2/SiO2 material
To evaluate the adsorption/photocatalytic activity of TiO2/SiO2 by treating
pesticide p, p 'DDT with an initial concentration of 1 ppm, the material weight 10 g,
the experimental conditions were set similarly as in the Paraquat treatment. Figure
3.43 shows the concentration-dependent p, p’ DDT over time and evaluate reaction
rate (inset). The results showed that p, p’ DDT concentrations were significantly
reduced. After 1 hour, the p, p’ DDT treatment efficiency of TiO2/SiO2 was 78% in
dark conditions and 97% in UV 365nm. Thus, the concentration of p, p 'DDT was
stronger reduction in UV conditions. The cause of this phenomenon can be explained
as: (i) material carrying particles SiO2 express adsorption capacity well p, p’ DDT
due to electromagnetic interaction is like the case of MB, Paraquat led to the
concentration of p, p' DDT reduced as the exponentially rule in both condition with
and without UV; (ii) TiO2 is capable of photocatalytic decomposition of p, p' DDT.
Therefore, during the first part of the experiment, both photocatalytic and
photocatalytic phenomena occurred simultaneously causing the concentration of p, p'
DDT to decrease faster with UV 365nm.
19
Figure 3. 43. Ability to treating DDT of TiO2/SiO2 in dark conditions (1) and UV 365nm (2).
Information on intermediate products during photocatalytic processing of DDT
is determined using the chromatogram shown in Figure 3.44. Chromatogram shows
the existence of two peaks in the retention time of 12.1, 12.7 minutes respectively
two compounds are chlorobenzene, chlorophenol. Therefore, it can be confirmed that
DDT is also decomposed by photocatalysis produce two characterized products
which were chlorobenzene and chlorophenol.
Figure 3. 44. Chromatogram p, p 'DDT in water samples after UV 60 minutes illumination
3.4.2. The ability of DDT treatment Co doped TiO2/SiO2 material
Effect of doping to the ability to decomposed pesticide p, p' DDT was tested
with samples Co doped 9% 9Co-TiO2/SiO2. In particular, the initial concentration
was 1 ppm, the amount of material used was 1 g. Figure 3.45 shows the dependence
of the p, p' DDT concentration over time on materials in visible and illuminated
lighting conditions. The results showed that only p, p' DDT adsorption on the
materials was occured. In particular, SiO2 exhibits the strongest adsorption capacity
of p, p' DDT, and the incorporation of the catalyst onto SiO 2 decreased the adsorption
ability of material. The cause could be the introduction TiO2 or Co doped TiO2 on
SiO2 makes reduces the specific surface area resulting in reduced adsorption capacity.
In addition, with or without visible light, the rate of decline in the concentration of p,
p 'DDT in solution does not differ for SiO2, TiO2/SiO2 and 9Co-TiO2/SiO2. This
suggests that photocatalytic activity does not occur with visible light.
20
Figure 3. 45. The ability to adsorb (a) and capable of treating DDT using SiO2 (b),
TiO2/SiO2 (c), Co doped TiO2/SiO2 (d).
3.5. Testing of Paraquat, DDT in reality water samples
3.5.1. Paraquat treatment
Permissible limits for Paraquat in drinking water are 3 μg/L (EPA, US
Environmental Protection Agency), 10 μg/L (WHO), 0.1 μg/L (European). In
Vietnam, this indicator is not in the standard QCVN 01: 2009/BYT on the quality of
drinking water. Meanwhile, QCVN 8:2011/BTNMT (Surface Water Quality) column
A1, Paraquat permissible concentration is 900 μg /L. Water samples in Mai Chau,
Hoa Binh province in five communes of Cu Pheo, Pieng Co, Tram, Mai Hich and
Van Mai were collected to determine the concentration of Paraquat in the reality
environment. Sampling location maps are described in Figure 3.46. Samples were
taken at the time before and after spraying herbicide. The samples were collected in 1
L brown glass bottles and transferred to the laboratory. Total samples were 68
samples. The results of the concentration analysis shown in Figure 3.47 show that
paraquat is most present in samples at concentrations of 10-150 μg/L. Some samples
of water in the villages CP, PV, PQ levels are 10-15 times higher than other villages
in both sampling periods.
21