Altered expression of mitochondrial 16S ribosomal RNA in p53-de¢cientmouse embryos revealed by di¡erential display
Bạn đang xem bản rút gọn của tài liệu. Xem và tải ngay bản đầy đủ của tài liệu tại đây (753.95 KB, 11 trang )
Biochimica et Biophysica Acta 1403 (1998) 254^264
Altered expression of mitochondrial 16S ribosomal RNA in p53-de¢cient
mouse embryos revealed by di¡erential display
Monier M. Ibrahim, Marjaneh Razmara, Diep Nguyen, Ronald J. Donahue,
Judith A. Wubah, Thomas B. Knudsen *
Department of Pathology, Anatomy and Cell Biology, Je¡erson Medical College, 1020 Locust Street, Philadelphia, PA 19107, USA
Received 17 February 1998; accepted 21 May 1998
Abstract
Inactivation of the tumor suppressor p53 is associated with neural tube defects and altered teratogenicity in early embryos.
To gain insight into the function of p53 during early embryogenesis, RNA profiles of wild-type p53(+/+) and p53(3/3) null
mutant mouse embryos were compared at the head-fold stage (day 8 post coitum) using HPLC-based mRNA differential
display. The results of this screen revealed a deficiency of mitochondrial 16S ribosomal RNA in p53(3/3) embryos. RT-PCR
showed abnormalities in 16S rRNA levels relative to some representative nuclear (COIV, L-actin) and mitochondrial (COIII)
transcripts in p53(3/3) embryos, and that 16S rRNA expression increased with development of p53(+/+) embryos during
neurulation. Embryos that lack p53 also displayed weakened cytochrome c oxidase staining and reduced ATP content.
During neurulation, the mouse embryo switches from an anaerobic (glycolytic) to an aerobic (oxidative) metabolism. The
preliminary results of the present study suggest that p53 may be involved, directly or indirectly, in this transition. ß 1998
Elsevier Science B.V. All rights reserved.
Keywords: Tumor suppressor p53; Mitochondrial DNA; Embryo development
1. Introduction
Tumor suppressor p53 is a DNA binding protein
that may arrest cell growth or trigger programmed
cell death (apoptosis) in response to oncogenic signals or DNA damage [1,2]. Loss of p53 function
leads to genomic instability and tumor formation
as indicated by the occurrence of mutant p53 proteins in a large proportion of human tumors [3] and
* Corresponding author. Fax: +1 (215) 923-3808;
E-mail: knudsent@je£in.tju.edu
strong cancer predisposition in mice with a homozygous null mutation at the p53 locus [4].
The association between p53 inactivation and tumor development has motivated studies to determine
how p53 protein activity is controlled in the cell, and
to identify critical target genes mediating p53 action
(reviewed in [5]). Di¡erential screening revealed
changes in several transcripts during p53-dependent
apoptosis [6^9]. Altered gene expression is a likely
basis of p53 activity in unstimulated cells because
p53 can modulate other cellular processes at levels
below those leading to apoptosis [10]. Neural cell
di¡erentiation, for example, was a low-grade response to p53 whereas apoptosis occurred at higher
levels [11]. This raises questions that pertain to the
0167-4889 / 98 / $19.00 ß 1998 Elsevier Science B.V. All rights reserved.
PII: S 0 1 6 7 - 4 8 8 9 ( 9 8 ) 0 0 0 6 6 - 4
BBAMCR 14341 20-7-98
M.M. Ibrahim et al. / Biochimica et Biophysica Acta 1403 (1998) 254^264
cell signaling pathways that have sensitivity to unstressed p53 function.
The early mouse embryo provides a model to
study the impact of p53 during developmentally
regulated changes in the steady-state. Most embryonic tissues, with possible exception of the primitive
heart, strongly express p53 mRNA during neurulation and early organogenesis [12,13]. p53 protein,
unlike the transcripts, was normally low in these tissues unless the embryo was subject to a teratogenic
stress [14,15]. Between 8 and 16% of mouse embryos
with a homozygous null mutation at the p53 locus
fail to neurulate properly [16,17]. Early manifestation
of anterior neural tube defects (NTDs) among some,
but not all, p53-de¢cient mouse embryos implies the
absence of p53 as a risk factor in some birth defects.
Added support derives from experimental teratogenesis, in which malformations induced by model
agents vary in incidence and severity depending on
p53 genotype. This e¡ect on teratogenicity varied
between agents. Sometimes the development of malformations was suppressed by wild-type p53 function
[18] whereas other times the e¡ect of p53 was facilitative [19]. Eye reduction defects (ERDs), for example, were induced when neurulation stage mouse embryos were exposed to 2-chloro-2P-deoxyadenosine
(2-CdA). The incidence and severity of these malformations were determined directly by the embryo's
p53 genotype, being high among p53(+/+) fetuses,
low among p53(3/3) fetuses, and intermediate
among heterozygotes [19]. The positive association
between p53 function and ERDs was also observed
in Xenopus embryos microinjected with p53 transcripts [20].
Because DNA binding is the likely basis of p53
action [5], the present study was undertaken to identify transcripts whose expression in neurulation stage
mouse embryos was sensitive to the loss of p53 function. RNA pro¢les were compared between wild-type
p53(+/+) and null-mutant p53(3/3) embryos using
di¡erential display [21,22]. Neurulation stage embryos that lack p53 have altered steady-state levels
of mitochondrial 16S ribosomal RNA transcripts,
results that suggest a role for p53 in the developmental transition from an anaerobic (glycolytic) to an
aerobic (oxidative) metabolism.
255
2. Materials and methods
2.1. Animals
TSG-p53 mice [4] were purchased from Taconic
Farms, Inc. (Germantown, NY). Outbred CD-1
mice were purchased from Charles River Breeding
Laboratories (Wilmington, MA). Both strains were
kept on a 12 h photoperiod (07.00^19.00 h light).
Timed pregnancies were generated by placing a
male with nulliparous females at 08.30 h. Detection
of a vaginal plug at 13.30 h signi¢ed coitus (day 0).
For di¡erential display, TSG-p53 embryos were harvested from p53(+/+) damUp53(+/+) sire and
p53(3/3) damUp53(3/3) sire crosses on day 8
post coitum (pc). Pregnant dams were killed with
carbon dioxide. Embryos were submerged in icecold Hanks' balanced saline solution (HBSS) and
dissected from the decidua and extraembryonic membranes. Six normal phenotypes [23] of each genotype
were selected at the 3^7 somite pair stage. For all
other experiments involving TSG-p53 mice, the embryos were harvested from p53(+/3) damUp53(+/3)
or p53(3/3) sire crosses and genotyped as described
[19]. For developmental analysis, RNA was isolated
from six-pooled prosencephalic (optic) and cardiac
regions of CD-1 (wild-type) embryos on days 8, 9,
and 10 pc.
2.2. RNA isolation
Total cellular RNA was extracted by RNeasy
(Qiagen, Chatsworth, CA). Tissues were lysed under
RNase-free conditions in 0.35 ml lysis bu¡er RLT
containing 1% (v/v) 2-mercaptoethanol. The samples
were frozen at 370³C, thawed, and sonicated at 40
W for 2 s. An equal volume of 70% ethanol was
added to the lysate. The suspension was applied to
the micro-spin column, centrifuged for 15 s at
8000Ug, and washed with 0.7 ml wash bu¡er RW1
and twice with 0.5 ml wash bu¡er RPE. RNA was
eluted from the column with 0.05 ml DEPC-treated
water and centrifugation for 60 s. Residual DNA
was digested with MessageClean (GenHunter, Nashville, TN) or DNase I, ampli¢cation grade (GibcoBRL, Gaithersburg, MD).
BBAMCR 14341 20-7-98
256
M.M. Ibrahim et al. / Biochimica et Biophysica Acta 1403 (1998) 254^264
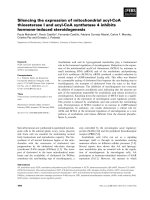
Fig. 1. HPLC-based mRNA di¡erential display. Native unlabeled PCR products were resolved by HPLC using a GenPak FAX column and convex NaCl gradient, 50³C. The NaCl gradient was optimized for separation of display products in the 150^600 bp range.
Absorbance was monitored at 252^272 nm by photodiode array detection (only the region of the chromatogram corresponding to the
NaCl gradient is shown). (A) HaeIII xX174 RF DNA ladder. Size of DNA fragments in bp were: 72 bp (peak 1), 118 bp (peak 2),
194 bp (peak 3), 234 bp (peak 4), 271+281+310 bp (peak 5), 603 bp (peak 6), 872 bp (peak 7), 1078 bp (peak 8) and 1353 bp (peak
9). Partial resolution of the three bands in peak 5 was lost as the HPLC column aged. (B,C) HPLC pro¢les displayed from p53(+/+)
and p53(3/3) embryos, respectively in B and C, at the 3^7 somite pair stage. Primer pairs were H-AP7 and H-T11 A, and dNTP concentration was 2 WM. The arrow marks a 217 bp peak (W7A.614) which was markedly under-represented in the p53-null embryo. (D)
Negative control reaction omitting the reverse-transcription step; the baseline £uctuation is caused by the convex NaCl gradient.
(E,F) HPLC pro¢les displayed from p53(+/+) and p53(3/3) embryos, respectively in E and F, with primer set H-AP1 and H-T11 A.
Identical patterns were evident in the H-T11 A display pools; dNTP concentration was 2 WM. (G,H) HPLC pro¢les displayed from
p53(+/+) and p53(3/3) embryos, respectively in G and H, with primer set H-AP7 and H-T11 G. Identical patterns were evident in the
H-T11 G display pool ampli¢ed with H-AP7; dNTP concentration was 2 WM. (I,J) HPLC pro¢les of p53(+/+) embryos (I) and p53(3/
3) embryos (J) ampli¢ed with primer pairs H-AP7 and H-T11 A; dNTP concentration was 200 WM. (K) Preparative samples of p53(+/
+) embryos used to purify W7A.614 for cloning and sequencing; the puri¢ed DNA was reampli¢ed with primers H-AP7 and H-T11 A
and 20 WM dNTPs and re-chromatographed. Some contamination was evident in the foreshoulder of peak W7A.614. (L) Electrophoresis of puri¢ed W7A.614 (same as in K) on 1.5% agarose gel with ethidium bromide staining (lane 1); xX174 RF DNA cut with
HaeIII (lane 2). The contaminating DNA was evident as a faint, smaller band.
C
2.3. HPLC-based mRNA di¡erential display
RNA (0.2 Wg) was reverse transcribed into three
display pools using single-base 3P-anchored oligo(dT)
primers (RNAimage, GenHunter). The reaction bu¡er contained 20 WM dNTPs; and 0.2 WM single 3Panchored oligo(dT) primers (H-T11 M where M = A,
G, or C) [22]. Reverse transcription (RT) was performed with 100 units of reverse transcriptase from
Moloney murine leukemia virus at 37³C for 50 min.
PCR was carried out in 40 Wl reactions containing
4 Wl of the RT-mix, 2 WM dNTPs; 1.5 mM MgCl2 ;
50 mM KCl; 0.2 WM of the appropriate oligo(dT)
primer; 0.2 WM of an arbitrary primer (H-AP1
through H-AP8 from GenHunter); and 2 units of
Taq DNA Polymerase (Gibco-BRL) in 10 mM
Tris-HCl, pH 8.3, cycled for 40 rounds (94³C 30 s,
40³C 2 min, and 72³C 30 s) followed by ¢nal extension at 72³C for 5 min in a DNA thermal cycler
(Perkin-Elmer, Norwalk, CT). Negative control reactions included omission of the reverse transcriptase
step, of either primer, or of Taq Polymerase.
Di¡erential display products were analyzed by
high-performance liquid chromatography (HPLC).
The HPLC column was a Gen-Pak FAX high-performance, anion-exchange column (4.6U100 mm)
from Waters Associates (Millipore Corporation, Milford, MA) protected with an in-line precolumn ¢lter
and used at 50³C [24]. The HPLC system consisted
of a model U6K sample injector, two model 501
HPLC pumps, a model 680 automated gradient con-
troller and a model 990+ photodiode array detector
(Waters Associates). The mobile phase was 25 mM
Tris-HCl, 1 mM EDTA, and 10% acetonitrile (pH
8.0) at a constant £ow of 0.75 ml/min. DNA was
eluted from the column by a superimposed gradient
of 0.4^0.52 M NaCl (linear curve no. 6) for 0^0.01
min and 0.52^0.67 M NaCl (convex curve no. 4) for
0.01^25 min. This gradient resolved PCR products of
150^600 bp in size. Absorbance was monitored by
photodiode array detection at A252À272 . After each
run, the column was £ushed with 0.5 ml of 0.1 N
phosphoric acid and equilibrated to starting conditions for at least 12 min. The column was stored in
25 mM Tris, 1 mM EDTA, and 10% acetonitrile (pH
8.0) at 4³C and calibrated daily with a ladder of
restriction fragments generated from digestion of
xX174 RF DNA with HaeIII. Eight of the 11 fragments (72, 118, 194, 234, 603, 872, 1078, and 1353
bp) were separated with baseline resolution and three
(271, 281, 310 bp) were resolved depending on the
age of the column; progressive deterioration of column performance occurred after about 200 sample
injections. Integrated DNA peaks were directly compared between samples by the formula (A2 +B2 )/
(2AB), where A and B represent the areas of corresponding peaks from p53(+/+) and p53(3/3) embryos, respectively. If single pass HPLC screening
produced peaks di¡ering by at least two-fold, the
display reaction was repeated to verify reproducibility. Where a reproducible di¡erence was observed in
at least three separate trials with 2 WM dNTPs, the
BBAMCR 14341 20-7-98
M.M. Ibrahim et al. / Biochimica et Biophysica Acta 1403 (1998) 254^264
PCR reaction was repeated with higher (20 and 200
WM) dNTP concentrations [25].
To isolate a di¡erential display product, the PCR
reaction was scaled up by a factor of eight (320 Wl
total) and applied to the HPLC column. A 0.6 ml
fraction containing the di¡erential peak was collected, reduced to 0.4 ml in a Speed-Vac concentrator
(Savant Instruments, Farmingdale, NY), and diluted
to 1 ml with TTE bu¡er (0.1 M Tris-HCl, 10 mM
triethylamine, and 1 mM EDTA, pH 7.7). This sam-
257
ple was loaded onto a Nensorb 20 nucleic acid puri¢cation cartridge (NEN Life Science, Boston, MA)
primed with methanol and TTE bu¡er. After washing the cartridge with 3 ml TTE bu¡er and water,
DNA was eluted with 0.5 ml of 50% methanol in
water. The DNA was dried, resuspended in 15 Wl
sterile water, and reampli¢ed with the appropriate
PCR primers and 20 WM dNTPs. Reampli¢ed
DNA was cloned into pCR-TRAP and screened
with Rgh and Lgh primers (GenHunter). Plasmids
BBAMCR 14341 20-7-98
258
M.M. Ibrahim et al. / Biochimica et Biophysica Acta 1403 (1998) 254^264
were puri¢ed on Qiagen columns and extended with
Lseq and Rseq sequencing primers (Aidseq Kit C,
GenHunter Corporation) in combination with
PRISM Ready Reaction DyeDeoxy Terminator
Cycle Sequencing Kit (Applied Biosystems, Foster,
CA). Extension products were puri¢ed using Quick
Spin columns (Boehringer-Mannheim, Indianapolis,
IN) and sequenced with an ABI Model 373A DNA
sequencer (Applied Biosystems) [26].
2.4. Semi-quantitative RT-PCR
Embryonic RNA (1^2 Wg) was annealed to random primers (Gibco-BRL) at 70³C and reverse-transcribed with SuperScript II RNase H3 reverse transcriptase (Gibco-BRL) at 42³C in the presence of
dithiothreitol and 200 WM of each dNTP. Negative
controls omitted reverse transcriptase. Gene-speci¢c
oligo(d)nucleotide primers were designed from sequence information in GenBank using OLIGO Primer Analysis Software 5.0 (National Biosciences,
Plymouth, MN). Each PCR cycle consisted of denaturation at 94³C 1 min, annealing at 57³C 1 min, and
extension at 72³C 1 min (10 min in last cycle). PCR
was initially performed with di¡erent cycle numbers
to ¢nd the optimal number and sample dilution for
quantitative ampli¢cation of target and control
genes; subsequently, PCR was performed at 24
cycles, which was optimal for a linear response
across sample dilutions of 1:50, 1:100, and 1:500.
Normalization to L-actin provided a control for
semi-quantitative measure of transcript abundance
[27]. PCR products were resolved on a nondenaturing 8% polyacrylamide gel, electrophoresed, and
stained with ethidium bromide. The gel was photographed with Polaroid 665 reversal ¢lm, and negatives were scanned with an LKB Ultroscan XL
laser densitometer (Pharmacia Biotech, Piscataway,
NJ).
2.5. Cytochrome c oxidase staining
Embryos were ¢xed 1 h at 4³C in 4% paraformaldehyde and 2% glutaraldehyde in phosphate-bu¡ered
saline (PBS), rinsed in PBS for 3 h, in¢ltrated with
10% sucrose in PBS at 4³C, and incubated in PBSsucrose containing 0.05% diaminobenzidine (DAB)
and 0.02% cytochrome c at 37³C [28]. Negative controls omitted cytochrome c or DAB.
2.6. Nucleotide analysis
Individual embryos were extracted in 0.1 ml 60%
aqueous methanol at 320³C overnight [29]. The samples were centrifuged for 5 min at 12 000Ug. The
pellet was used for protein determination (Bio-Rad,
Hercules, CA); the supernatant was dried for 2 h in a
Speed-Vac and resuspended in 0.2 ml of 50 mM ammonium phosphate, pH 6.5, containing 2 mM tetrabutylammonium hydroxide and 5% acetonitrile (mobile phase). Samples were chromatographed on a C18
reversed-phase HPLC column at a £ow rate of 1.5
ml/min. Peaks corresponding to ATP and ADP were
integrated at A262 .
3. Results
3.1. Di¡erential display peak analysis
RNA pro¢les of p53(+/+) and p53(3/3) embryos
were analyzed by HPLC-based di¡erential display at
the 3^7 somite pair stage of development. The
HPLC-based method a¡orded simple and reproduci-
Table 1
Primers used for expression PCR analysis of murine respiratory subunits
Locusa
Genome
Upper primer
Lower primer
PCR product
16S rRNA
COIII
ND4L
COIV
L-actin
mtDNA
mtDNA
mtDNA
nuDNA
nuDNA
5P-ACAGCTAGAAACCCCGAAAC-3P
5P-AATCCAAGTCCATGACCATT-3P
5P-ATGCCATCTACCTTCTTCAA-3P
5P-GCACCAATGAATGGAAGACA-3P
5P-TACCACAGGCATTGTGATGG-3P
5P-AAGATAAGAGACAGTTGGAC-3P
5P-TGTGTTGGTACGAGGCTAGA-3P
5P-AAACTAAGGTGATGGGGATT-3P
5P-CAGCGGGCTCTCACTTCTTC-3P
5P-AATAGTGATGACCTGGCCGT-3P
785
296
193
234
310
a
bp
bp
bp
bp
bp
COIII, cytochrome c oxidase, subunit III; ND4L, NADH:ubiquinone oxidoreductase, subunit 4L; COIV, cytochrome c oxidase, subunit IV.
BBAMCR 14341 20-7-98
M.M. Ibrahim et al. / Biochimica et Biophysica Acta 1403 (1998) 254^264
259
Table 2
Relative expression of mitochondrial 16S rRNA in early embryosa
Genotype
16S rRNA
p53(+/3)
1.67 þ 0.25
p53(3/3)
0.34 þ 0.22
ratio (% reduction) 0.19 þ 0.10 (81%)
16S rRNA/ND4L 16S rRNA/COIII 16S rRNA/COIV 16S rRNA/L-actin 16S rRNA/
mRNAsb
7.61 þ 4.42
6.68 þ 3.90
0.99 þ 0.11 (1%)
1.58 þ 0.17
0.46 þ 0.25
0.31 þ 0.19 (69%)
8.25 þ 0.27
4.07 þ 1.25
0.27 þ 0.07 (73%)
2.41 þ 0.54
0.55 þ 0.41
0.28 þ 0.25 (72%)
0.75 þ 0.15
0.28 þ 0.20
0.46 þ 0.18 (54%)
a
Signals for 16S rRNA relative to representative nuclear and mitochondrial mRNAs (mean þ S.E.M., n = 2) assayed at the early headfold presomite stage.
b
16S rRNA relative to the four representative mRNAs (P = 0.037 by paired t-test).
ble patterns of arbitrary PCR products in the 150^
600 bp range (Fig. 1A). Di¡erences between samples
could be spotted quickly and were probably kept to a
minimum by low peak complexity (5^10 peaks per
primer set). Since arbitrary PCR primers hybridize as
8-mers [21,22], theoretical ampli¢cation of cDNA
fragments in the 150^600 bp range should sample
one of every 146 cDNAs (48 divided by 450). For
the typical mammalian cell expressing 15 000 di¡erent mRNA species [21] the eight arbitrary primer
screen should have ampli¢ed 822 di¡erential display
peaks. A total of 167 (20.3% of the predicted number) was observed. These probably represent only a
small subset of the transcripts expressed in an early
embryo.
Comparison of the two genotypes indicated equal
representation for 165 (98.8%) of the di¡erential display products. One di¡erence (W7A.614) was underrepresented in p53(3/3) embryos (Fig. 1B,C) and
the other (N6G.610) was over-represented (not
shown). Di¡erential display products were dependent
upon reverse transcription (Fig. 1D), speci¢c for the
particular arbitrary primer (Fig. 1E,F), and unique
to the corresponding display pool (Fig. 1G,H). Of
the two, only W7A.614 remained di¡erent when the
samples were ampli¢ed with 20^200 WM dNTPs (Fig.
1I,J). Neither was a¡ected by the p53-null condition
in neural display pools generated from the brain or
eye of adult mice (not shown).
Both di¡erential display peaks were isolated (Fig.
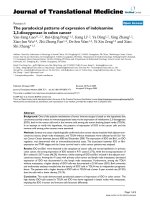
Fig. 2. RT-PCR assay of respiratory transcripts. Embryonic
RNA samples were reverse-transcribed from p53(+/3) and
p53(3/3) siblings at the early head-fold presomite stage on day
8 pc. The gene-speci¢c primers are listed in Table 1. Ethidiumstained gels were photographed with Polaroid reversal ¢lm
(negative shown). Lane m: HaeIII digest of xX174 RF DNA
marker; lanes 1^10: PCR products ampli¢ed from p53(+/3)
embryos (lanes 1, 2, 3, 7 and 8) and p53(3/3) embryos (lanes
4, 5, 6, 9 and 10) using primers speci¢c for ampli¢cation of
murine L-actin (lanes 1 and 4), ND4L (lanes 2 and 5), COIII
(lanes 3 and 6), COIV (lanes 7 and 9) and 16S rRNA (lanes 8
and 10).
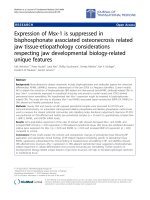
Fig. 3. Developmental expression of 16S rRNA. RNA was isolated from the prosencephalon (pn) and heart (ht) of CD-1 embryos harvested at day 8 (4^6 somite pair stage), day 9 (16^18
somite pair stage) and day 10 (28^30 somite pair stage). Expression PCR was performed for 24 cycles using primers speci¢c
for 16S rRNA (top band) and L-actin (bottom band); reaction
mixtures for test and control reactions were double-loaded onto
the gels. Photographic negative of 8% polyacrylamide gel
stained with ethidium bromide; lane m: HaeIII digest of
xX174 RF DNA marker; two actin bands (320+310 bp) were
consistently observed in heart samples only.
BBAMCR 14341 20-7-98
260
M.M. Ibrahim et al. / Biochimica et Biophysica Acta 1403 (1998) 254^264
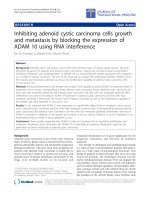
Fig. 4. Cytochrome c oxidase staining of day 8 embryos. Embryos (7^8 somite pair stage) ¢xed and reacted with cytochrome c and
DAB as whole mounts; genotype was determined by PCR analysis of yolk sac DNA. Light microscopy of: (A) p53(+/3) embryo representing the `dark' phenotype; (B) p53(3/3) littermate representing the `light' phenotype; and (C) negative control embryo whereby
cytochrome c was omitted from the reaction medium. 35U magni¢cation (pn, prosencephalon; ht, heart).
1K,L) and sequenced. N6G.610 corresponded to an
anonymous cDNA (GenBank accession number
T03459) cloned from human infant-fetal brain [30].
It was not pursued further. The W7A.614 sequence
corresponded to nucleotide positions (np) 2077^2275
of the mouse mitochondrial genome (GenBank accession number J01420). Nucleotide positions 2077^
2275 of the mouse mitochondrial genome map to the
16S ribosomal RNA gene (16S rRNA, np 1094^
2675) [31]. Mature mitochondrial 16S rRNA transcripts are heterogeneous at the 3P-terminus but
most frequently terminate in `T' at np 2675, immediately preceding the tRNALeu UUR gene, in mice
[32]. Annealing of 16S rRNA to the single-base 3Panchored H-T11 A primer used to generate W7A.614
was consistent with this termination; however,
W7A.614 mapped to an internal 5P-TA6 sequence
about 400 nucleotides upstream from the predicted
16S rRNA/tRNALeu UUR gene boundary. Heterogeneity at the 3P-end was probably not responsible
for the di¡erences between p53(+/+) and p53(3/3)
embryos. A more likely explanation was that p53(+/
+) and p53(3/3) embryos di¡ered from one another
with respect to the abundance of 16S rRNA.
3.2. Semi-quantitative analysis of mitochondrial
transcripts
To con¢rm di¡erential display analysis, RT-PCR
was used to amplify 16S rRNA in relation to several
representative mitochondrial and nuclear transcripts.
This approach was selected over direct hybridization
methods because of limitations in tissue volume.
Gene-speci¢c PCR primers were designed to amplify
the 5P-end of 16S rRNA (np 1338^2103 of the mitochondrial DNA genome); cytochrome c oxidase subunit III (COIII), a mitochondrial-encoded subunit of
complex IV of the respiratory chain; NADH:oxidoreductase subunit 4L (ND4L), a mitochondrial-encoded subunit of complex I of the respiratory chain;
Table 3
ATP and ADP levels of day 8 embryosa
Genotypeb
n
mg protein per
embryo
ATP content
(nmol/mg protein)c
ADP content
(nmol/mg protein)
ATP/ADP ratioc
p53(+/+)
p53(+/3)
p53(3/3)
normal
abnormal
10
13
7
5
2
0.041 þ 0.012
0.044 þ 0.014
0.034 þ 0.014
0.036 þ 0.015
0.028 þ 0.010
8.55 þ 2.12
8.93 þ 2.66
6.56 þ 1.13a **,b **
6.58 þ 1.35
6.50 þ 0.52
2.11 þ 0.64
2.44 þ 0.56
2.55 þ 0.87
2.41 þ 0.81
2.88 þ 1.27
4.18 þ 0.79
3.76 þ 1.14
2.83 þ 0.98a **,b *
2.98 þ 1.07
2.45 þ 0.90
a
Average developmental age was 8 somite pairs (range 4^12 somite pairs); data are given as mean þ S.D.
Determined by PCR genotyping of yolk sac; p53(3/3) were also grouped as normal or abnormal based on their external morphology.
c
Signi¢cant di¡erences by unpaired t-test: (a) versus p53(+/+); and (b) versus p53(+/3); *P 9 0.05; **P 9 0.015.
b
BBAMCR 14341 20-7-98
M.M. Ibrahim et al. / Biochimica et Biophysica Acta 1403 (1998) 254^264
cytochrome c oxidase subunit IV (COIV), a nuclearencoded subunit of complex IV of the respiratory
chain; and L-actin, an internal control for input
RNA (Table 1). PCR signal, y, was linear for input
cDNA across sample dilutions of 1:50 (y = 0.63),
1:100 (y = 0.30), and 1:500 (y = 0.12) (coe¤cient of
determination, R2 = 0.991).
RT-PCR ampli¢ed the predicted fragments from
embryonic RNA samples. Signals generated from
p53(3/3) embryos were generally weaker than were
those from p53(+/3) embryos relative to the L-actin
control (Fig. 2). Signals for 16S rRNA and COIII
exceeded those for mitochondrial mRNAs and
COIV, respectively. The quantitative excess of ribosomal over messenger RNAs, and of mitochondrial
over nuclear mRNAs for respiratory complexes, were
seen in other developing tissues analyzed by direct
hybridization methods [33^35].
Comparison of p53(+/3) and p53(3/3) embryos
at the early head-fold presomite stage con¢rmed the
de¢ciency of 16S rRNA templates between sibling
pairs. This was true whether PCR signals were normalized to L-actin or several representative mRNAs
(Table 2). Overall, the reduction was 54% (P = 0.037,
paired t-test). RT-PCR also revealed that steadystate levels of 16S rRNA increase as p53(+/+) embryos develop (Fig. 3). The p53(+/+) embryos were
obtained on day 8 (4^6 somite pairs), day 9 (16^18
somite pairs), and day 10 (28^30 somite pairs) of
gestation. Analysis of the prosencephalon and heart
indicated that 16S rRNA increased relative to L-actin
in both developing structures. Just as these structures
di¡er in their relative sensitivity to p53-dependent
events [15,19], so they may di¡er in developmental
expression of 16S rRNA.
3.3. Bioenergy status of p53-de¢cient embryos
Cytochemical staining for cytochrome c oxidase
revealed `dark' and `light' phenotypes among embryos harvested from two crosses between p53(+/3)
damUp53(3/3) sire (Fig. 4). All ¢ve p53(3/3) embryos displayed the light-staining phenotype, whereas
eight of nine p53(+/3) embryos were dark-staining.
Segregation of light-staining phenotype with p53(3/
3) genotype was signi¢cant (P = 0.001, M2 analysis).
Another indicator of mitochondrial bioenergetic
function is the ATP/ADP ratio. Total ATP and
261
ADP levels were measured in embryos of di¡erent
p53 genotypes (Table 3). Embryos lacking p53 displayed lower ATP per Wg protein or per pmol ADP.
The ATP shortfall approached 33%. Two p53(3/3)
embryos displayed an unusually wide gap between
cranial neural folds. These early manifestations of
anterior NTDs presented with a similar ATP shortfall as the phenotypically normal p53(3/3) subset
(Table 3).
4. Discussion
About 80 subunits compose the ¢ve protein complexes of the mitochondrial respiratory chain. Thirteen subunits are encoded in the mitochondrial DNA
(mtDNA) genome along with small (12S) and large
(16S) mitochondrial rRNAs and 22 transfer RNAs
required for their translation [36]. The present study
detected under-expression of a mitochondrial encoded gene, 16S rRNA, among neurulation stage
embryos with a homozygous null mutation at the
p53 locus. Partial (54%) loss of 16S rRNA expression, together with weakened staining for cytochrome c oxidase activity and shortfall of ATP approaching 33%, suggests a developmental connection
between tumor suppressor p53 and mitochondrial
energy transduction.
4.1. Mitochondrial translation
Mitochondrial 12S and 16S rRNA transcripts are
disproportionately expressed over mRNAs in actively respiring cells [37,38]. The present study has
not addressed the question of whether mitochondrial
rRNA abundance in general is a¡ected by p53 or if
the e¡ect is speci¢c for 16S rRNA. The alterations in
steady-state levels of 16S rRNA could represent a
more global deregulation, one that involves biogenesis of mtDNA or the respiratory chain. Since the
small subset (1%) of embryonic transcripts sampled
by di¡erential display would probably have been too
small to reveal a global e¡ect on respiratory chain
mRNAs, additional studies will be needed to determine if the e¡ect on 16S rRNA was general or speci¢c.
Defects in mitochondrial translation can be manifested as cellular pathogenesis in neurulation stage
BBAMCR 14341 20-7-98
262
M.M. Ibrahim et al. / Biochimica et Biophysica Acta 1403 (1998) 254^264
embryos. The supportive evidence comes from teratogenicity studies with chloramphenicol, a speci¢c
inhibitor of mitochondrial translation [39,40], and
the severe birth defects that can be associated with
the pathogenic A3243G MELAS mutation [41,42].
Expansion of 16S rRNA transcript pools in the developing mouse embryo suggests that mitochondrial
protein synthesis takes on a growing importance during neurulation stages. This is consistent with Xenopus, where large-scale ampli¢cation of the mitochondrial ribosomal RNA transcript begins late in
gastrulation and continues into neurulation [43].
Failure of mouse embryos that lack p53 to achieve
normal 16S rRNA levels might re£ect a function of
wild-type p53 as a signal to increase mitochondrial
translational during neurulation, a scenario consistent with the known inhibitory e¡ects of chloramphenicol on developing embryos.
4.2. Oxidative metabolism
For some time it has been known that mammalian
embryos are initially adapted for anaerobic (glycolytic) bioenergy production and then switch to aerobic (oxidative) metabolism [44,45]. Around the 8 somite stage, the rate at which lactate is produced by
the embryo drops from the previous steady state of
3^7 nmol/mg protein/h, which is similar to a rapidly
growing tumor; consequently, the embryo's demand
for oxygen grows [46^49]. Mitochondrial ultrastructure becomes more characteristic of actively respiring
cells as the embryo develops between the 8 and 30
somite stages [44]. If expansion of 16S rRNA pools
re£ects this increase in mitochondrial respiratory capacity, then control of this oxidative transition may
at least partly depend on p53 protein activity. It is
interesting to note that p53 protein activity is induced by hypoxia [50,51] or imbalances in ribonucleotide pools [52]. Perhaps p53 reacts to metabolic
demand to stimulate energy transduction in the
growing embryo through cell signaling pathways
that control mitochondrial biogenesis or expression
of functional respiratory complexes.
Cranial neural folds are sensitive to alterations in
both p53 protein activity and bioenergetic metabolism. Dependence on p53 may be inferred from the
association of anterior NTDs with a subset of p53de¢cient embryos [17]. Closure of the anterior neuro-
pore normally takes place on days 8^9 pc [23].
Hence, NTDs would be expected from loss of a
p53-dependent bioenergetic conservation mechanism
during this period. Shortfall in ATP levels contribute
to experimentally induced cranial NTDs [49], and
an `energy gap' has been proposed to explain the
high frequency of NTDs among diabetic mothers
[53]. The dependence of bioenergetic conservation
on p53 might also explain the di¡erential teratogenicity of neurulation stage embryos to some teratogens. For example, 2-CdA has recently been shown
to alter patterns of energy metabolism [54]. The capacity of 2-CdA to induce ERDs dependent on p53
could be a re£ection of an early action on mitochondria.
Recent studies have demonstrated a connection
between p53 and oxidative metabolism in the control
of apoptosis. A cell's commitment to apoptosis may
be measured by the collapse of mitochondrial electrochemical potential, v8m [55]. Associated mitochondrial changes include 16S rRNA degradation
[56], suspension of mitoribosomal translation [57],
and transcriptional shut-down of mtDNA [58]. Because b0 cells that lack mtDNA still undergo apoptosis, the changes in 16S rRNA and probably other
mtDNA encoded genes are not primary for the
apoptotic functions of mitochondria [59]. On the
other hand, at least part of the control of p53-dependent apoptosis may be exerted at the level of
oxidative metabolism. Transactivation of cellular oxidoreductases, and the subsequent generation of reactive oxygen intermediates, was causally linked to
p53-dependent apoptosis [8,60]. Perhaps p53-dependent alterations in 16S rRNA expression observed in
the present study re£ect a low-grade (subapoptotic)
in£uence of p53 protein on oxidative metabolism at
the steady state, an in£uence which becomes overshadowed during high-grade (apoptotic) p53 protein
activity.
4.3. Conclusion
During neurulation the mammalian embryo
switches from primarily anaerobic (glycolytic) to
aerobic (oxidative) metabolism. This is re£ected in
up-regulation of mitochondrial 16S rRNA transcripts, a product of the mtDNA genome, and may
depend at least partly on p53 function. The novel
BBAMCR 14341 20-7-98
M.M. Ibrahim et al. / Biochimica et Biophysica Acta 1403 (1998) 254^264
connection between tumor suppressor p53 function
and activities encoded by the mtDNA genome has
broader implications toward understanding the role
of p53-dependent events in oxidative metabolism and
related mechanisms in apoptosis.
Acknowledgements
This research was supported by Grant RO1
HD30302 from the National Institute of Child
Health and Human Development (T.B.K.). M.M.I.,
J.A.W. and R.J.D. were fellows on Training Grant
T32 ES07282 from the National Institute of Environmental Health Sciences. Methods development was
assisted by Dr. William Warren of Waters Chromatography Division, and Dr. James Eberwine of the
University of Pennsylvania School of Medicine. For
technical assistance we are indebted to Je¡ Charlap.
Helpful comments were o¡ered by Jan Hoek of Jefferson Medical College, Peter Liang of the Cancer
Research Institute, Vanderbilt University, and
Charles Bieberich of the University of Maryland in
Baltimore.
References
[1] M.B. Kastan, O. Onyekwere, D. Sidransky, B. Vogelstein,
R.W. Craig, Cancer Res. 51 (1991) 6304^6311.
[2] E. Yonish-Rouach, D. Resnitzky, J. Lotem, L. Sachs, A.
Kimchi, M. Oren, Nature 352 (1993) 345^347.
[3] M. Hollstein, D. Sidransky, B. Vogelstein, C.C. Harris, Science 253 (1991) 49^53.
[4] L.A. Donehower, M. Harvey, B.L. Slagle, M.J. McArthur,
C.A. Montgomery Jr., J.S. Butel, A. Bradley, Nature 356
(1992) 215^224.
[5] L.J. Ko, C. Prives, Genes Dev. 10 (1996) 1054^1072.
[6] S.M. Lehar, M. Nacht, T. Jacks, C.A. Vater, T. Chittenden,
B.C. Guild, Oncogene 12 (1996) 1181^1187.
[7] D. Israeli, E. Tessler, Y. Haupt, A. Elkeles, S. Wilder, R.
Amson, A. Telerman, M. Oren, EMBO J. 16 (1997) 4384^
4392.
[8] K. Polyak, Y. Xia, J.L. Zweler, K.W. Kinzler, B. Vogelstein,
Nature 389 (1997) 300^305.
[9] G.S. Wu, T.F. Burns, E.R. McDonald III, W. Jiang, R.
Meng, I.D. Krantz, G. Kao, D.-D. Gan, J.-Y. Zhou, R.
Muschel, S.R. Hamilton, N.B. Spinner, S. Markowitz, G.
Wu, W.S. El-Diery, Nature Genet. 17 (1997) 141^143.
[10] X. Chen, L.J. Ko, C. Prives, Genes Dev. 10 (1996) 2438^
2451.
263
[11] O. Eizenberg, A. Faber-Elman, E. Gottlieb, M. Oren, V.
Rotter, M. Schwartz, Mol. Cell. Biol. 16 (1996) 5178^5185.
[12] M. Rogel, M. Popliker, C.G. Webb, M. Oren, Mol. Cell.
Biol. 5 (1985) 2851^2855.
[13] P. Schmid, A. Lorenz, H. Hameister, M. Montenarh, Development 113 (1991) 857^865.
[14] D.E. MacCallum, T.R. Hupp, C.A. Midgley, D. Stuart, S.J.
Campell, A. Harper, F.S. Walsh, E.G. Wright, A. Balmain,
D.P. Lane, P.A. Hall, Oncogene 13 (1996) 2575^2587.
[15] E. Gottlieb, R. Ha¡ner, A. King, G. Asher, P. Gruss, P.
Lonai, M. Oren, EMBO J. 16 (1997) 1381^1390.
[16] J.F. Armstrong, M.A. Kaufman, D.J. Harrison, A.R.
Clarke, Curr. Biol. 5 (1995) 931^936.
[17] V.P. Sah, L.D. Attardi, G.J. Mulligan, B.O. Williams, R.T.
Bronson, T. Jacks, Nature Genet. 10 (1995) 175^180.
[18] C.J. Nicol, M.L. Harrison, R.R. Laposa, I.L. Gimelshtein,
P.G. Wells, Nature Genet. 10 (1995) 181^187.
[19] J.A. Wubah, M.M. Ibrahim, X. Gao, D. Nguyen, M.M.
Pisano, T.B. Knudsen, Curr. Biol. 6 (1996) 60^69.
[20] M. Hoever, J.H. Clement, D. Wedlich, M. Montenarh, W.
Knochel, Oncogene 9 (1994) 109^120.
[21] P. Liang, A.B. Pardee, Science 257 (1992) 967^971.
[22] P. Liang, W. Zhu, X. Zhang, Z. Guo, R.P. O'Connell, L.
Averboukh, F. Wang, A.B. Pardee, Nucleic Acids Res. 22
(1994) 5763^5764.
[23] M.H. Kaufman, The Atlas of Mouse Development, Academic Press, San Diego, CA, 1992.
[24] W. Warren, J. Doniger, BioChromatography 10 (1991) 216^
219.
[25] K. Miyashiro, M. Dichter, J. Eberwine, Proc. Natl. Acad.
Sci. USA 91 (1994) 10800^10804.
[26] M.M. Ibrahim, I.T. Weber, T.B. Knudsen, Biochem. Biophys. Res. Commun. 209 (1995) 407^416.
[27] W.G. Cance, R.J. Craven, T.M. Weiner, E.T. Liu, Surg.
Oncol. 1 (1992) 309^314.
[28] S. Liu, M. Wong-Riley, J. Neurosci. 14 (1994) 5338^5351.
[29] X. Gao, M.R. Blackburn, T.B. Knudsen, Teratology 49
(1994) 1^12.
[30] A.S. Khan, A.S. Wilcox, M.H. Polymeropoulos, J.A. Hopkins, T.J. Stevens, M. Robinson, A.K. Orpana, J.M. Sikela,
Nature Genet. 2 (1992) 180^185.
[31] M.J. Bibb, R.A. Van Etten, C.T. Wright, M.W. Walberg,
D.A. Clayton, Cell 26 (1981) 167^180.
[32] R.A. Van Etten, J.W. Bird, D.A. Clayton, J. Biol. Chem.
258 (1983) 10104^10110.
[33] L. Piko, K.D. Taylor, Dev. Biol. 123 (1987) 364^374.
[34] M. Renis, P. Cantatore, P. Loguercia Polosa, F. Fracasso,
M.N. Gadaleta, J. Neurochem. 52 (1989) 750^754.
[35] K.D. Taylor, L. Piko, Mol. Reprod. Dev. 40 (1995) 29^35.
[36] G. Attardi, G. Schatz, Annu. Rev. Cell Biol. 4 (1988) 289^
333.
[37] B. Kruse, N. Narasimhan, G. Attardi, Cell 58 (1989) 391^
397.
[38] J.R. Valverde, R. Marco, R. Garesse, Proc. Natl. Acad. Sci.
USA 91 (1994) 5368^5371.
[39] L. Piko, D.G. Chase, J. Cell Biol. 58 (1973) 357^378.
BBAMCR 14341 20-7-98
264
M.M. Ibrahim et al. / Biochimica et Biophysica Acta 1403 (1998) 254^264
[40] D. Oerter, R. Bass, Naunyn-Schmiedeberg Arch. Pharmacol.
290 (1975) 175^189.
[41] M.S. Damian, P. Seibel, W. Scachenmayr, H. Reichmann,
W. Dorndorf, Am. J. Med. Genet. 62 (1996) 398^403.
[42] A. Feigenbaum, D. Chitayat, B. Robinson, D. MacGregor,
T. Myint, G. Arbus, J.M. Nowaczyk, Am. J. Med. Genet. 62
(1996) 404^409.
[43] J.W. Chase, I.B. Dawid, Dev. Biol. 27 (1972) 504^518.
[44] B. Mackler, R. Grace, H.M. Duncan, Arch. Biochem. Biophys. 144 (1971) 603^610.
[45] T. Tanimura, T.H. Shepard, Proc. Soc. Exp. Biol. Med. 135
(1970) 51^54.
[46] G.M. Morriss, D.A.T. New, J. Embryol. Exp. Morphol. 54
(1979) 17^35.
[47] J. Clough, D.G. Whittingham, J. Embryol. Exp. Morphol.
74 (1983) 133^142.
[48] A. Miki, E. Fujimoto, T. Ohsaki, H. Mizoguti, Anat. Embryol. 178 (1988) 337^343.
[49] E.S. Hunter III, J.A. Tugman, Teratology 52 (1995) 317^
323.
[50] T.G. Graeber, M. Peterson, M. Tsai, K. Monica, A.J.
Fornace Jr., A.J. Giaccia, Mol. Cell. Biol. 14 (1994) 6264^
6277.
[51] T.G. Graeber, C. Osmanian, T. Jacks, D.E. Housman, C.J.
Koch, S.W. Lowe, A.J. Giaccia, Nature 379 (1996) 88^91.
[52] S.P. Linke, K.C. Clarkin, A. Di Leonardo, A. Tsou, G.M.
Wahl, Genes Dev. 10 (1996) 934^947.
[53] B.E. Finley, S. Norton, Am. J. Obstet. Gynecol. 165 (1991)
1661^1666.
[54] P. Hentosh, M. Tibudan, Mol. Pharmacol. 51 (1997) 613^
619.
[55] M. Castedo, A. Macho, N. Zamzami, T. Hirsch, P. Marchetti, J. Uriel, G. Kroemer, Eur. J. Immunol. 25 (1995) 3277^
3284.
[56] D.R. Crawford, R.J. Lauzon, Y. Wang, J.E. Mazurkiewicz,
G.P. Schools, K.J.A. Davies, Free Radical Biol. Med. 22
(1997) 1295^1300.
[57] J.-L. Vayssiere, P.X. Petit, Y. Risler, B. Mignotte, Proc.
Natl. Acad. Sci. USA 91 (1994) 11752^11756.
[58] B.A. Osborne, S.W. Smith, Z.G. Liu, K.A. McLaughlin, L.
Grimm, L.M. Schwartz, Immunol. Rev. 142 (1994) 301^320.
[59] P. Marchetti, S.A. Susin, D. Decaudin, S. Gamen, M. Castedo, T. Hirsch, N. Zamzami, J. Naval, A. Senik, G.
Kroemer, Cancer Res. 56 (1996) 2033^2038.
[60] T.M. Johnson, Z.-X. Yu, V.J. Ferrans, R.A. Lowenstein, T.
Finkel, Proc. Natl. Acad. Sci. USA 93 (1996) 11848^11852.
BBAMCR 14341 20-7-98