Nghiên cứu giá trị của presepsin trong chẩn đoán và tiên lượng bệnh nhân nhiễm khuẩn năng và sốc nhiễm khuẩn tt tiếng anh
Bạn đang xem bản rút gọn của tài liệu. Xem và tải ngay bản đầy đủ của tài liệu tại đây (303.37 KB, 26 trang )
MINISTRY OF EDUCATION AND TRAINING
MINISTRY OF NATIONAL DEFENCE
SCIENTIFIC RESEARCH INSTITUTE OF CLINICAL MEDICINE 108
--------------------
NGUYỄN VI ẾT Q UANG HIỂN
RES EARC H VALUE O F PRESEPS IN
IN DIAGNOS IS AND PROGNOS IS O F
SEVERE S EPS IS AND SEPTIC SHOC K PATIENTS
Spe cialism: Aneathesia and resuscitation
Code : 62720122
MEDICAL DOC TO RAL THESIS
Hà Nội, 2019
Science Instructors:
1. Ass.Prof. PhD Le T hi Viet Hoa
2. Ass.Prof. PhD Nguyen Phuong Dong
Opponent 1: ……………………………………………….
Opponent 2: ……………………………………………….
Opponent 3: ……………………………………………….
The thesis has been defended at University-level Thesis Evaluation
Council held in Scientific research Institute of clinical medicine 108
At, ...... ...... (hour), ...../...../2019 (date)
This thesis may be found at:
- National Library
- Library of Scientific research Institute of clinical medicine 108
1
INTRO DUCTIO N
1. The urgency of thesis
Septic shock is an acute circulatory failure that reduces the
perfusion of organs, promotes systemic inflammatory response and
prolonged metabolic disorders, leading to multiple organ failure and
death. Early identification and effective management reduce
mortality in septic shock. Biomarkers have an important role in
diagnosis as well as prognosis of septic shock.
Currently there are many biomarkers that help diagnose and
prognosis patients with septic shock such as CRP, PCT , presepsin ...
Presepsin is a soluble molecule of CD14, created when the body
responds to infection. Many studies show that presepsin is valuable
in early diagnosis (up to 2 hours after infection) sepsis and septic
shock. Some meta-analyzes have demonstrated that presepsin has
better value than P CT in the diagnosis and prognosis of sepsis and
sept ic shock. In Vietnam, no studies to evaluated the role of plasma
presepsin in diagnosis and prognosis sepsis and septic shock.
2. The meaning of thesis
The thesis contributes new to theory and practice of using
biomarkers presepsin in the direction of diagnosis and prognosis in
patients with severe sepsisand septic shock, thereby allowing the use of
presepsin as a tool. diagnosis, monitoring and prognosis for patients
with severe sepsisand septic shock.
This is the first study in Vietnam.
3. Obje ctives
- Evaluate concentration changes and the role of plasma
presepsin in diagnosing severe sepsisand septic shock.
- Det ermine the correlation of plasma presepsin with some
scales and biomarkers assessing the severity in prognosis of
mortality on patients with severe sepsis and septic shock.
2
4. Structure of thesis
The thesis has 112 pages including 2 pages of introduction and
objectives, 35 pages of overview, research subjects and methods 22
pages, results 22 pages, discussion 22 pages, conclusions and
recommendations 3 pages. The thesis has 27 tables, 10 pictures and 11
charts. The thesis uses 134 references, in which 13 Vietnamese
documents, 121 English documents, 03 articles related to the topic have
been published.
3
Chapte r 1 :OVERVIEW
1.1. Septic shock
In 1991, the first consensus conference between the American
College of Chest Physicians and the Society of Critical Care Medicine
agreed to provide the following definitions of sepsis, severe sepsis and
septic shock:
Infection: A bacterial infection characterized by a local
inflammatory response to microorganisms (bacteria, viruses, fungi, and
parasites) or invasion of sterile tissue by these microorganisms.
Systemic Inflammatory Reponse Syndrome (SIRS): is a global
inflammatory response for many different agents characterized by t he
presence of at least 2 of the following criteria:
- Body temperature> 380C or <360C;
- Heart rate> 90 times / minute;
- Breathing frequency> 20 times / minute or PaCO2 <32 mmHg;
- The number of peripheral blood leukocytes> 12G / L or <4G / L
or leukocytes accounts for> 10%.
- Septicemia (sepsis): Systemic inflammatory response syndrome +
Positive infection or blood culture positive.
Severe sepsis: sepsis conditions that manifest organ dysfunction,
hypofusion or hypotension.
Septic shock is a serious infection with prolonged hypotension
(systolic blood pressure <90 mmHg or a decrease of more than 40
mmHg compared to the initial blood pressure of the patient) and does
not respond with fluid replacement.
In 2001, the consensus conference between the Society of Critical
Care Medicine and the European Society of Intensive Care Medicine
proposed adding diagnostic criteria to the definitions but did not provide
alternative definitions because it have not enough evidence.
4
In 2016, European and American resuscitation experts agreed to
make new updates on infection definition with four main points:
- Agree to remove the term "severe sepsis" because the word
"sepsis" itself means a serious infection.
- Sepsis is defined as a life-threatening organ dysfunction due to an
uncoordinated response to infection.
- Diagnosis of septic shock when the patient meets the criteria for
sepsis, even though the circulating volume is sufficient but still requires
vasopressors to maintain the mean blood pressure ≥ 65 mmHg and
accompanied by increasing the lactate serum> 2 mmol / l.
- The conference agreed not to use systemic inflammatory response
syndrome in the diagnosis of sepsis and septic shock but instead
replaced with qSOFA scale and SOFA.
1.2. Role of presepsin in infe ction
1.2.1. The origin and structure of presepsin
Presepsin (sCD14-ST ) is a 13 kDa peptide created by soluble
protein hydrolysis of the cluster of differentiation CD14 (sCD14).
There are 2 forms of soluble CD14 in plasma of healthy people with
very low concentrations including molecules weighing 49 KDa and
55 KDa. sCD14 plays an important role in mediating immune
response to LPS of cells without clustering CD14 such as endothelial
and epithelial cells.
1.2.2. Kinetics of presepsin
Presepsin concentration increased within 2 hours after bacterial
infection, peaked after 3 hours. This feature makes presepsin
molecule become the biomarker that responds quickly to infection
when compared with PCT and CRP with activation time of 6-12
hours and 12-24 hours, respectively. Plasma half-life is 4-5 hours,
compared with 12-24 hours for PCT , allowing early evaluation as
well as treatment efficacy. Presepsin is mainly excreted by the
kidneys.
5
1.2.3. Value of plasma presepsin in infe ction
Presepsin is a new biomarker who plays a role in early
identification of sepsis and is valuable in the prognosis of severity
and mortality in patients with severe sepsis and septic shock.
1.2.4. Studies on plasma presepsin in infe ctions on global
and Vietnam
- Research on the concentration and role of plasma presepsin in
diagnosing severe sepsis and septic shock.
- Research on the role of plasma presepsin in prognosis of
patients with severe sepsis and septic shock.
- In Vietnam, presepsin has also been used in diagnosing
infections in some hospitals such as Hue Cent ral Hospital ...
However, there has not been any specific study evaluating the role of
plasma presepsin in diagnosis as well as prediction patients with
severe sepsis and septic shock.
Chapte r 2
MATERIALS AND METHO D
2.1. Materials: research on 80 patients with severe sepsis and
sept ic shock treated in anesthesia Department of Anesthesia A - Hue
Central Hospital from 01/2015 to 01/2017.
2.1.1. Criteria for selecting: Patients> 18 years old, having
sufficient evidence to diagnose severe sepsis and shock with
American College of Chest Physicians and the Society of Critical
Care Medicine standard (2001).
2.1.2. Exclusion criteria: Patients or family members do not
agree to participate in the study, patients with malignancy, HIV
infection, immunosuppressive drugs, end-stage chronic renal failure.
2.1.3. Standard type out of the study: Patients who are eligible for
admission to study but must end treatment because the patient's
fam ily wishes.
6
2.2. Research methodology.
2.2.1. Study design: Prospective study, cross-sectional
description, vertical monitoring and comparison with control group.
2.2.2. Calculating example size
According to research by Ali (2016) [15], prognostic mortality
value of presepin's is 0.89. We choose the current mortality rate of
severe sepsis and septic shock based on the study of T ran Xuan
Thinh (2016) [11] of 31%.
n = (FP + T N)/(1-p)= 37,6/0,69 = 54,5
In summary, we need sample size> 55 patients to meet the
requirements of the research goal
2.2.3. Re search de vices
- Multi-funct ional hemodynamic monitoring system
- Blood gas machine, Cardiopulmonary X-ray machine in bed
- Presepsin kit
2.2.4. Evaluation crite ria
2.2.4.1. Evaluation criteria for 2 study objectives
The e valuation crite ria for obje ctive 1: assessing the
concentration change and the role of plasma presepsin in diagnosing
severe sepsis and septic shock.
- Plasma presepsin concentration in patients with severe sepsis
and septic shock.
+ Det ermination of plasma presepsin concentration at t he study
time: presepsin concentration right after diagnosis of severe sepsis
and septic shock (T0), after 24 hours (T1) and after 7 days (T7).
+ Change the plasma presepsin concentration by age, sex,
bacterial culture results (negative or positive) at the time of study.
7
+ Det ermination of changes in plasma presepsin concentrations
at the study t ime between the living and death groups.
- Value of plasma presepsin in differential diagnosis of severe
sepsisand septic shock.
+ Compare presepsin, PCT and CRP concentrations at T0
between severe sepsis and septic shock groups
+ Analysis of ROC curves of presepsin compared with PCT and
CRP in differential diagnosis between severe sepsis and septic shock
The e valuation crite ria for obje ctive 2: determining the
correlation of plasma presepsin with the severity score in the
prognosis of mortality in patients with severe sepsisand septic shock
- Evaluate the correlation of presepsin, PCT and CRP with
severity scales in patients with severe sepsis and septic shock
+ Det ermining the correlation between presepsin, PCT and
CRP with severity scales (APACHE II, SOFA, SAPS 2, MODS).
+ Det ermine the correlation between presepsin, PCT and CRP
with plasma lactate.
- Determine t he mortality prognostic value of plasma presepsin
in patients with severe sepsis and septic shock.
+ Analysis of ROC curve in presepsin mortality prognosis at the
time of study.
+ Analyzing the ROC curve in presepsin’s mortality prognosis at
time T0 compared with APACHE II, SOFA, SAPS 2 and MODS scale.
+ Analysis of the ROC curve in presepsin mortality prognosis in
combination with the severity scales (SOFA, APACHE II, SAPS 2,
MODS) at time T0 compared to presepsin alone.
+ Analyzing the ROC curve in presepsin mortality prognosis
compared to the biomarkers of PCT, CRP and lactate at the time of T0.
+ Multivariat e regre ssion analysis to identify independent
risk factors in mort ality prognosis in patients with severe sepsis
and septic shock.
8
2.2.4.2. Other evaluation criteria
- Det ermine general characteristics of age, gender, bacteria
access path, circulation, rating scale
- Describe characteristics of hematological testing, liver, kidney,
blood sugar, lact ate, blood gas, IL-6, microbiological characteristics.
- T reatment results (number of days resuscitation, mechanical
ventilation rate, mechanical ventilation time, rate and death)
2.2.4. Study proce dure
2.2.4.1. The time of conducting research
- T ime T 0: time of diagnosis of severe sepsis and septic shock.
- Time T1: 24 hours after diagnosis of severe sepsis and septic shock.
- Time T7: 7 days after diagnosis of severe sepsis and septic shock.
2.2.4.2. Acquiring patients into the study: Patients who are
eligible for diagnosis or are eligible for inclusion in the control group
are enrolled in the study after obtaining the consent of the patient, or
the patient's family members if the patient is not alert .
2.2.5.3. Prepare research sheets for each patient
2.2.5.4. Applying a treatment regimen for severe sepsis and
septic shock according to SSC 2012 guidelines
2.2.5.5. Monitor and record research parameters
- Continue to monitor and treat patients daily. The clinical
symptoms were recorded and the presepsin, PCT , IL-6 and lactate
tests were performed at times T0 (diagnosis time), T1 (after 24
hours) and T 7 (after 7 days).
- Monitor patients' response to treatment, record treatment
results such as mechanical ventilation time, resuscitation period,
hospital stay.
- Patients who die: are patients who die in hospitals or patients
who are too heavy to be sent home.
2.3. Data processing: The data are processed according to
the medical statistical calculations, SPSS software 20.0
9
CHAPTER 3: RESULTS
3.1. General characte ristics in the research group
- Men account for (60%). The average age is 59.0 ± 20.0 years.
- The positive blood culture rate in the research group was
27.5%, the rate of blood culture negative was 72.5%. Gram negative
bacteria dominate (77.3%).
-Infection from the gastrointestinal t ract accounts for a major
proportion (73.8%). T he rate of mechanical ventilation is 57.5%, the
hospital mortality rate is 28.8%
3.2. The concentration and role of plasma presepsin in the
diagnosis of severe infe ctions and septic shock
3.2.1. Plasma pre sepsin concentration in the study group
Table 3.10: Plasma presepsin concentration in the stu dy group
Pre sepsin Min
Max
Median
Quartile
(pg/ml)
Times
T0 (n = 80)
78,8
5665,7
420
227,3– 722,8
T1 (n = 80)
75,9
5273,8
345,1
194,9 – 591,1
T7 (n = 72) *
41,9
4257,0
279,4
180,6 – 568,3
p (with T0)
* p < 0,05
Plasma presepsin concentration was highest in the study group
at T0 and tended to decrease gradually at T7.
Table 3.14. Plasma pre sepsin concentration in the survival and
death in hospital group
Group
Survival
Death
(n = 57)
(n = 23)
p
Median
Median
Time
(Qu artile)
(Qu artile)
308
659,9
T0
< 0,01
(216,5 – 567,2)
(423 – 2218)
267,8
835,8
T1
< 0,01
(170,0 – 409,6)
(468,3 – 1504,9)
235,9
1033,9
T7
< 0,01
(138,6 – 448,6)
(820,7 – 1578,9)
10
Signific ant presepsin levels in death groups were
signif icantly higher than in the live group. Presepsin
concentrat ion in mortality group increased gra dually from time T0
to T 7. In the living group, presepsin concentration decreases.
3.2.2. The role of pl asma pres psin in differe ntial diagnosis
of severe se psis and septic shock
Ta ble 3.15. Plasma conce ntrations of pres e psin, CRP and PCT
in the group of severe sepsis and septic shock at T0
Group
Severe sepsis
Se ptic shock
(n = 38)
(n = 42)
Median
Median
p
Inde x
(Qu artile)
(Qu artile)
313,7
512,6
Pre sepsin
< 0,01
(177,1 – 494,2)
(288,6 – 1986,0)
(pg/ml)
4,0
15,3
< 0,05
PC T (ng/ml)
(1,6 – 15,5)
(3,9 – 62,5)
110,6
162,0
> 0,05
CRP (mg/L)
(51,1 – 180,2)
(60 – 212,5)
Plasma concentrations of presepsin and PCT in septic shock groups
were significantly higher than those in severe infections. There were no
statistically significant differences in CRP levels in the two groups.
Table 3.16: Diagnosis value of severe sepsis and septic shock of
presepsin compare d with PCT and CRP at T0
Inde x
Cut- Sensitivity Spe cificity AUC KTC
p
off
95%
0,59 Pre sepsin
495
57,1%
78,9%
0,7
p < 0,01
(pg/ml)
0,82
0,54 –
PC T
6,1
72,5%
63,9%
0,66
p < 0,05
(ng/ml)
0,78
0,46 –
CRP
183,7
40%
83,3%
0,59
p > 0,05
(mg/l)
0,72
11
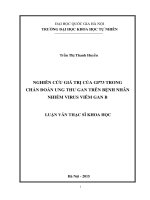
Figure 3.2: Values of plasma presepsin, CRP and PCT in
differential diagnosis of NKN and SNK
- Plasma presepsin concentration has a differential diagnostic
value of severe sepsis and sept ic shock, the area under ROC 0.7
curve (p <0.01), with a cut-off of 495 pg / ml with a sensitivity of
57.1% and specificity 78.9%.
- PCT concentration has a weak differential diagnosis value
(AUC 0.66), 6.1 ng / ml cut-off point has sensitivity and specificity>
60%. T he concentration of CRP is not valid in differential diagnosis
of NKN and SNK.
3.3. Value of plasma presepsin in prognosis in patients with
severe sepsis and se ptic shock
3.3.1. Value of plasma presepsin in prognosis of seve rity in
patients with seve re sepsis and septic shock
- T he concentration of plasma presepsin at diagnosis time of
severe sepsis and sept ic shock is positively correlated, the average
level of SOFA scale (r = 0.39; p <0.001) and APACHE II scale (r =
0.33; p <0.01), SAPS 2 scale (r = 0.22; p <0.05), MODS scale (r =
0.36; p <0.01).
12
3.3.2. Mortality prognostic value of plasma presepsin in
patients with seve re sepsis and septic shock
Table 2.22: Mortality prognostic value of plasma presepsin in
patients with seve re sepsis and septic shock
Inde x
Cut- Sensitivity Spe cificity
KTC
AUC
p
off
95%
Pre sepsin
0,66 488,1
73,9%
70,2%
0,77
(T0)
< 0,001
0,86
(pg/ml)
Pre sepsin
438,5
(T1)
(pg/ml)
80%
80,4%
0,81
0.70 –
<
0.90 0,001
Pre sepsin
0.79 –
777
80%
97,7%
0,9
(T7)
< 0,001
0,96
(pg/ml)
The presepsin concentration at T 0 had a relatively favorable
prognosis, with AUC 0.77 (p <0.001), at cut-off 488.1pg / ml,
sensitivity is 73.9% and specificity is 70.2%. T he concentration of
presepsin at T 1 and T 7 has a good prognostic mortality, AUC is 0.81
and 0.9 (p <0.001), sensitivity and specificity> 80%.
Table 3.23. Mortality prognostic value of plasma presepsin time
T0 compared to the scale of assessing se ve rity at time T0
Inde x
Cut- Sensitivity Spe cificity
AUC KTC 95%
p
off
Pre sepsin
488,1 73,9%
70,2%
0,77 0,66 - 0,86 < 0,001
(pg/ml)
APACHE II
22
70%
81%
0,84 0,76 - 0,92 < 0,001
(score)
SO FA (score)
8
69,6%
68,4%
0,73 0,62- 0,82 < 0,001
SAPS 2 (score)
36
78,3%
63,2%
0,76 0,65 – 0,85 < 0,001
MODS (score)
7
65,2%
75,4%
0,75 0,64 – 0,84 < 0,001
13
The APACHE II, SOFA and SAPS 2 scale scores have a prognostic
mortality value of 0.84 respectively; 0.73; 0.76 and 0.75 (p <0.001)
Table 3.25. Mortality prognostic value of plasma presepsin
compare d to PCT, CRP and lactate at T0 time
Inde x
Cut- Sensitivity Spe cificity AUC KTC
p
off
95%
73,9%
70,2%
0,77 0,66 < 0,001
Pre sepsin 488,1
(pg/mL)
0,86
35
81,8%
31,5%
0,52 0,39- > 0,05
PC T
0,63
(ng/mL)
72,3
50%
72,2%
0,53
0,41> 0,05
CRP
0,65
(mg/L)
5,4
47,8%
82,5%
0,65 0,54- < 0,05
Lactat
0,75
(mmol/L)
Lactate concentration has a weak prognosis value (AUC 0.65, p
<0.05), at cutoff 5.4 mmol/L has sensitivity 47.8%, specificity
82.5%. P CT and CRP at T 0 don’t have valid in mortality prognosis
on patients with severe sepsis and septic shock (p> 0.05).
Table 3.26. Compare the area unde r the curve (AUC) in the
mortality prognosis of presepsin with other parame te rs
Inde x
Pre sepsin at T0
(AUC = 0,77)
APACHE II (AUC = 0,84)
p > 0,05
SOFA (AUC = 0,73)
p > 0,05
SAPS 2 (AUC = 0,76)
p > 0,05
MODS (AUC = 0,75)
p > 0,05
Presepsin + APACHE II (AUC = 0,87)
p < 0,05 (*)
Presepsin + SOFA (AUC = 0,77)
p > 0,05
Presepsin + SAPS 2 (AUC = 0,82)
p > 0,05
Presepsin + MODS (AUC = 0,78)
p > 0,05
PCT (AUC = 0,52)
p < 0,05 (*)
CRP (AUC = 0,53)
p < 0,05 (*)
14
Lactat (AUC = 0,65)
p > 0,05
(*) Test DeLong.
- The concentration of presepsin at T0 has an area under the
curve (AUC) in the prognosis of death equivalent to the scale of
APACHE II, SOFA, SAPS 2, MOD S and Lactat (p> 0.05). When
combining Presepsin with APACHE II scale, the area under the
ROC curve in t he mortality prognosis is higher than presepsin alone
(p <0.05). The concentration of presepsin at T 0 was significantly
lower than t he curve (AUC) in the prognosis compared with PCT
and CRP (p <0.05).
Table 3.27. Multivariate re gression analysis of some
prognostic factors of de ath in the study group
Inde x
p
OR
KTC 95%
0,44
1,7
0,43 – 6,68
Years > 60
APACHE II > 22 score
0,009
8,4
1,7– 41,9
Pre sepsin > 488,1 (pg/ml)
0,01
5,7
1,4 – 22,5
SO FA > 8 score
0,56
1,3
0,3 – 6,5
Lactat > 5,4 (mmol/L)
0,14
2,8
0,7– 11,3
Plasma presepsin concentration and APACHE II score are
independent predictors of mortality in patients with severe infections
and septic shock.
Chapte r 4: DISCUSSIO N
4.1. General characte ristics of research patients
4.1.1. Gene ral characteristics of the re search te am
Charact eristics of age and gen der in the research group: T he
average a ge of patients in the study group is 59.0 ± 20.0 years.
Men in the research group accounted for 60%. Compared with
other studies: According to Bui T hi Huong Giang (2016), the
average age in sept ic shock group is 55.6 ± 16.5 years, male
15
accounts for 67.9%. T ran Xuan T hinh (2016), men account for
63%, the average age is 59.8 ± 19.8 years old (t he lowest is 18
years and the highest is 98 years old).
Characteristics of infection origins: Infection from the
gastrointestinal tract accounts for the highest percentage of 73.8%.
Respiratory tract infections accounted for 7.5%. Compared with
other studies: Pham Thi Ngoc Thao (2013), gastrointestinal
infections accounted for a major proportion of 56.1%, respiratory
tract 21.1%, urinary tract 7.3% and unknown route of entry
accounting for 7.3%. T he mortality rate in the respiratory tract
infections group was 61.5%. Sturgess et al (2010) found the main
source of infection from the gastrointestinal tract (38%) and
respiratory tract (33%).
Characteristics of pathogenic bacteria: Positive blood culture
rate of 27.5%, in which gram-negative bacteria dominate (77.3%).
Compared with other studies: Pham T hi Ngoc Thao (2013),
positive blood culture rate 33.9%, gram negative bacteria accounted
for 83.8%, gram positive bacteria mainly Staphylococcus aureus
accounted for 13.5%. Bui Thi Huong Giang (2016), blood culture
rate is 21% positive.
Treatment results: T he rate of mechanical ventilation in the
study group accounted for 57.5%, the average mechanical ventilation
time was 3.7 days. In the subgroup analysis, the rate of mechanical
ventilation in t he group of septic shock was 78.6% higher t han that
of the severe sepsis group of 34.2%. The average duration of
treatment in the intensive care unit was 12.4 days, the hospital
mortality rate was 28.8%. In the group of septic shock, the death rate
was 42.9% higher than the severe infection group of 13.2%.
Compared with other research: Tran Xuan Thinh (2016): the
proportion of patients with mechanical ventilation accounted for
42%, the average hospital stay was 18.7 days, the hospital death rate
16
was 31%. Bui T hi Huong Giang (2016): patients with septic shock,
hospital death rate of 42% [4]. Sturgess DJ et al (2010): 76% of
patients had mechanical ventilation at admission, the average
resuscitation time was 12.5 ± 12.3 days, the hospital stay was 29.6 ±
29.3 days and the rate was hospit al death rate is 29%. Klouche et al
(2016), the average resuscitation period is 5 days and the hospital
mortality rate is 28%..
4.2. Variation in concentration and role of plasma presepsin in
the diagnosis of severe infections and septic shock
4.2.1. Plasma presepsin concentration in patients with severe
infections and septic shock
Plasma presepsin concentration in the study group: The highest
presepsin plasma concentration in the study group at the time of
diagnosis was 420 pg / mL ( quart ile 227.3 - 722.8 pg / ml) and
decreased. gradually at T 1 345.1 pg / mL (quart ile 194.9 - 591.1 pg /
ml), and T7 was 279.4 pg / mL (quartile 180.6 - 568.3 pg / ml), there
was a difference in presepsin concentration at T 7 compared to T 0 (p
<0.05) (Table 3.10).
Compared to other studies: The results are similar to Ulla's
study (2013), the highest Presepsin concentration at the time of
diagnosis of severe sepsis and sept ic shock, then gradually decreases
at 24 hours and 72 hours.
Plasma presepsin concentration survival and death groups:
Plasma presepsin levels at T 0, T 1 and T7 in hospital mortality group
were 659.9 pg / ml, 835.8 pg / ml and 1033 respectively, 9 pg / ml
significantly higher than the living group was 308 pg / ml, 267.8 pg /
ml and 235.9 pg / ml (p <0.001) (T able 3.14).
Compared to other studies: El-Shafie (2017), plasma presepsin
concentrations at the time of admission, days 2 and 4 were
significantly lower in the living group compared to deaths with the
concentration of 422, respectively. 5 pg / ml compared to 1768 pg /
17
ml (p = 0.02); 427.5 pg / ml compared to 1900 pg / ml (p = 0.004)
and 410.5 pg / ml compared to 2000 pg / ml (p = 0.002). Behnes
(2014) and Klouche (2016) also have the same results.
4.2.2. The role of plasma pre sepsin in the diagnosis of se ve re
infe ctions and septic shock.
Presepsin has a role in distinguishing diagnosis patients between
severe sepsis and septic shock. T he plasma presepsin concentration
in septic shock group at T0 was 512.6 pg / mL (quart ile 288.6 1986.0 pg/ml), significantly higher than the severe sepsis group,
respectively 313.7 pg / ml (quart ile 177.1 - 494.2 pg / ml) (p
<0.001). PCT levels also increase with severity in infected patients.
Median PCT levels in septic shock group were 15.3 ng/ml (quartile
3.9 - 62.5ng / ml) significantly higher than the severe sepsis group
4.0 ng / ml (quartile 1.6 - 15.5ng / ml). Meanwhile, the concentration
of CRP did not differ between the severe sepsis and septic shock
group (p> 0.05).
Compared with other studies: Shozushima et al (2011):
presepsin concentration in the non-infected group was 294.2 ± 121.4
pg / ml; in the local infection group, 721,0 ± 611,3 pg / ml; SIRS
group is 333.5 ± 130.6 pg / ml; sepsis 817.9 ± 572.7 pg / ml and
severe sepsis is 1992.9 ± 1509.2 pg / ml [109]. Liu B (2013): at the
time of admission, plasma presepsin levels increased with the
severity of sepsis. The median concentration of presepsin in sepsis
group was 325 pg / ml (quartile 210-480 pg / ml), in severe sepsis
group is 787 pg / ml (quartile 464 - 1249 pg / ml) and in septic
shopck group is 1084 pg / ml (quartile: 695 - 2365 pg / ml) higher
than the healthy group is 130 pg / ml (quart ile 104 -179 pg / ml) (p
<0.001). Vodnik T (2013), El-Shafie M (2017) and Carpio (2015) all
have similar results.
Le Xuan T ruong (2009): average PCT concentration of patients
with septic shock was 82.88 ng / ml, significantly higher than the
18
average PCT concentration in severe sepsis patients 32.2 ng / ml ( p
<0.05). Tran Xuan Thinh (2016): PCT levels at the time of diagnosis
in septic shock group were 34.59 ng / ml (quart ile 10.18 - 82.68 ng /
ml) significantly higher than severe sepsis group: 9.1 ng / ml
(quartile range: 2.96 - 31.40 ng / ml). T ran Thi Nhu Thuy (2013),
Ulla (2013), Uzzan and colleagues (2006) also have similar
conclusions.
Calculating the area under the ROC curve of presepsin, PCT
and CRP in distinguishing the severity of infection, presepsin
concentration has a diagnostic value that distinguishes severe sepsis
and sept ic shock with t he area under t he ROC curve ( AUC 0.7, p
<0.01), at cut-off 495 pg / ml, sensitivity is 57.1% and specificity is
78.9%. P CT has quite different diagnostic values with AUC 0.66 (p
<0.05) and CRP has no value in differential diagnosis of severe
sepsis and septic shock (p> 0.05).
Compared with other studies: Li u (2013): area under the curve
of presepsin in diagnosis of septicemia (AUC 0.82) was
significantly higher than PCT (AUC 0.724) (p <0.001). Using
presepsin value is 317 pg / ml to diagnose infection with sensitivity
of 70.8%, specificity is 85.8% [82]. Kweon (2014): the area under
the ROC curve of presepsin in NKH diagnosis is 0.937. The area
under the curve in presepsin was higher than that of PCT (AUC
0.915), IL-6 (AUC 0,869) and CRP (AUC 0.853) [76]. Ulla (2013),
Vodnik T (2013), T ong (2015), Wu et al (2015), Zhang et al (2015)
also reported similar res ults. T he above results show t hat presepsin
and procalcitonin have good value in diagnosing the severity of
infect ion and distinguishing between sever sepsis and sept ic shock
compared with CRP.
4.3. Correlation of plasma presepsin with severity scores in
mortality prognosis in patients with severe sepsis and septic shock
19
4.3.1. Correlation of plasma presepsin with severity scales in
patients with severe sepsis and septic shock
The concentration of plasma presepsin at the t ime of diagnosis
of severe sepsis and septic shock is positively correlated, the average
level with SOFA scale (r = 0.39; p <0.001) and APACHE II scale (r
= 0.33; p < 0.01), SAPS 2 scale (r = 0.22; p <0.05), MODS scale (r =
0.36; p <0.01). Plasma PCT concentrations at the t ime of diagnosis
of severe sepsis and septic shock were positively correlated, the
average level with a SOFA scale (r = 0.32; p <0.001), correlated
weakly with the MODS scale ( r = 0.27; p <0.01). There was no
correlation with APACHE II and SAPS 2 point s (p> 0.05); CRP
concentrations were not found to be correlated with the severity
scales.
Compared with other studies: Wen (2019): presepsin has a
positive correlation with the SOFA scale (r = 0.39; p <0.001) while
PCT does not show a correlation with the SOFA scale (r = 0.136 ; p
= 0.114) [126]. El-Shafie et al (2017), Ulla and colleagues,
Shozushima (2011) and Kojika (2010) have similar results. This
reinforces the hypothesis about the role of presepsin in predicting the
severity of infection and reflecting the patient's condition.
4.3.2. The correlation of plasma presepsin with lactate in
patients with severe infections and se ptic shock.
The concentration of presepsin and PCT at T0 was positively
correlated, the average level of lactate with correlation coefficient
was 0.44 and 0.31 respectively (p <0.01). Meanwhile CRP has no
correlation with lactate (p> 0.05). The correlation between presepsin
and lactate levels in the study highlights the role of presepsin in
assessing severity in patients with severe sepsis and septic shock
4.3.3. Mortality prognostic value of plasma presepsin in
patients with severe sepsis and septic shock.
20
Prognostic mortality value of presepsin in patients with severe
sepsis and septic shock:
When analyzing the area under the ROC curve, the plasma
presepsin at T0 was capable of predicting mortality fairly in patients
with severe sepsis and septic shock, with an area under the ROC
curve 0.77 (p <0.001). ), at cut-off 488.1 pg / ml, sensitivity is 73.9%
and specificity is 70.2% (table 3.22). P resepsin concentration at T1
time had good value in mortality prognosis, with AUC 0.81 (p
<0.001), cut-off 438.5 pg / ml, sensitivity is 80% and specificity is
80.4%. Presepsin concentration at T7 had good value in mortality
prognosis, with AUC 0.9 (p <0.001), cutoff 777 pg / ml, sensitivity
80% and specificity 97.7%.
Compared with other studies: Liu (2013): area under t he curve
of presepsin to predict 28-day mortality in infected patients was
0.658, lower than MEDS score (0.719; p> 0.05) and APACHE II
score (0.722; p <0.05). When binary logistic regression analysis,
presepsin, MEDS scale and APACHE II scale are independent
predictors of severe infections in infected patients, however, PCT is
not an independent predictor. El-Shafie et al (2017): AUC of
presepsin in mortality prognosis at the t ime of admission, day 2 and
4 are 0.755 respectively; 0.807 and 0.834 (p <0.05). In 15 patients
with presepsin decreased, 14 survived and in 16 patients with
presepsin increased, 10 died. There was a negative correlation
between presepsin reduction and death (p = 0.001). Behnes (2014),
Masson et al (2015), Ali (2016) also recorded similar results
Mortality prognosis value of presepsin compared to severity
scales in patients with severe sepsis and septic shock:
Presepsin in our study has AUC in the mortality prognosis
equivalent to the APACHE II, SOFA, SAPS 2 and MODS scale with
AUC respectively is 0.84, 0.73, 0.76 and 0.75 (p> 0.05).
21
Compared to other studies: Hoang Van Quang (2012) found
APACHE II score and SOFA score with a predictive mortality value
is 0.67 and 0.7 respectively (p <0.05). Pham T hi Ngoc Thao (2011)
studied 123 patients with severe sepsis and septic shock, APACHE II
and SOFA score had a prognostic mortality value of 0.81 and 0.7
respectively. Qiao (2012): AUC of APACHE II scale and SOFA in
the mortality prognosis are 0.76 and 0.76 respectively.
The results of tables 3.24 and 3.26, when combining presepsin
with the APACHE II scale, increase the mortality prognosis value
compared to presepsin alone (AUC 0.87 versus 0.77). Similar t o the
study of Liu (2013) and Wen (2019).
Prognostic mortality value of presepsin compared with
biomarkers in assessing severity (PCT , CRP and lactate): Presepsin
concentration at time T 0 has prognostic mortality value equivalent to
lact ate and better than PCT, CRP (table 3.26).
Compared with other studies: Liu (2013), presepsin has an AUC
in mortality prognosis in patients with severe sepsis (AUC 0.84)
significantly higher than PCT (AUC 0.74). . Wen (2019), Kim
(2016) also have similar conclusions.
However, in the study of Ali (2016), presepsin and PCT had the
same prognostic mortality value with AUC of 0.89 and 0.93,
respectively. Also in this study, presepsin had a 28th day better
prognosis value than CRP (AUC 0.89 vs AUC 0.44).
Multivariate regression analysis with variables including age,
APACHE II, SOFA, presepsin and plasma lactate concentration.
Analysis results showed that plasma presepsin concentration and
APACHE II score were independent predictors of mortality in
patients with severe sepsis and septic shock (Table 3.27). Compared
to other studies: Wen (2019), presepsin is an independent factor in
the prognosis of mortality in patients with septicemia.
22
CONCLUSIO N
Through research on 80 patients with severe sepsis and septic
shock treated in the Department of Anesthesia A – Hue Central
Hospital from 01/2015 to 01/2017, we made some conclusions as
follows:
1. Modify the concentration and role of plasma presepsin in
diagnosing severe sepsis and septic shock.
* P lasma presepsin concentration in patients with severe sepsis
and septic shock.
- Plasma presepsin concentration in the group <60 years and
group ≥ 60 years of age did not differ significantly. There is no
difference in plasma presepsin concentration by gender and
microbiological results.
- The concentration of plasma presepsin of death in the hospital
group was significantly higher than the living group (p <0.001). The
highest presepsin concentration at the time of diagnosis and
gradually decreased over time in the living group and presepsin
gradually increased over time in the death group.
* T he role of plasma presepsin in differential diagnosis of
severe infections and septic shock.
- Plasma presepsin concentrations in septic shock group were
significantly higher t han in severe sepsis group (p <0.05). Presepsin
distinguishes diagnosis between severe sepsis and septic shock have
AUC 0.7 (p <0.01), cut-off 495 pg / ml with sensitivity of 57.1% and
specificity of 78.9%.
2. Values of plasma presepsin in patients with severe sepsis and
sept ic shock.
- Presepsin concentration has positive correlation, average level
with SOFA scale (r = 0.39; p <0.001), APACHE II scale (r = 0.33; p
23
<0.01), scale of MODS (r = 0.36, p <0.01) and lactate (r = 0.44, p
<0.01) at time T0.
- Presepsin concentration at time T 0, T 1 and T7 had good
predictive value of death, with AUC at 0.77; 0.81 and 0.9 (p <0.001).
- T he concentration of presepsin at the time of T0 has the
prognostic value of death equivalent to the severity scale (APACHE
II, SOFA, SAPS 2, MODS), Lactat (p> 0.05) and has mortality
prognostic value better than PCT and CRP (p <0.05).
- When combining presepsin concentration with APACHE II
scale, it increases the predictive value of death compared to
presepsin alone (p <0.05).
- Plasma presepsin concentration is an independent factor with
predictive mortality value in patients with severe infections and
sept ic shock.
RECO MMENDA TIO N
Presepsin should be prescribed as a routine test to help diagnose
severity as well as predict mortality in patients with severe sepsis and
sept ic shock.