Đánh giá các nhân tố ảnh hưởng đến nhu cầu việc làm của lao động nông thôn ở thành phố cần thơ tt tiếng ang
Bạn đang xem bản rút gọn của tài liệu. Xem và tải ngay bản đầy đủ của tài liệu tại đây (711.19 KB, 31 trang )
MINISTRY OF EDUCATION AND TRAINING
CAN THO UNIVERSITY
----------------------
DOCTOR OF PHILOSOPHY DISSERTATION ABSTRACT
Major: Agricultural Economics
Code: 9620115
PHAM DUC THUAN
ASSESSMENT OF FACTORS AFFECTING THE
EMPLOYMENT NEEDS OF RURAL LABORERS
IN CAN THO CITY
Can Tho, 2019
THE PROJECT HAS COMPLETED
IN CAN THO UNIVERSITY
Instructor: Assoc. Prof., Ph.D: Duong Ngoc Thanh
The dissertation is defended to University’s Doctor of Philosophy
Dissertation Examination Council
In: Hall …. Can Tho University
At: …. Hour …..Date….. Month….Year
Reviewer 1:
Reviewer 2:
Find more information about dissertation at:
Can Tho University Learning Resource Center
National Library of Vietnam
LIST OF PUBLISHED PROJECTS
1. Duong Ngoc Thanh and Pham Duc Thuan, 2012. Determination
advantages and disadvantages - opportunities and challenges in
employment and apprenticeship of laborers in Can Tho City. Journal
of Economic Management, Ministry of Planning and Investment,
47:3-18
2. Pham Duc Thuan and Duong Ngoc Thanh, 2015. Assessment of
factors affecting the job finding ability of rural laborers in Can Tho
City. Can Tho University Journal of Science, 36c: 97-104.
3. Pham Duc Thuan and Duong Ngoc Thanh, 2015. Assessment of
factors affecting the participation in vocational training of rural
laborers in Can Tho City. Can Tho University Journal of Science, 40d:
83-91.
4. Duong Ngoc Thanh and Pham Duc Thuan, 2016, Chapter 3: Shift in
the economic structure, labor, rural employment, Duong Ngoc Thanh
(Editor): “Employment labor and rural vocational training in the
Mekong Delta (status quo and orientation)”. Can Tho University
Publishing House, pp. 36-60.
5. Duong Ngoc Thanh, Pham Duc Thuan and Nguyen Cong Toan,
2016. Chapter 7: Experience and orientation solutions for vocational
training, job creation in the process of industrialization and
urbanization, Book: “Employment labor and rural vocational training
in the Mekong Delta (status quo and orientation)”. Can Tho
University Publishing House, pp. 131-160.
Chapter 1
INTRODUCTION
1.1 Reasons for selecting the topic
Labor and employment are always one of the most pressing issues in
the world, the concern of all humanity in general and each nation in
particular. For each country, job creation is the basic solution to
maintaining political stability and economic development. In addition,
increasing population and urbanization have also led to a decline in
agricultural land, large family narrow house status quo, lack of
employment, which are avoidable. This status quo has been a barrier to the
socio-economic development of each locality and country. The current
status quo of labor resources in the city has not met the need for labor
recruitment of enterprises. The need for recruitment of skilled and highly
qualified laborers is increasing. There is a difference in recruitment needs
for sex between male and female laborers, between urban and rural areas.
In the rural areas in particular and the laborer of the whole city in
general, job creation for laborers is an urgent issue for local government
and each level of the city. Labor and employment pressures are increasing.
Employment need for rural laborers is a current issue. Actually, there are
no specific researches on the employment of rural laborers in the Mekong
Delta. The above status quo were chosen for the research topic:
“Assessment of factors affecting the employment needs of rural laborers
in Can Tho City”.
1.2 Research objectives
1.2.1 Overall objective
On the basis of synthesizing, studying theoretical bases on needs,
employment and rural labor shift to find new points in research. The study
aims to analyze and evaluate the factors affecting the employment needs of
rural laborers, and propose solutions to create jobs for rural laborers in the
future in accordance with local socio-economic conditions of Can Tho city.
1.2.2 Specific objective
(1) Study the theoretical basis of employment needs and rural labor
shift.
1
(2) Assessing the current situation of employment needs of rural
laborers (the on-farm laborers and off-farm laborers in agriculture) in Can
Tho city.
(3) Assessment of factors affecting the employment needs of rural
laborers in Can Tho city.
(4) Suggestion the solutions to meet the employment needs for rural
laborers in the future in Can Tho city.
1.3 Scope of research
1.3.1 Contents of research
(1) An overview of the theoretical basis of employment, needs,
vocational training, working time of laborers in domestic and foreign
studies.
(2) According to the theory, the dissertation gives research model for
analyzing and assessment of the factors affecting the employment needs of
laborers in Can Tho City.
(3) The thesis describes employment status, needs, vocational
training, working time of rural laborers (the on-farm laborers and off-farm
laborers in agriculture) in Can Tho city.
(4) The dissertation determined the factors affecting the employment
needs of laborers in Can Tho City. From the results of the analysis, it is
necessary to propose important solutions that will help rural laborers meet
their employment needs in the future.
1.3.2 Research subjects
The main research subject of this dissertation is employment needs
of the laborers in rural areas and in Can Tho City. The examined subjects
of the dissertation (on-farm laborers, off-farm laborers and non-farm
laborers) are laborers having suitable age in rural areas who are involved in
working in rural areas
1.3.3 Scope, location and time
- For time: collecting background data from 2013 to 2016 and primary
data from 2015 to 2015, and adding information on working time of rural
laborers.
2
- For location: researching location of the dissertation in rural areas
of Phong Dien, Thoi Lai, Co Do and Vinh Thanh District where have
features about agricultural production and rural labor source, accounting
for 68, 1 % of total rural laborers having suitable age in Can Tho City.
Chapter 2
OVERVIEW OF REFERENCE
2.1 The concept
2.1.1 Employment needs
Employment needs are the capabilities of the laborers themselves to
adapt to the working environment in order to satisfy their desires for
employment or to seek a work for the employees themselves.
2.1.2 Definition of research subjects
On-Farm is rural laborers who have agricultural land and work on their
land (referred to as on-farm).
Off-farm is rural laborers who work in field of agricultural production,
do not directly produce agriculture on their own land, and are hired to work
on other’s land.
Non-farm is rural laborers who work in field of non-agricultural (such
as industry, construction, service, and trade), indirect production in field of
agriculture (referred to as non-farm).
2.2 Experimental models of labor supply and labor shift
Experimental study on labor supply analysis (Soesta et al., 2002
Heckman, 1974; Arellano and Meghir, 1992), model of working hours
(Lundberg, 1988), assessment of unemployed and underemployed laborers
(Ham, 1982), analyzing the impact of immigration (Altonji and Card, 1991),
analyzing the trend of labor restructuring (Tuong Manh Dung, 2016; Le Duy
Mai Phuong, 2016).
2.3 Research frameworks
Inheriting from the research framework on the main sources of
household income (Junior Davis, 2006), on "Migration Syndrome" (Haas,
3
2010), analytical framework for migration decisions (Byerlee, 1974) ), the
linkages between the agricultural and non-agricultural sectors Le Xuan Ba,
2006), Theoretical framework of factors affecting the process of career
restructuring of Vietnamese agriculture (Vo Huu Hoa, 2018 ), Selfemployment research model of rural laborers in Nghe An province (Ho Thi
Dieu Anh, 2015) and synthesized from research materials at home and
abroad, combined with research objectives set out to build the research
framework of the thesis.
2.4 Overall assessment for research status
Based on the researches that have been reviewed, most studies have
approached the theoretical framework of labor movement between the two
regions, especially those that have applied the method of analyzing the
impact factors to the income and employment of laborers.
Regarding the assessment of labor migration (Byerlee, 1974; Haas,
2010) and on labor mobility (Juárez, 2000; Le Xuan Ba, 2006; Vo Huu Hoa,
2018), between the two agricultural sectors and non-agricultural sector,
between urban and rural areas to create jobs (Ho Thi Dieu Anh, 2015) or
provide jobs (Lundberg, 1988), creating income for laborers themselves.
The majority of studies have analyzed in relation to many labor migration
and employment of laborers, especially agricultural laborers in rural areas
(age, sex, health, qualifications and vocational training, land) affects the
employment and income of laborers.
Most of the studies focused on analyzing the research framework on
the impact of income groups, by the group of factors affecting households,
according to the factors affecting labor mobility between agricultural and
non-farm sectors. However, these studies have not clarified the internal
factors of individual laborers and external factors that directly affect the
employment needs of rural laborers.
However, the above empirical studies have not clarified the
employment needs of the laborers themselves, and still focus on analyzing
the transition between the two regions (agriculture and industry), not yet
focused. In-depth analysis of job needs shifted from working subjects to
agriculture from non-farm in rural areas (in which the agricultural sector in
rural areas has two subjects: on-farm labor and off-farm labor in agriculture
needs to shift jobs to non-farm labor).
One of the important factors in changing the work or finding jobs of
laborers, is the working time of laborers to meet the full time for work or
leisure time of laborers. to supplement the work to generate income for
4
laborers not specifically analyzed. This is a research issue of this thesis on
assessing factors affecting the employment needs of rural laborers.
In summary, the above empirical studies still focus on analyzing the
transition between the two regions (agriculture and industry), not focusing
on in-depth analysis of the employment needs of agricultural laborers.
village; Besides, empirical studies have not evaluated the working time of
labor (including idle time, overtime of labor). Therefore, the novelty of the
thesis is based on issues that have not been studied and mentioned as a basis
for the author to study the factors (internal and external) that affect the
employment needs of agricultural laborers. The village has a review of the
working time of the laborers.
Chapter 3
RESEARCH METHODOLOGY
3.1 Approach
With the application of the theory of labor shifting between the two
areas of Lewis (1954) and Oshima (1987) on the approach of the thesis is
to apply the theory of employment needs into practice to develop the
research framework of the thesis on employment needs of rural laborers. In
addition, research frameworks on labor supply by Byerlee (1974), Haas
(2010), Le Xuan Ba (2006), and Vo Huu Hoa (2018) also inherited factors
affecting job needs of rural labor and applying empirical research as a basis
for research, analysis and detection of gaps in the analysis of employment
needs between the two sectors (agriculture and industry) mentioned in
reasoning facilities. This is an important scientific basis, contributing to
proposing solutions to meet employment needs for rural laborers in the
coming time.
Regarding the content, the thesis focuses on overcoming the
shortcomings of previous studies through in-depth analysis of the following
main contents: (1) studying and analyzing the current situation of
employment needs of laborers rural areas (on-farm laborers and off-farm
laborers); (2) identify and assess factors affecting the employment needs of
rural laborers; (3) focus on developing solutions to meet the needs of rural
laborers in the future for Can Tho city.
5
3.2 Research Framework
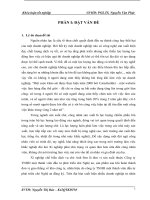
With the implementation of this research framework (Figure 3.1), the
dissertation focuses on how the internal factors of the rural laborers affect
their employment needs, at the same time, the analysis of external factors
affecting the job seeking to meet the needs of rural laborers in Can Tho city.
INTERNAL
FACTORS GROUP
- Age
ON-FARM
LABOERS
- Sex
- Health status
- Education and
professional level
- Income
- Unemployment
NEEDS
OFF-FARM
LABOERS
- Free time
FOR
LABOR
TRANSFER
EXTERNAL
FACTORS GROUP
- Dependent person
NON-FARM
LABOERS
- Productive land
- Vocational training
- Loan policy
Figure 3.1: General research theoretical framework
Source: Summarized and recommended by the author
The study of the dissertation deeply analyzes the needs for rural labor
employment (the will of the laborers themselves) according to each rural
labor subject, which is a thesis that adds to previous studies. includes the
following contents: (i) Researching the theoretical basis of employment
needs and rural labor transfer; (ii) Independent researches affecting the
employment needs of rural laborers; (iii) Focusing on solutions to meet the
employment needs of rural laborers in the coming time.
3.3 Methods of data collection
- Collection of the secondary data on vocational training,
employment, general policies from departments, localities, and published
research documents.
6
- Collect primary data of non-randomized stratification sampling
method, the number of observations is determined according to Cochran's
formula (1977). Total observations of 530, of which on-farm laborers are
210 observations, off-farm laborers are 110 observations, non-farm
laborers are 210 observations, from districts: Phong Dien, Thoi Lai and Co
Do and Vinh Thanh. The reason for choosing these districts is that there are
relatively many agricultural and production households in this district,
focusing on many rural laborers.
3.4 Methods of data analysis
3.4.1 Descriptive statistics method
Using descriptive statistical methods to assess the current situation of
employment needs of rural laborers by each subject, with indicators such
as frequency, rate, average number, variance in research to tissue describe
the status of internal factors (age, sex, health status, education and
professional level, income, unemployment, leisure time) and external
factors (dependent person, land production, vocational training policies,
loan policies) of rural laborers in Can Tho city.
Cross-Tabulation analysis
This goal focuses on identifying and analyzing the factors affecting
the employment needs of rural laborers by each subject.
According to Kamakura and Wedel (1997), this analysis is used to
examine “yes or no” relationship between two factors in the overall, this is
an independent test.
The chi-square (χ2-chi-square) test is suitable when two research
factors are discrete or quantitative variables.
Hypothesis in testing has the following contents:
H0: there is no relationship between variables (independent).
H1: there is a relationship between variables (dependent).
The Chi Chi square test value (-2- Chi-square) in the analysis results
will provide the significance of the test (P - Value). If the significance level
is less than or equal (the level of initial analysis = 0.05), the test is
completely meaningful or otherwise reject the hypothesis H0, meaning that
the variables are related. Conversely, variables are not related to each other.
7
3.4.2 Binary Logistics regression analysis method
Inherited from the model using Howard and Swidinsky's non-farm
labor participation (2000), Ho Thi Dieu Anh's model of self-employment
and non-farm employment (2015) and Tran Thi Minh Phuong, Nguyen Thi
Minh Hien (2014), used the Binary Logictics model to analyze the factors
affecting the shift to non-farm labor according to the employment needs of
rural laborers (1 = there is a need for on-farm laborers to switch to nonfarm labor or 0 = no need for agricultural laborers to switch to non-farm
labor).
For the dependent variable, whether or not a laborer has a need for
employment, the dependent variable Y now has two values, 0 and 1. For
predicting greater than 0.5 and 1.0, the result It is expected that there will be
a “yes” event of employment needs, whereas the expected result will be “no”.
Regression model of general theory takes the form:
k
k
j
j
Pi
P(Y = 1)
Ln (
) = Ln [
] α + ∑ βi Xi + ∑ γj Dj + ui
1 − Pi
P(Y = 0) 0
Where: Ln (
Pi
1−Pi
) is log-odds ratio, this ratio is a linear function of Xi
and Dj explanatory variables.
With P (Y = 1) = P0: probability when a laborer needs a job
(employment needs on-farm laborers, off-farm laborers and non-farm
laborers);
P (Y = 0) = 1-P0: Probability when labor does not have a need for
employment (employment needs on-farm laborers, off-farm laborers and
non-farm laborers).
k
k
j
j
P0
Ln (
) = α0 + ∑ βi Xi + ∑ γj Dj + ui
1 − P0
It is based on the above relevant research information whereby the
regression model assesses the factors that affect the employment needs of
rural laborers as follows:
Y=β0 + β1X1 + β2X2 + β3X3 + β4X4 + β5X5 + β6X6 + β7X7 + β8X8 +… + ε
(1) In case of agricultural labor, there is a need for employment to shift
to non-farm labor
Y1 = 1: rural laborers have a job needs shifting from on-farm laborers
to non-farm laborers (find /convert new jobs, ...);
8
Y1 = 0: rural laborers have no need to shift from from on-farm
laborers to non-farm laborers.
(2) In case of hired labor in agriculture, there is a need for jobs shifting
to off-farm labor
Y2 = 1: rural laborers have a job need shifting from off-farm laborers
to non-farml laborers (find /convert new jobs, ...);
Y2 = 0: rural laborers do not have a job need to shift from off-farm
laborers r e to non-farm laborers.
Where:
- β0 is the root factor (constant);
- βi is the estimated coefficient of the independent variables for the
dependent variable.
- Xi are independent variables.
3.4.3 Tobit regression analysis method
According to Xiao-Yuan Dong, Hongqin Chang and Fiona Macphail
(2011), the Tobit function is used to solve the dependent variable,
comparing the time spent by individuals in households with and without
people. migration indicates that there is a positive relationship between
migration and the working time of laborers, including both the elderly and
the sex.
On the basis of inheriting from the factors studied and proposed in
Section 3.6.2, and collecting primary data from 300 observations (on-farm
labor, off-farm labor, non-farm labor, each object is 100 observations).
Tobit model is presented as follows:
𝑦1∗ = β𝑋𝑖 + 𝑢𝑖 (∗)
𝑦𝑖 = {
0 (∗∗)
Case (*) if 𝑦1∗ > 0 and (**) if 𝑦1∗ ≤ 0
The regression function looks like this:
y = β0 + β1X1 + β2X2 + β3X3 + β4X4 + β5X5 + β6X6 +… + ui
Where: y is the dependent variable of working time of labor.
β is the regression coefficient of the model.
ui is the wrong number.
Xi are independent variables.
9
3.4.4 Methods of general analysis
On the basis of analyzing the current situation of employment needs
and identifying factors affecting employment needs for rural laborers, to
propose solutions for each type of labor (on-farm labor, off-farm labor, nonfarm labor).
Chapter 4
RESULTS AND DISCUSSIONS
4.1 EVALUATION OF THE SITUATION OF RURAL LABOR
Factors affecting the employment needs of rural laborers by subjects:
age, sex, health status, education and professional level, idle time, vocational
training, policy loan support, and job transfer needs of laborers. The abovementioned factors have been tested for squared expenditure and there is a
difference in the tendency to shift the employment needs of on-farm
laboerers and off-farm laborers to non-farm laborers in the Can Tho city.
Employment situation of rural laborers: through observing results,
rural laborers involved in agricultural production accounted for 26.3%, the
main work of rice production was the main, because the family had land.
The labor employed in agriculture only accounts for 6.0%, the main job is
working in agriculture (making land, harvesting rice, harvesting vegetables
and fruit trees, working as hired laborers in fish ponds), due to familiar with
on-farm, not qualified. As for non-farm laborers, the work is very diverse
such as small business, repairing motorcycles, accessories, porters,
laborers, housework, ... accounting for 67.7%, most of the source this labor
has received vocational training.
The needs of job transfer of rural laborers: according to the survey
results, it is also shown that laborers need jobs and early job search when
rural laborers participate in training, and besides laborers supported by local
leaders (commune and district level) such as: providing information on
employment and vocational training, jointly organizing job fairs in the
district, coordinating with the Main Bank social books on lending for job
creation, introduction of vocational training institutions (linking between
vocational training and job introduction centers in districts with training
enterprises according to labor recruitment needs), ...
Employment needs of agricultural laborers: the group of on-farm
laborers who want to improve their income in order to find more jobs, as
10
the industrialization and urbanization process continues to thrive now,
along with the transforming labor structure from agriculture to nonindustrial sectors (industry, construction, trade and services) inevitably.
The needs for job transfer of off-farm laborers in agriculture: for
laborers working in agriculture, jobs without skills, qualifications and easyto-work jobs need only be healthy and experienced in agricultural
production; In addition to the idle time, laborers working in agriculture also
do more non-farm jobs such as: taking leaf cones, knitting hyacinths,
knitting baskets,... at home. Similarly, the off-farm laborers also needs jobs
to shift to non-farm laborers, with the desire to seek careers with sufficient
income to cover the costs of living, in such jobs or jobs in the non-farm
sector attract more laborers.
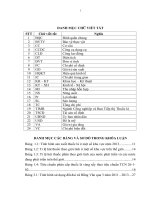
On the basis of testing Chi-square (-2- Chi-square) to test the
hypothesis, there is no difference in employment needds among rural labor
groups (on-farm laborers and off-farm laborers) in Can Tho city.
Table 4.1: Verification of squared expenditures of rural laborers
Nhân tố
STT
Giá trị χ2
df
Sig (α)
103,378
3
0,000
Sex
5,224
1
0,022
3
Health status
5,951
1
0,015
4
Education and professional level
20,676
3
0,000
5
Working time
98,316
3
0,000
6
Vocational training
10,643
1
0,001
7
Loan support policy
17,735
1
0,000
8
Unemployment (employment status)
6,688
1
0,010
9
Income
Where:
- Income of on-farm
- Income of off-farm
27,092
23,269
3
3
0,000
0,000
10
Dependent person
Where:
- Dependent person of on-farm
- Dependent person of off-farm
39,524
9,825
3
3
0,000
0,020
11
Production land
1
Age
2
11
STT
Nhân tố
Giá trị χ2
df
Sig (α)
Where:
- Production land of on-farm
- Production land of off-farm
25,766
12,627
2
3
0,001
0,006
12
Job needs and job search of rural laborers
11,540
1
0,001
13
Job needs and job search of agricultural laborers
(on-farm)
5,520
1
0,019
14
Job needs and employment of off-farm laborers
(off-farm)
6,138
1
0,013
Source: Synthesis, treatment from the survey results 320 observed TPCT, 2018-2019.
According to Table 4.1, with values χ2 and sig values. (α) are all less
than 5%, the test is completely meaningful, showing the difference in the
employment needs of rural laborers from on-farm laborers and off-farm
laborers to non-farm laborers activities in Can Tho city, in other words,
reject the theory there is no difference between the situation of
employment needs among on-farm laborers and off-farm laborers in Can
Tho city.
4.2 Analysis of factors affecting the employment time of rural laborers
From the collected data of 530 survey samples, the results of checking
and checking the correctness of the data have 300 survey samples suitable
for analyzing the Tobit model to determine the factors affecting the
employment needs of rural labor.
The regression function looks like this:
y = β0 + β1X1 + β2X2 + β3X3 + β4X4 + β5X5 + β6X6 + … + ui
Wher: y is the working time of labor (day).
β is the regression coefficient of the model.
ui is the wrong number.
Xi are independent variables. As follows:
X1 = Age: Age affects job performance (year)
X2 = Sex: 1 = Male; 0 = Female
X3 = Health status: Health status of laborers to participate in work (1
= healthy enough to participate in labor; 0 = not healthy enough
to work)
12
X4 = Education and professional level: According to the class. (0 =
illiterate; 1 = class 1; 2 = class 2; 3 = class 3; 4 = class 4; 5 = class
5; 6 = class 6; 7 = class 7; 8 = class 8; 9 = class 9; 10 = grade 10;
11 = grade 11; 12 = grade 12; 14 = intermediate; 15 = college; 16
= university; 20 = college)
X5 = Unemployment: Unemployment and unpaid work for more than
6 months / year (1 = Unemployment; 0 = employment)
X6 = Number of members: Total number of household members
(people)
X7 = Production land: Conditions of agricultural production and not
much impact on non-agricultural production (1,000 m2)
X8 = Vocational training: Employees participating in vocational
training offer jobs (1 = participating in vocational training; 0 = not
participating in vocational training)
X9 = Loan support policy: 1 = loan support; 0 = no loan support
X10 = ONFRAM: ONFRAM dummy variable is used to distinguish
regression function of On-farm labor groups, 1 = ONFARM
operation, 0 = no)
X11 = OFFARM: OFFFRAM dummy variable is used to distinguish
regression function of Off-farm labor groups (1 = OFFARM
operation, 0 = no
X12 = Cumulative capital: The amount of self-owned capital
accumulated in the year (million VND / month)
X13 = 2016 Income: Household's profit accumulated in the year
(million VND / month)
X14 = 2017 Income: Household's profit accumulated in the year
(million VND / month)
X15 = 2018 Income: The amount of household income accumulated in
the year (million VND / month)
X16 = Work experience of On-farm laborers: Work experience of
agricultural laborers who have done (1 = less than 1 year; 2 = 1 to
under 3 years; 3 = from 3 to less than 5 years, 4 = from 5 to under
10 years, 5 = from over 10 years)
13
X17 = Working experience of Off-farm laborers: Work experience of
employees working in agriculture who have done (1 = less than 1
year; 2 = words 1 to less than 3 years 3 = from 3 to less than 5
years, 4 = from 5 to under 10 years, 5 = from over 10 years)
X18 = Work experience of Non-farm laborers: It is the work experience
of non-farm laborers who have done (1 = less than 1 year; 2 = 1
to under 3 years, 3 = from 3 to less than 5 years, 4 = from 5 to
under 10 years, 5 = from over 10 years)
X19 = Average number of idle days per year (in 3 years): Number of
idle days of rural laborers per year for 3 years (days)
X20 = On-farm average: On-farm number of overtime working days
per year for 3 years (date)
X21 = Off-farm average: Number of extra working days of an Off-farm
laborer over the year for 3 years (date)
X22 = Average number of overtime days (Non-farm): Number of
overtime working days for non-farm laborers (Non-farm) per year
for 3 years (date)
X23 = Average number of idle days per month (in 3 years): Number of
idle days of rural laborers per month for 3 years (date)
X24 = On-farm average: On-farm number of overtime working days
per month for 3 years (date)
X25 = Off-farm average: Number of extra working days of an off-farm
employee per month for 3 years (date)
X26 = Non-farm average: Number of extra working days of rural
laborers per month for 3 years (date)
X27 = Employed labor: Total number of employed people in the
household (people)
X28 = Remuneration increased over the year: Remuneration for rural
laborers is paid per year (million dong)
14
X29 = On-farm price: On-farm wages are paid on a year (million dong)
X30 = Off-farm price: On-farm wages are paid per year (million VND)
X31 = Non-farm price: Non-farm wage: On-farm wages paid per year
(million VND)
Regression analysis by Tobit model with blocked variable is the
number of working days / months of rural laborers to determine the factors
affecting the working time of rural labor groups.
Table 4.2: Results of regression analysis of factors affecting the
employment time of rural laborers (second time)
Khoản mục
Age
Sex
Education and professional level
Health status
Production land
Unemployment
Work experience of On-farm laborers
Working experience of Off-farm laborer
Working experience of Non-farm laborer
OFFARM
ONFRAM
Number of members
Employed labor
2016 Income
2017 Income
2018 Income
Average number of idle days per year (in 3
years)
Constant
Coef.
Std.E
rr.
T
P>|t|
-0,062
0,119
0,011
-0,339
0,012
17,898
-0,051
-0,016
0,011
9,914
9,914
-0,216
0,220
0,429
-0,313
-0,163
0,035
0,166
0,025
0,327
0,046
0,41
0,028
0,01
0,016
0,291
0,198
0,134
0,245
0,158
0,168
0,724
-1,79
0,71
0,44
-1,04
0,26
43,08
-1,82
-1,02
0,72
18,04
50,09
-1,61
0,90
0,27
-1,87
-2,26
0,075
0,476
0,661
0,301
0,798
0,000
0,070
0,308
0,474
0,000
0,000
0,108
0,370
0,786
0,063
0,025
0,304
0,030
10,27
0,000
3,579
0,037
3,96
0,000
Source: Synthesis, treatment from the survey results 300 observed TPCT, 2018-2019.
Accordingly, in the case of a set of data, 300 households are screened
from the interview results; Tobit regression analysis results with blocked
variables are the number of working days / months of on-farm, off-farm
and non-farm labor groups. The results show the factors affecting the
number of working days / month including employment status, agricultural
15
work experience (on-farm), 2017 income accumulation and income
accumulation in 2018; These variables are statistically significant at the 1%
level in the Tobit model. In addition, factors with variables with statistical
significance at 10% can also be considered including turning age and
number of family members.
The results of Tobit regression analysis in the case of removing
factors are not statistically significant (2nd time), then get the parameter
values of the regression model, Pseudo R2 = 0.4526, LR Average method =
845,40, Prob> Chi squared = 0,000 and Spearman correlation coefficient
between variables < 0.6, so there is no multicollinearity phenomenon so the
model is statistically and appropriately, including the factor as follows:
(1) The employment status factor (binary variable) affects the
number of working days in a month at a statistically significant 1% level
and positive sign. With a regression coefficient of 17,898, it shows that
employment status (1 = having a job or 0 = unemployment) is a positive
impact on the number of working days / months of rural laborers. Those
who are employed will tend to increase the number of working days in a
month than those without jobs.
(2) The on-farm work experience factor (continuous variable):
affects the number of working days in a month at a statistically significant
1% level and negative sign. With a regression coefficient of -0,051, it shows
that agricultural production experience has a negative impact on the number
of working days / months of rural laborers. In other words, people with
more experience in agricultural production, higher productivity will tend to
reduce the number of working days in the month. However, this coefficient
is quite low, indicating that the improvement is negligible. This is
consistent with the judgment of Nguyen Bich Lam (2018) that by 2017, our
country still has 21.6 million employees working in agriculture, forestry
and fishery, while labor productivity this area only reached 35.5 million
VND / labor, equaling 38.1% of the general labor productivity of the
economy; equal to 29.4% of labor productivity in industry and construction
and 31.3% of labor productivity of service sectors. If calculated according
to the average number of actual working hours, the hourly labor
productivity in this area also improved insignificantly, only about 43.3% of
the overall productivity level; equal to 37.4% of labor productivity in
industry and construction and 30.3% of service sector productivity.
Through the survey results on the quantitative comparison of demographic
factors, working time, free time, income, ... of individuals, family members
of survey subjects and of all households are compared based on the criteria
of labor subgroups of the surveyed subjects.
16
(3) Factors of family members (continuous variables): affect the
number of working days in the month at the 10% statistically significant
level and negative sign. With a regression coefficient of -0,216, it shows
that the number of family members is a factor that has a negative impact on
the number of working days per month of rural laborers. In other words, the
more members the family has, the more likely it is to reduce the number of
working days in the month because they can share the work for the
remaining members. Through survey results on family members of the
survey subjects and based on labor subgroups of the surveyed subjects.
(4) Income accumulation factor in 2017 and accumulated income
in 2018 (continuous variable): affect the number of working days in the
month at a statistically significant level of 5% and negative sign. With
corresponding regression coefficients of -3.13e-07 and -1.63e-07, it is
shown that income accumulation is a factor that has a negative impact on
the number of working days / months of rural laborers. In other words, the
more families accumulate (with savings), there will be a tendency to reduce
the number of working days. Through the survey results on wage unit prices
and income from overtime jobs of rural labor groups, of which the income
of the on-farm labor group is mainly derived from agricultural production
activities. and doing more at idle periods of time; Similarly, off-farm and
non-farm labor groups also earn their main income from their main
activities. Other parts of the work they take advantage of when they have
idle time from the main job income arises insignificantly.
(5) For two dummy variables (ONFARM AND OFFARM): to
determine the working group, the case of the on-farm model group (on-farm
value = 1; the remaining groups have the value 0 ) the number of working
days will tend to be higher with a coefficient of 9,914 compared to the offfarm group (off-farm = 1; the remaining groups will have a value of 0) with
a coefficient of 9,914, and the rest is non-farm model (on-farm value and
off-farm = 0). Accordingly, the number of working days / months of the onfarm group tends to increase over the remaining groups. This is consistent
with the results of the analysis of the absolute growth rate of the elements
of working time of rural labor through the years 2016, 2017 and 2018
above. Next is the off-farm labor group that tends to increase more than the
non-farm group. This is also in line with the fact that laborers working in
agriculture, although they have done according to the number of hours the
tenant has set, however, they still want to increase the number of working
hours to earn more income. And for non-farm groups, due to the non-farm
nature of the work, the working hours are more stable.
17
(6) Average number of idle days per year (in 3 years): shows that
households have more idle time will increase working time. Through the
survey results on analyzing volatility analysis of the average growth factors
(absolute number) of the income accumulation criteria, the amount of
overtime work, the number of idle days, the number of extra working days
and the price wages of labor groups surveyed in 3 years 2016, 2017 and
2018, noted:
- Accumulate income of on-farm group with an average increase of
2.2 million VND; off-farm groups rose 0.8 million and non-farm groups
increased 0.8 million. This result is consistent with the General Statistics
Office's data for the average monthly income of employed laborers in the
first quarter of 2019, reaching 5.7 million dong / month, an increase of 670
thousand dong from the previous quarter and an increase of VND 1.03
million compared to the same period last year. The average income of urban
laborers is 3 million VND higher than that of rural laborers (7.7 million
VND and 4.7 million VND respectively). At the same time, the average
monthly income of wage laborers in the first quarter of 2019 is estimated at
6.9 million VND / month, an increase of 1.05 million compared to the same
period last year; urban labor is 8.2 million dong / month, rural labor is 6.0
million dong / month.
- The number of idle days in a month and year of working groups onfarm, off-farm and non-farm also tends to decrease over the years;
respectively -0.3, -0.4 and -0.3 days / month and -5.0; -5,24; -5,3 days /
year. This is a positive signal that employment in rural areas of Can Tho
city has improved over the years.
- Regarding working time, the number of overtime working days in
the month and in the year of the groups for agricultural jobs tends to
increase. In particular, the on-farm group had the most increasing days,
followed by the off-farm group and finally the non-farm group.
- Wages for each type of on-farm, off-farm and non-farm jobs also
tend to increase over time.
4.3 Evaluate factors affecting the employment needs of rural laborers
From the collected data of 530 survey samples for regression analysis
(Binary Logistics model) identified the factors affecting the employment
needs of rural laborers.
The regression function looks like this:
Y=β0 + β1X1 + β2X2 + β3X3 + β4X4 + β5X5 + β6X6 + β7X7 + β8X8 +… + ε
Where:
18
Y1 = 1: rural laborers have a job need to shift to non-farm labor (find convert
new jobs);
Y1 = 0: rural laborers do not have a job need to shift to non-farm labor.
- β0 is the root factor (constant);
- βi is the estimated coefficient of the independent variables for the
dependent variable.
- Xi are independent variables.
The independent variables included in the model include:
X1 = Age (in working age);
X2 = Sex (0 = female; 1 = male);
X3 = Health status (1 = healthy enough to participate in labor; 0 = not
healthy enough to participate in labor);
X4 = Education and professional level (0=illiterate; 1=class 1; 2=class
2; 3=grade 3; 4=grade 4; 5=grade 5; 6=grade 6; 7=grade 7 ; 8 =
grade 8; 9=grade 9; 10=grade 10; 11=grade 11; 12=grade 12;
14=intermediate level; 15=college; 16=university; 20=university
level;
X5 = Income (million VND / month);
X6 = Unemployed (1 = Unemployed; 0 = employed), is a labor
situation that is not hired and is not paid over 6 months / year
X7 = Working time (number of working months);
X8 = Dependent person (people);
X9 = Production land (1,000m2);
X10 = Vocational training (1 = vocational training; 0 = no vocational
training);
X11 = Loan support policy (1 = loan support; 0 = no loan support);
4.3.1 Evaluate factors affecting the employment needs of on-farm
laborers shifting to non-framl labor
The hypothesis test results of the general fit of tissue have significant
significance to observe Sig <0.1 and Sig.> 0.1 so we completely reject the
hypothesis H0 with equal and equal coefficients 0. The correct prediction
level of the entire model is 80.5%, the regression coefficients are significant
for Sig values < 0.05 and Sig. < 0.10, we have independent variables
meaning statistically including 7 factors (age, education and professional
level, income, unemployment, working time, dependent person and
vocational training) affecting the employment needs of on-farm laborers
19
shifting to non-farm laborers, with a significance level of less than 10%. As
follows:
Table 4.3: Results of regression analysis of employment needs of onfarm laborers shifting to non-fram laborers
Items
X1 = Age
X2 = Sex
X3 = Health status
X4 = Education and professional level
X5 = Income
X6 = Unemployed
X7 = Working time
X8 = Dependent person
X9 = Production land
X10 = Vocational training
X11 = Loan support policy
Constant
B
-0,079
0,253
0,167
1,046
0,104
1,334
-0,499
2,177
-0,713
1,677
0,641
8,933
S.E.
0,078
0,432
0,697
0,464
0,002
0,785
0,174
0,189
0,456
0,423
0,463
1,839
Wald df
2,237 1
0,343 1
0,309 1
4,514 1
2,051 1
2,890 1
8,234 1
3,876 1
2,442 1
3,563 1
1,920 1
23,605 1
Sig. Exp(B)
0,063
0,924
0,558
1,287
0,223
1,182
0,017
2,847
0,082
1,109
0,089
3,795
0,004
0,607
0,035
8,819
0,118
0,490
0,049
5,349
0,166
1,899
0,000
7.579
Source: Synthesis, treatment from the survey results 210 observed TPCT, 2018-2019.
X1 = Age: turning age with a negative value, showing that the higher
the age of on-farm laborers, the lower the possibility of finding a job,
because of obstacles because of health, so it does not guarantee good jobs
and age If it is high, it is obstructed because of health, so it does not
guarantee a good job, but some other jobs are also indirect (housework,
child care) to help non-farm laborers reduce their expenses towel.
X4 = Education level and Professional qualification: variable with
positive value, showing that agricultural laborers have high educational and
professional qualifications, they want to have a job needs shifting from
agricultural production to non-farm.
X5 = Income: variable with positive value, showing that on-farm
laborers have higher income, agricultural laborers have a needs for jobs
shifting from agricultural laborers to non-farml laborers, they want to find
jobs in non-agricultural areas to get higher income.
X6 = Unemployment: Unemployment is a positive value, indicating
the unemployment of on-farm laborers affecting the needs for jobs shifting
from agricultural labor to non-farm labor, reflected when Unemployed
laborers find jobs suitable to their capacity and experience to earn income
(unemployment is often due to natural disasters, during the period of
20
conversion of crops, livestock, time of soil and disease improvement
disability).
X7 = Working time: making working time has a negative value,
showing that the less time working in agricultural production, the more onfarm laborers have the needs to shift from on-farm laborers to non-farm
laborers.
X8 = Dependent person: making dependent person of positive value,
showing that the more Dependent person in the household, the more onfarm laborers have the needs to shift from agricultural laborers to non-farm
laborers many, reflecting the need for laborers to have income to pay for
living expenses of family and themselves.
X10 = Vocational training: positive vocational training variables,
showing that the more agricultural laborers are interested in vocational
training, the more dependent the number of dependent person in the
household is job needs shifted from on-farm laborers to higher non-farm
laborers, vocational training is the foundation for basic baggage for nonfarm laborers (qualification, professional knowledge), helping people
laborers get better jobs and especially stable incomes.
In short, agricultural laborers have a needs for jobs, they want to
have regular jobs (due to seasonal production, free time), so they look for
suitable jobs to create more income for elderly laborers, such as cooperating
with businesses or joining cooperative and cooperative groups in
agricultural production, but most on-farm laborers (young people) want to
seek jobs in non-agricultural areas have higher incomes, deal with
household expenses, support or provide for dependent person (school-aged
children, frail older people, people with disabilities, unemployed,…).
4.3.2 Evaluate factors affecting the employment needs of off-farm
laborers shifting to non-farm laborers
The hypothesis test results of the general fit of tissue have significant
significance to observe Sig < 0.1 and Sig. > 0.1 so we completely reject the
hypothesis H0 with equal and equal coefficients 0. The correct prediction
level of the entire model is 92.7%, the regression coefficients are significant
for Sig values. < 0.05 and Sig. < 0.10, we have independent variables with
statistical significance including 05 factors (income, unemployment,
working time, dependent person and vocational training) that affect the
21
employment needs of people off-farm laborers has shifted to non-farm
laborers, with a significance of less than 10%. As follows:
Table 4.4: Results of regression analysis of employment needs of offfarm laborers shifting to non-fram laborers
Items
X1 = Age
X2 = Sex
X3 = Health status
X4 = Education and professional level
X5 = Income
X6 = Unemployed
X7 = Working time
X8 = Dependent person
X9 = Production land
X10 = Vocational training
X11 = Loan support policy
Constant
B
-0,019
-1,816
1,541
-0,228
-1,026
2,287
-0,863
1,957
-0,457
1,437
2,071
6,314
S.E.
0,090
1,381
1,101
0,332
0,017
1,150
0,813
0,760
0,476
0,924
1,361
8,030
Wald df
0,044 1
1,729 1
1,962 1
0,473 1
3,380 1
9,062 1
5,052 1
3,586 1
0,923 1
4,422 1
2,315 1
1,345 1
Sig.
Exp(B)
0,833
0,981
0,189
0,163
0,161
4,671
0,492
0,796
0,043
0,359
0,003
9,845
0,009
0,422
0,038
7,078
0,337
0,633
0,020
4,209
0,128
7,935
0,246 552,185
Source: Synthesis, treatment from the survey results 110 observed TPCT, 2018-2019.
X5 = Income: variable with negative value, shows that the lower wage
earners work, the more jobs are needed to shift to non-farm laborers.
X6 = Unemployment: Unemployment is a positive value, indicating
that the higher the unemployment rate of off-farm laborers working in
agriculture, the higher the employment needs will be shifted to non-farm
laborers.
X7 = Working time: making working time has a negative value,
showing that the working time of off-farm laborers is less, the more people
working in agriculture, the more jobs are needed higher non-farm laborers.
X8 = Dependent person: turning dependent person with positive
values, showing that the more dependent person in the household, the more
off-farm laborers in the agricultural sector have the needs to shift from nonfarm laborers. The more agriculture, the more dependent person are
laborers who have not yet reached the working age and the elderly in the
family, who do not generate additional income, but depend on the main
labor of the family. Most of them are poor households who often have no
land or little land to cultivate, so they live on hired labor as their main
source of income, which is very limited, not enough to cover expenditures
in the peak, so they need to find finding better jobs and better incomes to
22