Spatial and temporal variation of soil water movement modeling under line source dripper
Bạn đang xem bản rút gọn của tài liệu. Xem và tải ngay bản đầy đủ của tài liệu tại đây (600.43 KB, 8 trang )
Int.J.Curr.Microbiol.App.Sci (2019) 8(5): 1926-1933
International Journal of Current Microbiology and Applied Sciences
ISSN: 2319-7706 Volume 8 Number 05 (2019)
Journal homepage:
Original Research Article
/>
Spatial and Temporal Variation of Soil Water Movement
Modeling under Line Source Dripper
R. Rahul1* and M. Manikandan2
1
Department of Soil and Water Conservation Engineering, 2Department of Irrigation and
Drainage Engineering, Agricultural Engineering College and Research Institute, Tamil Nadu
Agricultural University, Kumulur - 621712, Trichy, India
*Corresponding author
ABSTRACT
Keywords
Water distribution,
Wetted width,
Wetted radius, Drip
irrigation, Surfer
Article Info
Accepted:
15 April 2019
Available Online:
10 May 2019
An attempt was made to study the soil water movement under two type of plastic mulch
(black and white) with drip irrigated eggplant on a line source dripper. Both spatial and
temporal variation of wetting pattern was determined in sandy loam soil using surfer 15
software. The layout of the experiment was three treatments tested, black mulched drip
irrigation (BM+DI), white mulched drip irrigation (WM+DI) and drip irrigation without
mulching. The results of the study indicated that DI + BM and DI + WM treatments
distinctly decreased water applied in the order of DI + WM < DI + BM < DI. Therefore,
drip irrigation in combination with plastic mulch especially black mulch to be more
effective irrigation method while may help to improve water use efficiency and yield of
eggplant. Exponential, Linear, Logarithmic, polynomial and power model were fitted to
horizontal and vertical water movement for different time intervals. The result showed that
power and polynomial model with R2 value equal to 0.9832 and 0.9804 was the best fitting
model in predicting horizontal and vertical water movement. The results from this study
will be useful in addressing the most challenging issues like selection of emitter flow rate,
dripper spacing based on water requirement of crop and designing the entire drip irrigation
system.
Introduction
Water management is a key factor in
agricultural production. India shares 17% of
global production with 2.4% land and 4.0% of
world water resource (Singh et al.,
2006).Hence efficient utilization of available
water resource is mandatory in India. Around
90% of water resources are used for
agriculture and allied activities in India. Out
of these only 50% of water is used by plants
and remaining is wasted either evaporation or
deep percolation. This is because of
traditional methods are practiced for
irrigation. Widely known best water saving
irrigation technique is the drip irrigation
system. In this method, irrigation water is
directly applied to the plant root zone, which
minimizes the evaporation, percolation and
other water losses (Suryavanshi et al., 2015).
1926
Int.J.Curr.Microbiol.App.Sci (2019) 8(5): 1926-1933
The velocity of water affects the horizontal
and vertical water distribution in soil. In
surface drip irrigation, water distribution
depends on many factors like soil properties,
discharge rate of the dripper, amount of water
applied in each irrigation and water uptake by
plants (Mallikarjun Reddy et al., 2018). Those
parameters are useful for designing and
operating drip irrigation system. Among the
soil physical properties, the water distribution
is significantly affected by soil texture.
Several empirical models are available to
estimate the wetting front from the surface
and subsurface drip irrigation system.
Schwartzman and Zur (1986) developed an
empirical model to predict the wetted front
under different operating time and different
discharge rate. Liu and Xu (2018) estimated
wetting pattern under different application
time on substrate drip irrigation system. AlOgaidi et al., (2016) conducted laboratory
experiment to determine the wetting depth
and radius using empirical model. Acar et al.,
(2009) studied wetting pattern to determine
the lateral and emitter spacing under trickle
irrigation system. Kandelous and Šimůnek,
(2010) compared numerical, analytical,
empirical models to estimate wetting patterns
for surface and subsurface drip irrigation
system. This study attempts to determine the
spatial and temporal distribution of water in
different depth of soil which will be useful for
designing and operating a drip irrigation
system (DIS).
international Robinson pipette method, the
soil texture was found to be an average value
of 74% sand, 14% silt, and 12% clay, which
belongs to sandy loam soil. By using double
ring in filtrometer test, the infiltration rate
was determined as 1.71cm h-1 (Mashayekhi et
al., 2016). The field capacity and wilting
point for the soil were estimated by using
pressure plate apparatus such as 22.26% and
9.52%.Bulk density of the soil sample was
1.413g/cc it was determined by core cutter
method. Similarly (Zhang et al., 2012 and
Laulina et al., 2019) also obtained field
capacity of sandy loam soil was in the range
of 21-23%.
Materials and Methods
The soil water movement was determined
using tensiometers for maximum rooting
depth of eggplant. Tensoimeter was calibrated
in the field by correlating with tension and
volumetric water content measured by
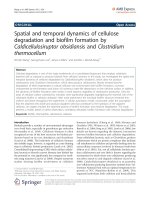
gravimetric method. Soil water retention
curves were given in Figure 2. Moisture
reading was taken at horizontal and vertical
10 cm interval to the plant just after irrigation,
24hafter irrigation and 48h after irrigation for
determination of change in soil water storage.
The study was conducted at Central Farm of
Agricultural Engineering College and
Research Institute, Kumulur, Tamil Nadu
(Latitude: 10ᵒ92’ N; Longitude: 78ᵒ82’ E;
62m above the Mean Sea Level). The average
annual precipitation is about 881.412 mm
(Vaidheki and Arulanandu, 2017). Soil
samples were collected from the experimental
field at different depths. By using
The Eggplant (Solanum melongena L.)
variety Dhruva F1 selected for the
experiment. The study was conducted for the
season November 2018 to March 2019, on
one side of the each furrow by keeping rowto-row and plant-to-plant distance 90 cm and
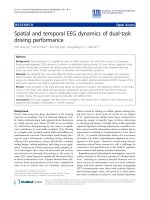
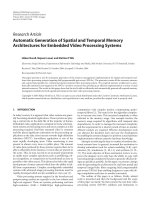
45 cm respectively. The layout of the
experiment was three treatments tested, black
mulched drip irrigation (BM+DI), white
mulched drip irrigation (WM+DI) and drip
irrigation without mulching as shows in (Fig.
1). The irrigation was carried out line source
of drip irrigation system with emitters 4lph
spaced 45cm apart, by each plant, on 16mm
(ID) laterals, one per row of eggplant. The
emitters operate at a pressure of 1kg/cm2,
which
was
controlled
with
bypass
arrangement.
1927
Int.J.Curr.Microbiol.App.Sci (2019) 8(5): 1926-1933
Contour map was plotted from the data
recorded during the experimental field for
discharge rate of 4lph using surfer 15
software.
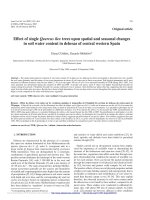
Measurement of Horizontal and vertical
water movement
The DIS with lateral having discharge of 4lph
per meter length was installed in the field.
The laterals have line source dripper with
dripper spacing of 45cm. A pit was dug across
wetted depth and along the length of the drip
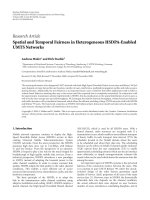
lateral, this operation was done manually. The
horizontal and vertical wetted zone was
measured at 10 min, 20 min, 30 min, 50 min,
60 min, 70 min, 80 min, 90 min, 100 min, 120
min and 140 min after operation of DIS. The
measurement was done using meter scale as
shown in Figure 3.
Description of various models
Statistical modeling
The statistical analysis was done to find out
the best wetting front model at different
operating time in the line source drip
irrigation system. The statistical models used
were Exponential, Linear, Logarithmic,
Polynomial and Power model. The R2 value
and regression equation for all models were
estimated in MS excel. Using the best fitting
model, the horizontal wetting radius and
vertical wetting depth was predicted. A
comparison was done between the observed
and predicted values of horizontal and vertical
water movement.
Empirical modeling
Schwartzman and Zur (1986) developed an
empirical model to estimate the soil water
movement from a surface line source. The
empirical model was developed using
experimental results for sandy loam soil for
the flow rate of emitter is 4lph.
W = 3.71(V)0.42( )-0.084
(1)
Z = 1.15(V) 0.66( ) 0.162
(2)
Where W and Z are horizontal and vertical
soil water movement in meters, similarly V is
the total volume of water applied (m3), q is
the emitter discharge rate (m3s-1), and
is
the soil saturated hydraulic conductivity
(ms-1).
Results and Discussion
Water movement in the soil
The field experiments were carried out to
measure the soil water movement in sandy
loam soil cropped with eggplant. Field data of
soil moisture were taken all the three
treatment, but best treatment were selected
black mulched drip irrigation (DI+BM)
having highest soil moisture values compared
to white mulched drip irrigation (WM+DI)
and drip irrigation without mulching.
Calibration of model was done using the
values of soil moisture at root zone depth, the
data were observed at just after, 24h, and 48h
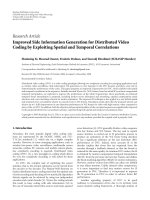
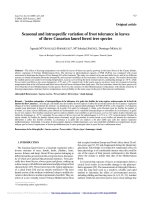
after irrigation. Figure 4 shows the soil water
movement measured by tensiometer just after,
24h and 48h after irrigation drawn by surfer
15 software.
The soil water movement result was done at
the end of second month after transplanting
was taken. These readings indicate that plastic
mulching has a distinct effect on drip
irrigation effectiveness through the good
estimation of wetting bulb’s dimensions under
the dripper and understanding its moisture
changes in place and time, whereas the use of
drip irrigation with plastic mulch reduced
both of evaporation from soil surface and
water distribution area. Which has extreme
effect on irrigation water distribution pattern,
root distribution, efficiency of the fertilizers,
water use and ultimately on the eggplant
1928
Int.J.Curr.Microbiol.App.Sci (2019) 8(5): 1926-1933
production quantity and quality, these results
are also in agreement with Yaghi et al.,
(2013).
The results showed that the highest soil
moisture values were recorded with black
plastic mulch and white plastic mulch
compared to bare soil. Generally, all mulches
holding moisture content at long time because
of plastic mulching sheet control the
evaporation and deep percolation losses. So,
mulches finding favorable soil environmental
conditions and had a positive effect on growth
of eggplant and contributed to increasing
vegetative growth and yield. These results are
also in agreement with Yaghi et al., (2013)
and Job et al., (2016).
Prediction of water distribution
The observed horizontal and vertical water
movement in sandy loam soil was plotted
against operating time and statistical models
were fitted to it. The fitted equations for
different models and its respective R2 values
are listed in Table 1 for horizontal water
movement and Table 2 for vertical water
movement. The power and polynomial model
having with highest regression co-efficient
was found to be the best model for predicting
horizontal and vertical water movement.
Comparison of observed and predicted
water movement
A comparison was done between observed
and predicted values of wetted width and
depth under surface drip irrigation with a line
source of water application. The observed
radius of wetting and predicted radius of
wetting from the power model is depicted in
Figure 5. Similarly the observed depth of
wetting and predicted depth of wetting from
polynomial model is shown in Figure 6. The
operating time increases, the wetted radius
also increases. Compared to vertical depth of
wetting, horizontal radius of wetting pattern
was high. It was observed that both set of
curves matches closely which indicates good
accuracy in prediction. The result was similar
to that obtained in the study contained by
Mallikarjun Reddy (2018) and Kandelous and
Šimůnek (2010) in sandy loam soil.
Table.1 Different model for horizontal water movement
Model
Exponential
Linear
Logarithmic
Polynomial
Power
Equation
y = 11.899e0.0073x
y = 0.1341x + 11.325
y = 7.2136ln(x) - 8.3956
y = -0.001x2 + 0.2799x + 7.5146
y = 3.7101x0.4161
R2
R² = 0.8102
R² = 0.9039
R² = 0.9823
R² = 0.9788
R² = 0.9832
Where Y = Horizontal advance (cm), X = Elapsed time (min), R = regression co-efficient
Table.2 Different model for vertical water movement
Model
Exponential
Linear
Logarithmic
Polynomial
Power
Equation
y = 7.4889e0.0114x
y = 0.1632x + 6.8764
y = 8.8733ln(x) - 17.498
y = -0.0015x2 + 0.385x + 1.0792
y = 1.1521x0.6615
Where Y =Vertical advance (cm), X = Elapsed time (min), R = regression co-efficient
1929
R2
R² = 0.748
R² = 0.868
R² = 0.9632
R² = 0.9804
R² = 0.9531
Int.J.Curr.Microbiol.App.Sci (2019) 8(5): 1926-1933
Fig.1 Layout of eggplant experiment and irrigation system at AEC&RI Kumulur, Trichy, TN
Fig.2 Soil water retention curve
1930
Int.J.Curr.Microbiol.App.Sci (2019) 8(5): 1926-1933
Fig.3 Wetted zone at 60 min after irrigation a) Horizontal wetted zone, b) Vertical wetted zone
Fig.4 Soil water movement profile for just after, 24h and 48h after irrigation
Just after irrigation
24h after irrigation
48h after irrigation
1931
Int.J.Curr.Microbiol.App.Sci (2019) 8(5): 1926-1933
Fig.5 Comparison of radius of wetting
Fig.6 Comparison of depth of wetting
In conclusion, the horizontal and vertical
water movement for different time intervals
was measured and presented graphically. Soil
moisture depletion in mulched field was
lesser than non-mulched plots. The results of
the study indicated that DI + BM and DI +
WM treatments distinctly decreased water
applied in the order of DI + WM < DI + BM
< DI. However, combined use of drip
irrigation and plastic mulch was more
appropriate. Therefore, drip irrigation in
combination with plastic mulch especially
black mulch to be more effective irrigation
method while may help to improve water use
efficiency and yield of eggplant. The
horizontal radius of wetting was found to be
higher compared to vertical depth. Power and
Polynomial models were fitted to the
horizontal and vertical water movement and
best fitting model was identified.
References
Acar, B., Topak, R., and Mikailsoy, F. (2009).
Effect of applied water and discharge
rate on wetted soil volume in loam or
clay-loam soil from an irrigated trickle
source. African Journal of Agricultural
Research, 4(1), 049-054.
1932
Int.J.Curr.Microbiol.App.Sci (2019) 8(5): 1926-1933
Al-Ogaidi, A. A., Wayayok, A., Rowshon, M.
K., and Abdullah, A. F. (2016). Wetting
patterns estimation under drip irrigation
systems using an enhanced empirical
model.
Agricultural
Water
Management, 176, 203-213.
Job, M., Bhakar, S. R., Singh, P. K., Tiwari,
G. S., Sharma, R. K., Lakhawat, S. S.,
and Sharma, D. (2016). Water
Requirement and Soil Moisture
Distribution Studies of Drip Irrigated
Onion Crop Under Plastic Mulched and
Non Mulched Condition. International
Journal of Science, Environment and
Technology, 5(1), 176-184.
Kandelous, M. M., and Šimůnek, J. (2010).
Comparison of numerical, analytical,
and empirical models to estimate
wetting patterns for surface and
subsurface drip irrigation. Irrigation
Science, 28(5), 435-444.
Laulina, K., Hasan, M., and Singh, D. K.
(2019). Response of different colour
plastic mulches on water dynamics
under drip fertigated greenhouse
capsicum (Capsicum annultin). Indian
Journal of Agricultural Sciences, 89(3),
469-474.
Liu, Z., and Xu, Q. (2018). Wetting patterns
estimation in cultivation substrates
under drip irrigation. Desalination and
water treatment, 112, 319-324.
Mallikarjun Reddy, M.S. Ayyanagowdar and
Nemichandrappa,
M.
2018.
Characterize the Moisture Distribution
Pattern in Drip Irrigation under Sandy
Loam Soil.Int.J.Curr.Microbiol.App.Sci.
7(4): 2915-2923.
Mashayekhi, P., Ghorbani-Dashtaki, S.,
Mosaddeghi, M. R., Shirani, H., and
Nodoushan, A. R. M. (2016). Different
scenarios for inverse estimation of soil
hydraulic parameters from double-ring
infiltrometer data using HYDRUS2D/3D. International agrophysics,
30(2), 203-210.
Schwartzman, M., and Zur, B. (1986). Emitter
spacing and geometry of wetted soil
volume. Journal of Irrigation and
Drainage Engineering, 112(3), 242253.
Singh, D., Rajput, T., Sikarwar, H., Sahoo, R.,
and Ahmad, T. (2006). Simulation of
soil wetting pattern with subsurface drip
irrigation from line source. Agricultural
water management, 83(1-2), 130-134.
Suryavanshi, P., Buttar, G., and Brar, A.
(2015). Micro irrigation for sustainable
agriculture: a brief review. Indian
Journal
of
Economics
and
Development, 11(1), 147-155.
Vaidheki, M. and Arulanandu, U. 2017.
Estimating Extreme Temperature at
Agricultural Engineering College and
Research Institute, Kumulur Station by
Using Generalized Extreme Value
Distribution.Int.J.Curr.Microbiol.App.S
ci. 6(11): 3874-3886.
Yaghi, T., Arslan, A., and Naoum, F. (2013).
Cucumber (Cucumis sativus, L.) water
use efficiency (WUE) under plastic
mulch and drip irrigation. Agricultural
water management, 128, 149-157.
Zhang, R., Cheng, Z., Zhang, J., and Ji, X.
(2012). Sandy loam soil wetting
patterns of drip irrigation: a comparison
of point and line sources. Procedia
Engineering, 28, 506-511.
How to cite this article:
Rahul, R. and Manikandan, M. 2019. Spatial and Temporal Variation of Soil Water Movement
Modeling under Line Source Dripper. Int.J.Curr.Microbiol.App.Sci. 8(05): 1926-1933.
doi: />1933