Standardization of drying techniques to develop ready to cook banana inflorescence
Bạn đang xem bản rút gọn của tài liệu. Xem và tải ngay bản đầy đủ của tài liệu tại đây (819.48 KB, 14 trang )
Int.J.Curr.Microbiol.App.Sci (2019) 8(3): 1523-1536
International Journal of Current Microbiology and Applied Sciences
ISSN: 2319-7706 Volume 8 Number 03 (2019)
Journal homepage:
Original Research Article
/>
Standardization of Drying Techniques to Develop Ready
to Cook Banana Inflorescence
Ankan Das* and R.S. Dhua
Department of Post Harvest Technology of Horticultural Crops, Faculty of Horticulture,
Bidhan Chandra Krishi Viswavidyalaya, Nadia, West Bengal, 741252, India
*Corresponding author
ABSTRACT
Keywords
Banana
inflorescence,
Pretreatments,
Dehydration,
packaging, storage
Article Info
Accepted:
12 January 2019
Available Online:
10 February 2019
Banana inflorescence is consumed as a vegetable in many Asian countries, is also an
excellent source of various minerals such as magnesium, copper and iron. However using
it as a vegetable sometimes becomes very demanding as it is very difficult to remove the
bracts and extract out the flowers for cooking. So it becomes very important to use some
technology to develop ready to cook banana inflorescence which can be preserved for a
long period. Dehydration can successfully used to safeguard a commodity as it reduces the
bulk volume by lowering the moisture content and also diminishes fungal attack. But in
case of dehydration of banana inflorescence the problem of enzymatic browning due to the
activity of polyphenol oxidase (PPO) is very pervasive. Therefore the study was aimed to
develop suitable dehydration process of banana inflorescence which would yield attractive
dehydrated product with long shelf life. Banana inflorescences were subjected to various
pretreatments followed by which dehydration was carried at three different temperatures of
500C, 550C and 600C. Thereafter the dehydrated products were packed in LDPE 50 micron
pouches and stored in ambient condition. Observation for different physical and
biochemical attributes were taken at 0, 30, 60 and 90 days of storage. The study revealed
that banana inflorescence pretreated with initially dipping at 0.2% citric acid followed by
hot water blanching for 4 minutes and final dipping at 0.1 % sodium metabisulphite with
dehydration done at a temperature of 50 0C was the most promising, maintaining significant
observable attributes throughout the study.
Introduction
The flowers of banana also called as the
banana inflorescence (Musa sp.) is a pack
house of nutrient reserves which makes it an
important consumable product for many. In
many countries of the Asian subcontinent like
India, Malaysia, Philippines, Indonesia and
Sri Lanka it is being consumed as a vegetable
(Wickramarachchi and Ranamukhaarachchi,
2005). In the state of West Bengal of India
this banana inflorescence is very popular,
which is commonly called as „Mocha‟ in the
Bengali language. The banana inflorescence
apart from being utilized as a cooking item
can also be converted into various other forms
like dehydrated products, pickles and canned
fruits. For consuming banana inflorescence as
a vegetable it sometime becomes very hectic
to remove the bracts and extract the flowers.
1523
Int.J.Curr.Microbiol.App.Sci (2019) 8(3): 1523-1536
So in order to overcome the difficulties of
cooking the study was under taken to develop
ready
to
cook
dehydrated
banana
inflorescence.
Drying of food items is one of the very
ancient ant common techniques used to
increase the shelf life of the produce. The
process of dehydration also helps in reducing
the bulk volume to a considerable amount
which in turn reduces the cost associated with
transportation. Drying and dehydration of
agricultural products apart from increasing the
storage life by bringing down the chances of
decay also helps in saving the capital required
for transportation and shipping (Dikbasan,
2007). However aside from these merits of
dehydration there are also some demerits. For
dehydrated products there is always a
problem of nutrient loss by leaching and also
the chances of microbial contamination
though is reduced but still some infestation
does takes place during the storage.
Furthermore during dehydration care has to
be taken about the dehydration time, as
extended period may cause problem. Longer
time used for dehydration is unsuitable for the
product as it renders the commodity more
susceptible towards microbial contaminations
(Kostaropoulos and Saravacos, 1995; ElBeltagy et al., 2007; Akbulut and Durmus,
2009). For banana inflorescence there is
another situation which comes up. In this case
during the process of dehydration the problem
of enzymatic browning is very prevalent
which takes place due to the activity of
polyphenol oxidase (PPO) and substrate
concentration. Various processing steps used
prior to dehydration like slicing and cutting
ads to the enzymatic browning of the
inflorescence (Talburt and Smith, 1987;
Huxsoll and Bolin, 1989; Wickramarachchi
and Ranamukhaarachchi, 2005) which in turn
reduces the appearance quality of the final
dried product.
Therefore the present study was undertaken
with an objective to standardize suitable
drying process for banana inflorescence
which not only will increase its post harvest
longevity but would also yield attractive
ready to cook dehydrated product.
Materials and Methods
The present investigation was carried out in
the Department of Post Harvest Technology
of Horticultural Crops under the faculty of
Horticulture,
Bidhan
Chandra
Krishi
Viswavidyalaya, Nadia West Bengal during
the year 2015-2016. The crops were collected
from farmer‟s field present in the villages of
„Satyapole‟ and „Asudhi‟ located at Nadia and
North 24 Parganas districts of West Bengal
respectively. Storage study and the analytical
work were conducted in the laboratory of Post
Harvest Technology of Horticultural Crops,
Bidhan Chandra Krishi Viswavidyalaya,
Mohanpur, Nadia, West Bengal.
The banana inflorescence taken for the study
was of „Kanthali‟ variety. The bracts were
carefully removed and the flower buds were
separated. The gynaecium part and the scale
were discarded from each flower. The banana
flowers
were
subjected
to
various
pretreatments before drying (initial dipping in
water containing chemical treatment +
blanching in hot water + dipping in cold water
containing chemical treatment) under this
experiment.
T1 – Citric acid 0.2% + 4 min blanching +
potassium metabisulphite 0.1%
T2 – Citric acid 0.2% + 4 min blanching +
sodium metabisulphite 0.1%
T3 – Citric acid 0.2% + 4 min blanching +
Water
T4 – Calcium chloride 0.2% + 4 min
blanching + potassium metabisulphite 0.1%
T5 – Calcium chloride 0.2% + 4 min
blanching + sodium metabisulphite 0.1%
1524
Int.J.Curr.Microbiol.App.Sci (2019) 8(3): 1523-1536
T6 – Calcium chloride 0.2% + 4 min
blanching + Water
T7 – Sodium chloride 0.2% + 4 min blanching
+ potassium metabisulphite 0.1%
T8 – Sodium chloride 0.2% + 4 min blanching
+ sodium metabisulphite 0.1%
T9 – Sodium chloride 0.2% + 4 min blanching
+ Water
T10 – Water + 4 min blanching + potassium
metabisulphite 0.1%
T11 – Water + 4 min blanching + sodium
metabisulphite 0.1%
T12 – Water + 4 min blanching + Water
Radical scavenging activity
Drying was carried out on three different
temperatures of 500C, 550C and 600C
followed by packaging in LDPE 50 micron
pouches and storage in ambient temperature.
Storage studies on different physical and
biochemical parameters viz. moisture content,
rehydration ratio, total phenols, flavanoids,
antioxidant percentage and fungal estimation
were carried on 0, 30, 60 and 90 days of
storage.
The estimation of total phenol content present
in the sample was done by the help of FolinCiocalteu reagent. The absorbance was
calculated spectrophotometrically against a
reagent blank at 760 nm (Singleton et al.,
1999).
The calculation of Radical scavenging activity
(RSA) was done by the help of 2, 2-diphenyl1-picrylhydrazyl (DPPH). The variation of the
extract sample with respect to the absorbance
was measured in a spectrophotometer at 517
nm. The estimation was done by determining
the scavenging ability of the antioxidants
against the stable DPPH radical (BrandWilliams et al., 1995).
Total phenols
The final concentration of the total phenol
content present in the samples were exhibited
as mg gallic acid equivalents (GAE) per gram
of fresh weight.
Storage conditions- Ambient storage
Total flavonoids
Design of experiment: Two Factorial
Completely Randomized Design (Sheoran et
al., 1998).
Replication- 2
Moisture content on dry weight basis
This parameter was calculated according to a
formula (Shipley and Vu, 2002).
Estimation of the total flavanoid content of
the samples was done according to aluminum
chloride method (Zhishen et al., 1999) where
absorbance
was
measured
in
a
spectrophotometer at 510 nm against a
prepared reagent blank.
Finally the total flavonoid content was
manifested as mg catechin equivalents (CE)
per gram of fresh mass.
Moisture content (dehydrated produce)
Microbial load
The moisture content of dehydrated produce
was determined by oven drying method.
Dehydrated samples were further dried in a
hot air oven at 121°C until the weight of the
dried sample become stable (A.O.A.C, 2000).
Microbial load or the microorganisms present
in the samples were calculated by using
standard dilution plate count method (Allen,
1953).
1525
Int.J.Curr.Microbiol.App.Sci (2019) 8(3): 1523-1536
Results and Discussion
Treatments under all the temperatures viz.
500C 550C and 600C suffered from periodic
loss of moisture content (Fig. 1, 2 and 3) on
basis of dry weight, with the gradual passage
of dehydration time. At initial phases of
dehydration the loss of moisture content (dry
wt. basis) from all the treatments under the
different temperatures was very expeditious,
which gets stabilized (no further decrease in
the value) later with further passage of
dehydration time.
During the period of storage the moisture
content for all the treatments dehydrated at
different temperatures viz. 500C 550C and
600C increased (Table 1). Treatments
dehydrated at 500C showed maximum uptake
of moisture throughout the period of storage.
Treatments dehydrated at 550C showed lesser
values, with least moisture gain was recorded
for the treatments dehydrated at 600C at the
end of the storage. Among the different
treatments banana inflorescence which were
initially dipped at 0.2% citric acid followed
by hot water blanching for 4 minutes and then
dipped in 0.1 % sodium metabisulphite
showed the lowest amount of moisture
accumulation.`
The values for rehydration ratio decreased
during the period of storage (Table 2). After
90 days of storage maximum rehydration ratio
were obtained for different treatments
dehydrated at 500C followed by treatments
dehydrated at 550C and 600C respectively.
Banana inflorescence where initial dipping
was done at 0.2% citric acid followed by hot
water blanching for 4 minutes and then
dipping at 0.1 % sodium metabisulphite was
found the best treatment maintaining
maximum value of rehydration ratio.The
different biochemical parameters viz. total
phenols, flavanoids and antioxidant levels (%
inhibition of DPPH) were highest at 0 days of
storage and gradually decreased thereafter
(Table 3, 4 and 5). At initial day of storage
treatments dehydrated at temperature of 500C
showed the highest biochemical values of
31.39 mg GAE/g of total phenol, 2.15 mg
CE/g of total flavanoid, and 59.22% of
antioxidant activity. This was followed by
treatments dehydrated at 550C showing 30.66
mg GAE/g of total phenol, 2.04 mg CE/g of
total flavanoid and 51.77% of antioxidant
activity. Treatments dehydrated at 600C
provided 27.59 mg GAE/g total phenols, 1.86
mg CE/g total flavanoids and 44.32%
antioxidant activity. However later during the
period of storage the content of total phenols,
flavanoids and antioxidant levels (%
inhibition of DPPH) was reduced for all the
treatments dehydrated at temperature of
550C/B2 and 600C/B3. Treatments dehydrated
at 500C showed the best reatinment of total
phenols, flavanoids and antioxidant levels (%
inhibition of DPPH) throughout the period of
storage. At 90 days, dehydration temperature
of 500C with banana inflorescence treated
with initial dipping of 0.2% citric acid
followed by hot water blanching for 4 minutes
and final dipping in 0.1 % sodium
metabisulphite showed the maximum values
of total phenols, flavanoids and antioxidant
levels (% inhibition of DPPH). Control,
dehydrated at 600C recorded the lowest value
for all the biochemical parameters.
With the passage of storage time the fungal
infestation (unicellular and filamentous type)
for different treatments dehydrated at
temperatures of 500C, 550C and 600C
increased (Table 6 and 7). Treatments
dehydrated at a temperature of 500C were
most affected by the fungal attack followed
by treatments under 550C and 600C. Banana
inflorescence were citric acid of 0.2% was
used for initial dipping followed by 4 minutes
of hot water blanching and sodium
metabisulphite of 0.1 % for final dipping was
found the most effective as here the fungal
contamination was less.
1526
Int.J.Curr.Microbiol.App.Sci (2019) 8(3): 1523-1536
Table.1 Moisture content (%) of dehydrated banana inflorescence subjected to different temperatures at different days in storage
0 DAS
A(1-12)
B1=5.42
A(1-12)
B2=
4.15
A(1-12)
B3=3.75
30
DAS
T1/A1
500C/B1
550C/B2
600C/B3
60
DAS
T1/A1
500C/B1
550C/B2
600C/B3
3.79
Mean
A
4.79
5.75
5.55
3.88
Mean
A
5.06
500C/B1
550C/B2
600C/B3
T1/A1
6.79
5.58
4.08
Mean
A
5.48
5.66
4.92
T2/A2
5.52
4.86
3.75
4.71
T2/A2
5.75
5.13
3.86
4.91
T2/A2
6.50
5.12
4.02
5.21
T3/A3
5.75
5.45
4.14
5.11
T3/A3
7.02
6.58
T4/A4
5.69
4.97
3.85
4.83
T4/A4
6.17
5.94
4.23
5.94
T3/A3
8.46
7.55
4.25
6.75
3.48
5.20
T4/A4
6.98
6.21
4.13
5.77
T5/A5
5.69
4.97
3.88
4.85
T5/A5
5.79
5.55
3.92
5.08
T5/A5
6.92
5.59
4.09
5.53
T6/A6
5.82
5.45
4.26
5.17
T6/A6
7.02
6.76
5.31
6.36
T6/A6
8.73
7.65
4.83
7.07
T7/A7
5.75
5.32
3.93
5.00
T7/A7
6.44
6.25
3.98
5.55
T7/A7
7.35
6.72
4.09
6.05
T8/A8
5.70
5.16
3.87
T9/A9
5.86
5.52
4.34
4.91
T8/A8
6.42
6.17
3.97
5.52
T8/A8
7.35
6.67
4.14
6.05
5.24
T9/A9
7.17
6.77
4.45
6.13
T9/A9
9.19
7.83
5.36
7.46
T10/A10
5.75
5.37
3.95
5.02
T10/A10
6.75
6.24
3.99
5.66
T10/A10
7.75
7.25
4.26
6.42
T11/A11
5.75
5.32
3.95
5.00
T11/A11
6.62
6.23
3.98
5.61
T11/A11
7.35
6.83
4.09
6.09
T12/A12
5.89
5.52
4.53
5.31
T12/A12
7.18
6.85
4.60
6.21
T12/A12
9.60
7.93
5.55
7.69
Mean
B
5.73
5.23
4.02
Mean
B
6.50
6.17
4.14
Mean
B
7.74
6.74
4.40
Factors
C.D.
SE(d)
SE(m)
Factors
C.D.
SE(d)
SE(m)
90 DAS
Factors
C.D.
SE(d)
SE(m)
Factor(A)
0.020
0.010
0.007
Factor(A)
0.300
0.147
0.104
Factor(A)
0.046
0.023
0.016
Factor(B)
0.010
0.005
0.003
Factor(B)
0.150
0.074
0.052
Factor(B)
0.023
0.011
0.008
Factor(A
X B)
0.034
0.017
0.012
Factor(A
X B)
N/A
0.255
0.180
Factor(A
X B)
0.080
0.039
0.028
A(1-12): Treatments [A1 (T1) – Citric acid 0.2% + 4 min blanching + K2S2O5 0.1%, A2 ( T2) – Citric acid 0.2% + 4 min blanching + Na2S2O5 0.1%, A3 (T3) – Citric acid 0.2% + 4
min blanching + Water, A4 (T4) – CaCl2 0.2% + 4 min blanching + K2S2O5 0.1%, A5 ( T5) – CaCl2 0.2% + 4 min blanching + Na2S2O5 0.1%, A6 (T6) – CaCl2 0.2% + 4 min
blanching + Water, A7 (T7) – NaCl 0.2% + 4 min blanching + K2S2O5 0.1%, A8 (T8) – NaCl 0.2% + 4 min blanching + Na2S2O5 0.1%, A9 (T9) – NaCl 0.2% + 4 min blanching +
Water, A10 (T10) – Water + 4 min blanching + K2S2O5 0.1%, A11 (T11) – Water + 4 min blanching + Na2S2O5 0.1%, A12 (T12) – Water + 4 min blanching + Water]: B(1-3):
Temperatures [B1- 500C, B2- 550C, B3- 600C] , CD at 5%
1527
Int.J.Curr.Microbiol.App.Sci (2019) 8(3): 1523-1536
Table.2 Rehydration ratio of dehydrated banana inflorescence subjected to different temperatures at different days in storage
0 das
A(1-12)
b1=9.12
A(1-12)
B2=
8.97
A(1-12)
b3=8.44
30 das
500c/b1
550c/b2
600c/b3
Mean a
60 das
500c/b1
550c/b2
600c/b3
Mean a
90 das
500c/b1
550c/b2
600c/b3
Mean a
T1/a1
8.88
7.92
6.87
7.89
T1/a1
8.37
7.55
6.15
7.35
T1/a1
7.75
6.83
6.06
6.88
T2/a2
8.86
7.95
6.90
7.90
T2/a2
8.39
7.59
6.19
7.39
T2/a2
7.76
6.95
6.25
6.98
T3/a3
8.84
6.94
5.72
7.16
T3/a3
8.19
6.53
5.47
6.73
T3/a3
7.41
6.32
5.27
6.33
T4/a4
8.87
7.92
6.82
7.87
T4/a4
8.27
7.22
6.12
7.20
T4/a4
7.72
6.80
6.05
6.85
T5/a5
8.87
7.92
6.84
7.87
T5/a5
8.27
7.54
6.12
7.31
T5/a5
7.76
6.81
6.04
6.87
T6/a6
8.83
6.94
5.71
7.16
T6/a6
8.20
6.27
5.92
6.80
T6/a6
7.41
6.13
4.24
5.93
T7/a7
8.85
7.02
6.82
7.56
T7/a7
8.22
6.90
6.07
7.06
T7/a7
7.55
6.80
5.75
6.70
T8/a8
8.87
7.17
6.82
7.62
T8/a8
8.25
7.01
6.12
7.12
T8/a8
7.58
6.80
5.93
6.77
T9/a9
8.83
6.94
5.71
7.16
T9/a9
7.99
6.27
5.15
6.47
T9/a9
7.33
6.12
4.56
6.00
T10/a10
8.84
6.96
5.72
7.17
T10/a10
8.20
6.90
6.00
7.03
T10/a10
7.44
6.45
5.27
6.38
T11/a11
8.84
7.02
5.75
7.20
T11/a11
8.22
6.90
6.02
7.04
T11/a11
7.55
6.53
5.30
6.46
T12/a12
8.81
6.94
5.56
7.10
T12/a12
7.92
6.01
5.12
6.35
T12/a12
7.17
5.97
4.16
5.76
Mean b
8.85
7.30
6.27
Mean b
8.20
6.89
5.87
Mean b
7.53
6.54
5.40
Factors
C.d.
Factor(a)
Factor(b)
0.016
0.008
Se(d)
0.008
0.004
Se(m)
0.006
0.003
Factors
C.d.
Factor(a)
Factor(b)
0.038
0.019
Se(d)
0.019
0.009
Se(m)
0.013
0.007
Factors
C.d.
Factor(a)
Factor(b)
0.031
0.015
Se(d)
0.015
0.008
Se(m)
0.011
0.005
Factor(a
0.029
0.014
0.010
Factor(a
0.066
0.033
0.023
Factor(a
0.053
0.026
0.019
x b)
x b)
x b)
A(1-12): Treatments [A1 (T1) – Citric acid 0.2% + 4 min blanching + K2S2O5 0.1%, A2 ( T2) – Citric acid 0.2% + 4 min blanching + Na2S2O5 0.1%, A3 (T3) – Citric acid 0.2% + 4
min blanching + Water, A4 (T4) – CaCl2 0.2% + 4 min blanching + K2S2O5 0.1%, A5 ( T5) – CaCl2 0.2% + 4 min blanching + Na2S2O5 0.1%, A6 (T6) – CaCl2 0.2% + 4 min
blanching + Water, A7 (T7) – NaCl 0.2% + 4 min blanching + K2S2O5 0.1%, A8 (T8) – NaCl 0.2% + 4 min blanching + Na2S2O5 0.1%, A9 (T9) – NaCl 0.2% + 4 min blanching +
Water, A10 (T10) – Water + 4 min blanching + K2S2O5 0.1%, A11 (T11) – Water + 4 min blanching + Na2S2O5 0.1%, A12 (T12) – Water + 4 min blanching + Water]: B(1-3):
Temperatures [B1- 500C, B2- 550C, B3- 600C] , CD at 5%
1528
Int.J.Curr.Microbiol.App.Sci (2019) 8(3): 1523-1536
Table.3 Total content of phenols (mg GAE/g) of dehydrated banana inflorescence subjected to different temperatures at different days
in storage
0 DAS
A(1-12)
B1=31.39
A(1-12)
B2=
30.66
A(1-12)
B3=27.59
30
DAS
T1/A1
500C/B1
550C/B2
600C/B3
60
DAS
T1/A1
500C/B1
550C/B2
600C/B3
25.12
Mean
A
26.78
90
DAS
T1/A1
500C/B1
550C/B2
600C/B3
22.93
Mean
A
24.14
20.05
19.07
16.58
Mean
A
18.57
28.14
27.09
25.60
23.88
T2/A2
28.39
27.14
25.54
27.02
T2/A2
26.79
25.59
23.39
25.25
T2/A2
20.20
19.17
17.18
18.85
T3/A3
25.89
22.82
19.48
22.73
T3/A3
21.14
21.77
16.68
19.86
T3/A3
14.47
13.16
10.71
12.78
T4/A4
27.93
26.91
25.02
26.62
T4/A4
25.04
23.39
22.03
23.49
T4/A4
17.41
17.13
15.28
16.60
T5/A5
28.05
27.79
25.09
26.97
T5/A5
25.13
25.08
22.65
24.29
T5/A5
17.66
17.14
15.45
16.75
T6/A6
25.51
22.39
18.90
22.26
T6/A6
21.94
21.03
16.18
19.72
T6/A6
14.38
11.88
10.49
12.25
T7/A7
26.28
26.11
21.17
24.52
T7/A7
24.49
22.93
20.82
22.74
T7/A7
15.17
14.23
14.34
14.58
T8/A8
26.62
26.54
22.23
25.13
T8/A8
24.71
23.17
20.95
22.94
T8/A8
15.37
14.53
15.10
15.00
T9/A9
25.30
22.12
18.40
21.94
T9/A9
20.18
19.16
16.02
18.45
T9/A9
14.20
11.13
10.04
11.79
T10/A10
26.05
23.91
20.56
23.50
T10/A10
23.50
22.19
20.07
21.92
T10/A10
14.55
13.65
11.59
13.26
T11/A11
26.16
24.64
20.95
23.91
T11/A11
23.80
22.48
20.58
22.29
T11/A11
15.05
13.95
11.89
13.63
T12/A12
23.36
21.83
17.60
20.93
T12/A12
19.12
18.05
15.47
17.54
T12/A12
13.04
10.98
8.68
10.90
Mean
B
26.47
24.94
21.67
Mean
B
23.45
22.39
19.81
Mean
B
15.96
14.67
13.11
Factors
C.D.
SE(d)
SE(m)
Factors
C.D.
SE(d)
SE(m)
Factors
C.D.
SE(d)
SE(m)
Factor(A)
0.097
0.048
0.034
Factor(A)
0.560
0.275
0.195
Factor(A)
0.073
0.036
0.025
Factor(B)
0.049
0.024
0.017
Factor(B)
0.280
0.138
0.097
Factor(B)
0.037
0.018
0.013
Factor(A
0.168
0.083
0.058
Factor(A
0.971
0.477
0.337
Factor(A
0.127
0.062
0.044
X B)
X B)
X B)
A(1-12): Treatments [A1 (T1) – Citric acid 0.2% + 4 min blanching + K2S2O5 0.1%, A2 ( T2) – Citric acid 0.2% + 4 min blanching + Na2S2O5 0.1%, A3 (T3) – Citric acid 0.2% + 4
min blanching + Water, A4 (T4) – CaCl2 0.2% + 4 min blanching + K2S2O5 0.1%, A5 ( T5) – CaCl2 0.2% + 4 min blanching + Na2S2O5 0.1%, A6 (T6) – CaCl2 0.2% + 4 min
blanching + Water, A7 (T7) – NaCl 0.2% + 4 min blanching + K2S2O5 0.1%, A8 (T8) – NaCl 0.2% + 4 min blanching + Na2S2O5 0.1%, A9 (T9) – NaCl 0.2% + 4 min blanching +
Water, A10 (T10) – Water + 4 min blanching + K2S2O5 0.1%, A11 (T11) – Water + 4 min blanching + Na2S2O5 0.1%, A12 (T12) – Water + 4 min blanching + Water]: B(1-3):
Temperatures [B1- 500C, B2- 550C, B3- 600C] , CD at 5%
1529
Int.J.Curr.Microbiol.App.Sci (2019) 8(3): 1523-1536
Table.4 Flavanoid content (mg CE/g) of dehydrated banana inflorescence subjected to different temperatures at different days in
storage
0 DAS
A(1-12)
B1=2.15
A(1-12)
B2=
2.04
A(1-12)
B3=1.86
30
DAS
T1/A1
500C/B1
550C/B2
600C/B3
60
DAS
T1/A1
500C/B1
550C/B2
600C/B3
1.48
Mean
A
1.68
90
DAS
T1/A1
500C/B1
550C/B2
600C/B3
0.87
Mean
A
1.22
1.29
1.09
0.78
Mean
A
1.05
1.85
1.71
1.42
1.36
T2/A2
1.88
1.74
1.54
1.72
T2/A2
1.45
1.42
0.97
1.28
T2/A2
1.29
1.16
0.97
1.14
T3/A3
1.69
1.49
1.19
1.45
T3/A3
1.18
1.12
0.65
0.98
T3/A3
1.13
0.73
0.38
0.74
T4/A4
1.80
1.64
1.44
1.63
T4/A4
1.40
1.30
0.83
1.18
T4/A4
1.24
0.93
0.50
0.89
T5/A5
1.82
1.69
1.48
1.66
T5/A5
1.40
1.32
0.83
1.18
T5/A5
1.27
1.05
0.52
0.94
T6/A6
1.69
1.45
1.15
1.43
T6/A6
1.18
1.04
0.65
0.95
T6/A6
0.96
0.73
0.34
0.67
T7/A7
1.74
1.55
1.33
1.54
T7/A7
1.32
1.23
0.73
1.09
T7/A7
1.22
0.83
0.45
0.83
T8/A8
1.76
1.61
1.39
1.59
T8/A8
1.34
1.26
0.76
1.12
T8/A8
1.24
0.88
0.49
0.87
T9/A9
1.64
1.34
1.07
1.35
T9/A9
1.13
0.92
0.62
0.89
T9/A9
0.93
0.70
0.34
0.66
T10/A10
1.73
1.52
1.21
1.48
T10/A10
1.22
1.17
0.69
1.02
T10/A10
1.20
0.76
0.41
0.79
T11/A11
1.73
1.53
1.27
1.51
T11/A11
1.27
1.23
0.71
1.07
T11/A11
1.20
0.79
0.45
0.81
T12/A12
1.52
1.27
0.87
1.22
T12/A12
0.96
0.87
0.62
0.82
T12/A12
0.88
0.69
0.28
0.61
Mean
B
1.73
1.54
1.28
Mean
B
1.27
1.18
0.74
Mean
B
1.15
0.86
0.49
Factors
C.D.
SE(d)
SE(m)
Factors
C.D.
SE(d)
SE(m)
Factors
C.D.
SE(d)
SE(m)
Factor(A)
0.014
0.007
0.005
Factor(A)
0.013
0.007
0.005
Factor(A)
0.011
0.005
0.004
Factor(B)
0.007
0.003
0.002
Factor(B)
0.007
0.003
0.002
Factor(B)
0.005
0.003
0.002
Factor(A
0.024
0.012
0.008
Factor(A
0.023
0.011
0.008
Factor(A
0.019
0.009
0.007
X B)
X B)
X B)
A(1-12): Treatments [A1 (T1) – Citric acid 0.2% + 4 min blanching + K2S2O5 0.1%, A2 ( T2) – Citric acid 0.2% + 4 min blanching + Na2S2O5 0.1%, A3 (T3) – Citric acid 0.2% + 4
min blanching + Water, A4 (T4) – CaCl2 0.2% + 4 min blanching + K2S2O5 0.1%, A5 ( T5) – CaCl2 0.2% + 4 min blanching + Na2S2O5 0.1%, A6 (T6) – CaCl2 0.2% + 4 min
blanching + Water, A7 (T7) – NaCl 0.2% + 4 min blanching + K2S2O5 0.1%, A8 (T8) – NaCl 0.2% + 4 min blanching + Na2S2O5 0.1%, A9 (T9) – NaCl 0.2% + 4 min blanching +
Water, A10 (T10) – Water + 4 min blanching + K2S2O5 0.1%, A11 (T11) – Water + 4 min blanching + Na2S2O5 0.1%, A12 (T12) – Water + 4 min blanching + Water]: B(1-3):
Temperatures [B1- 500C, B2- 550C, B3- 600C] , CD at 5%
1530
Int.J.Curr.Microbiol.App.Sci (2019) 8(3): 1523-1536
Table.5 Antioxidant activity (percent inhibition of DPPH) of dehydrated banana inflorescence subjected to different temperatures at
different days in storage
0 DAS
A(1-12)
B1=59.22
A(1-12)
B2=
51.77
A(1-12)
B3=44.32
30
DAS
T1/A1
500C/B1
550C/B2
600C/B3
60
DAS
T1/A1
500C/B1
550C/B2
600C/B3
31.90
Mean
A
43.33
90
DAS
T1/A1
500C/B1
550C/B2
600C/B3
26.12
Mean
A
31.26
30.16
28.85
18.06
Mean
A
25.69
51.18
46.92
34.63
33.03
T2/A2
51.18
47.78
32.71
43.89
T2/A2
37.45
33.26
26.70
32.47
T2/A2
31.52
29.77
18.70
26.66
T3/A3
41.90
37.47
24.16
34.51
T3/A3
27.17
22.90
15.02
21.70
T3/A3
21.72
16.69
9.71
16.04
T4/A4
47.29
45.18
27.52
39.99
T4/A4
32.84
28.81
25.31
28.98
T4/A4
26.72
24.52
13.63
21.62
T5/A5
50.71
45.78
27.97
41.48
T5/A5
33.88
31.49
19.93
28.43
T5/A5
30.06
28.65
13.91
24.21
T6/A6
41.49
35.36
23.34
33.40
T6/A6
26.49
22.06
14.25
20.93
T6/A6
21.72
16.69
8.61
15.67
T7/A7
45.07
40.92
27.13
37.70
T7/A7
29.08
27.57
17.68
24.78
T7/A7
23.91
22.33
13.02
19.75
T8/A8
45.21
42.61
27.13
38.31
T8/A8
29.50
28.21
19.29
25.66
T8/A8
26.16
24.52
13.63
21.44
T9/A9
41.49
33.27
21.82
32.19
T9/A9
26.04
19.73
14.25
20.01
T9/A9
20.65
16.05
7.62
14.77
T10/A10
43.24
38.68
22.96
34.96
T10/A10
27.81
24.11
15.02
22.31
T10/A10
23.34
17.57
9.80
16.90
T11/A11
44.80
40.49
25.68
36.99
T11/A11
27.92
24.64
15.53
22.69
T11/A11
23.78
18.81
12.88
18.49
T12/A12
37.46
30.52
21.08
29.68
T12/A12
22.51
19.15
13.08
18.25
T12/A12
18.92
15.56
7.05
13.84
Mean
B
45.08
40.41
26.11
Mean
B
29.61
26.25
18.51
Mean
B
24.89
21.67
12.22
Factors
C.D.
SE(d)
SE(m)
Factors
C.D.
SE(d)
SE(m)
Factors
C.D.
SE(d)
SE(m)
Factor(A)
0.467
0.230
0.162
Factor(A)
0.174
0.086
0.061
Factor(A)
0.176
0.087
0.061
Factor(B)
0.234
0.115
0.081
Factor(B)
0.087
0.043
0.030
Factor(B)
0.088
0.043
0.031
Factor(A
0.810
0.398
0.281
Factor(A
0.302
0.148
0.105
Factor(A
0.306
0.150
0.106
X B)
X B)
X B)
A(1-12): Treatments [A1 (T1) – Citric acid 0.2% + 4 min blanching + K2S2O5 0.1%, A2 ( T2) – Citric acid 0.2% + 4 min blanching + Na2S2O5 0.1%, A3 (T3) – Citric acid 0.2% + 4
min blanching + Water, A4 (T4) – CaCl2 0.2% + 4 min blanching + K2S2O5 0.1%, A5 ( T5) – CaCl2 0.2% + 4 min blanching + Na2S2O5 0.1%, A6 (T6) – CaCl2 0.2% + 4 min
blanching + Water, A7 (T7) – NaCl 0.2% + 4 min blanching + K2S2O5 0.1%, A8 (T8) – NaCl 0.2% + 4 min blanching + Na2S2O5 0.1%, A9 (T9) – NaCl 0.2% + 4 min blanching +
Water, A10 (T10) – Water + 4 min blanching + K2S2O5 0.1%, A11 (T11) – Water + 4 min blanching + Na2S2O5 0.1%, A12 (T12) – Water + 4 min blanching + Water]: B(1-3):
Temperatures [B1- 500C, B2- 550C, B3- 600C] , CD at 5%
1531
Int.J.Curr.Microbiol.App.Sci (2019) 8(3): 1523-1536
Table.6 Populations of unicellular fungi (x 102 cfu/g) on dehydrated banana inflorescence subjected to different temperatures at
different days in storage
0 DAS
A(1-12)
B1=1.00
A(1-12)
B2=
1.00
A(1-12)
B3=0.5
550C/B2
600C/B3
550C/B2
600C/B3
550C/B2
600C/B3
2.00
2.00
2.00
Mean
A
2.00
1.00
1.00
1.50
1.50
T2/A2
1.00
T2/A2
1.50
T2/A2
2.00
2.00
1.50
1.83
T3/A3
1.67
T3/A3
2.33
T3/A3
4.00
3.00
2.50
3.17
0.50
1.00
1.50
1.67
T4/A4
2.50
2.50
2.00
2.33
1.00
0.50
1.50
1.00
1.33
T5/A5
2.00
2.00
2.00
2.00
2.00
1.50
2.50
2.50
2.00
2.33
T6/A6
4.50
3.50
3.00
3.67
T7/A7
1.50
T7/A7
2.50
2.00
1.50
2.00
T7/A7
3.00
2.50
2.50
2.67
T8/A8
1.17
T8/A8
2.00
1.50
1.50
1.67
T8/A8
2.50
2.50
2.50
2.50
1.50
1.67
T9/A9
2.50
2.50
2.00
2.33
T9/A9
4.00
3.50
3.00
3.50
1.50
1.50
1.50
T10/A10
2.50
2.00
2.00
2.17
T10/A10
3.50
3.00
2.50
3.00
1.50
1.50
1.00
1.33
T11/A11
2.50
2.00
1.50
2.00
T11/A11
3.50
3.00
2.00
2.83
T12/A12
2.00
2.00
1.50
1.83
T12/A12
3.00
2.50
2.50
2.67
T12/A12
5.00
4.00
3.50
4.17
Mean
B
1.58
1.33
1.04
Mean
B
2.21
1.96
1.63
Mean
B
3.21
2.79
2.42
30
DAS
T1/A1
500C/B1
0.50
Mean
A
0.83
60
DAS
T1/A1
1.00
0.50
0.83
2.00
1.50
1.50
T4/A4
1.50
1.00
T5/A5
1.50
T6/A6
500C/B1
1.00
Mean
A
1.33
90
DAS
T1/A1
1.50
1.00
1.33
2.50
2.50
2.00
T4/A4
2.00
1.50
1.00
T5/A5
1.50
1.50
1.67
T6/A6
1.50
1.00
1.33
1.50
1.00
1.00
T9/A9
2.00
1.50
T10/A10
1.50
T11/A11
Factors
C.D.
SE(d)
SE(m)
Factors
C.D.
SE(d)
500C/B1
SE(m)
Factors
C.D.
SE(d)
SE(m)
Factor(A)
0.635
0.312
0.220
Factor(A)
0.664
0.326
0.231
Factor(A)
0.554
0.272
0.192
Factor(B)
0.317
0.156
0.110
Factor(B)
0.332
0.163
0.115
Factor(B)
0.277
0.136
0.096
Factor(A
N/A
0.540
0.382
Factor(A
N/A
0.565
0.400
Factor(A
N/A
0.471
0.333
X B)
X B)
X B)
A(1-12): Treatments [A1 (T1) – Citric acid 0.2% + 4 min blanching + K2S2O5 0.1%, A2 ( T2) – Citric acid 0.2% + 4 min blanching + Na2S2O5 0.1%, A3 (T3) – Citric acid 0.2% + 4
min blanching + Water, A4 (T4) – CaCl2 0.2% + 4 min blanching + K2S2O5 0.1%, A5 ( T5) – CaCl2 0.2% + 4 min blanching + Na2S2O5 0.1%, A6 (T6) – CaCl2 0.2% + 4 min
blanching + Water, A7 (T7) – NaCl 0.2% + 4 min blanching + K2S2O5 0.1%, A8 (T8) – NaCl 0.2% + 4 min blanching + Na2S2O5 0.1%, A9 (T9) – NaCl 0.2% + 4 min blanching +
Water, A10 (T10) – Water + 4 min blanching + K2S2O5 0.1%, A11 (T11) – Water + 4 min blanching + Na2S2O5 0.1%, A12 (T12) – Water + 4 min blanching + Water]: B(1-3):
Temperatures [B1- 500C, B2- 550C, B3- 600C] , CD at 5%
1532
Int.J.Curr.Microbiol.App.Sci (2019) 8(3): 1523-1536
Table.7 Populations of filamentous fungi (x 102 cfu/g) on dehydrated banana inflorescence subjected to different temperatures at
different days in storage
0 DAS
A(1-12)
B1=0.50
A(1-12)
B2=
0.50
A(1-12)
B3=0.50
550C/B2
600C/B3
550C/B2
600C/B3
550C/B2
600C/B3
1.50
1.00
1.00
Mean
A
1.17
0.50
0.50
1.50
1.00
T2/A2
0.50
T2/A2
1.00
T2/A2
1.00
0.50
1.00
0.83
T3/A3
1.00
T3/A3
1.33
T3/A3
2.50
2.00
1.50
2.00
0.50
0.50
1.00
1.33
T4/A4
1.50
1.50
1.00
1.33
0.50
0.50
1.00
1.00
1.17
T5/A5
1.50
1.00
1.00
1.17
1.00
1.00
1.50
1.50
1.00
1.33
T6/A6
2.50
2.50
1.50
2.17
T7/A7
1.00
T7/A7
1.50
1.50
1.00
1.33
T7/A7
1.50
1.50
1.00
1.33
T8/A8
0.67
T8/A8
1.50
1.50
1.00
1.33
T8/A8
1.50
1.50
1.00
1.33
1.00
1.00
T9/A9
1.50
1.50
1.50
1.50
T9/A9
2.50
2.50
1.50
2.17
1.00
0.50
0.83
T10/A10
2.00
1.50
1.00
1.50
T10/A10
2.00
1.50
1.50
1.67
1.00
0.50
0.50
0.67
T11/A11
1.50
1.50
1.00
1.33
T11/A11
2.00
1.50
1.50
1.67
T12/A12
1.50
1.50
1.00
1.33
T12/A12
1.50
1.50
1.50
1.50
T12/A12
2.50
2.50
2.00
2.33
Mean
B
0.88
0.75
0.67
Mean
B
1.50
1.33
1.08
Mean
B
1.88
1.63
1.29
30
DAS
T1/A1
500C/B1
0.50
Mean
A
0.50
60
DAS
T1/A1
0.50
0.50
0.50
1.00
1.00
1.00
T4/A4
0.50
0.50
T5/A5
0.50
T6/A6
500C/B1
1.00
Mean
A
1.17
90
DAS
T1/A1
0.50
1.00
0.83
1.50
1.50
1.00
T4/A4
1.50
1.50
0.50
T5/A5
1.50
1.00
1.00
T6/A6
0.50
0.50
0.67
1.00
0.50
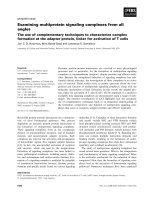
0.50
T9/A9
1.00
1.00
T10/A10
1.00
T11/A11
Factors
C.D.
SE(d)
SE(m)
Factors
C.D.
SE(d)
500C/B1
SE(m)
Factors
C.D.
SE(d)
SE(m)
Factor(A)
N/A
0.312
0.220
Factor(A)
N/A
0.319
0.226
Factor(A)
0.664
0.326
0.231
Factor(B)
N/A
0.156
0.110
Factor(B)
0.325
0.160
0.113
Factor(B)
0.332
0.163
0.115
Factor(A
N/A
0.540
0.382
Factor(A
N/A
0.553
0.391
Factor(A
N/A
0.565
0.400
X B)
X B)
X B)
A(1-12): Treatments [A1 (T1) – Citric acid 0.2% + 4 min blanching + K2S2O5 0.1%, A2 ( T2) – Citric acid 0.2% + 4 min blanching + Na2S2O5 0.1%, A3 (T3) – Citric acid 0.2% + 4
min blanching + Water, A4 (T4) – CaCl2 0.2% + 4 min blanching + K2S2O5 0.1%, A5 ( T5) – CaCl2 0.2% + 4 min blanching + Na2S2O5 0.1%, A6 (T6) – CaCl2 0.2% + 4 min
blanching + Water, A7 (T7) – NaCl 0.2% + 4 min blanching + K2S2O5 0.1%, A8 (T8) – NaCl 0.2% + 4 min blanching + Na2S2O5 0.1%, A9 (T9) – NaCl 0.2% + 4 min blanching +
Water, A10 (T10) – Water + 4 min blanching + K2S2O5 0.1%, A11 (T11) – Water + 4 min blanching + Na2S2O5 0.1%, A12 (T12) – Water + 4 min blanching + Water]: B(1-3):
Temperatures [B1- 500C, B2- 550C, B3- 600C] , CD at 5%
1533
Int.J.Curr.Microbiol.App.Sci (2019) 8(3): 1523-1536
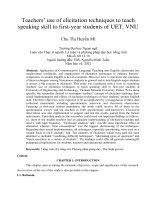
Fig.1,2,3 Moisture content on the basis of dry weight during dehydration of banana inflorescence
Moisture content on the basis of dry weight
during dehydration
of banana inflorescence at different temperatures
at different
temperatures
Fig. 1
Tim e (m inutes)
Fig. 2
Tim e (m inutes)
Fig. 3
Time (minutes)
The experiment showed that different
physical and biochemical parameters were
highest at the initial day of storage for
treatments dehydrated at 500C followed by
treatments dehydrated at 550C and treatments
dehydrated at 600C. However later during the
period of storage the retainment of different
attributes decreased for all the treatments
dehydrated at different temperatures.
of banana were provided with hot water
blanching which helped in maintaining the
condition of the produce. Blanching was
mainly adopted as it helps in loosening and
softening of internal tissues which helps in
enhancing the rate of drying and facilitates
uniform shrinking during dehydration
(Kunzek et al., 1999; Munyaka et al., 2010;
Waldron et al., 2003).
Prior to dehydration, the banana inflorescence
were subjected to various pretreatments in the
laboratory conditions. Also the inflorescences
The chemicals used in the study for treating
the banana inflorescence were also found to
be very useful.
1534
Int.J.Curr.Microbiol.App.Sci (2019) 8(3): 1523-1536
Different chemicals which were used for
providing
pretreatments
to
banana
inflorescence here were citric acid, calcium
chloride,
sodium
chloride,
sodium
metabisulphite which were also used in the
works of Veli et al., 2007; Kostaropoulos and
Saravacos, 1995; Kingsly et al., 2007;
Doymaz, 2004a,b; El- Beltagy et al., 2007;
Pan et al., 2008; Marquez-Rios et al., 2009)..
These chemicals helped in increasing the post
harvest longevity of the dehydrated banana
inflorescence. According to Kingsly et al.,
(2007) pretreatment prior to dehydration helps
in inactivation of various enzymes which are
responsible for loss of colour they also destress the tissues which minimizes the
dehydration time and ultimately provides
dehydrated product of superior quality. From
the study it was also found that the microbial
activity in the post harvest life of the produce
got lowered. These pretreatment helped in
bringing down the microbial infestations and
dehydration furthermore reduces the chances
of fungal decay Agbo (2014).
In conclusion, among the three different
temperatures used for dehydration, 500C was
found best in retaining the physical and
biochemical properties of the dehydrated
product as compared to the other two
temperatures used for dehydration in the
study. Though the fungal attack was
comparatively little more for treatments
dehydrated at 500C then the treatments
dehydrated at 550C and 600C, but with respect
to overall maintenance of physical and
biochemical attributes, treatments dehydrated
at 500C were found good for storage. Under
the dehydration temperature of 500C, banana
inflorescence initially dipped at 0.2% citric
acid followed by hot water blanching for 4
minutes and then dipped in 0.1 % sodium
metabisulphite was most successful in
maintaining a significant contents of phenols,
flavanoids and antioxidant levels with lesser
fungal infestation. Control where banana
inflorescence were only dipped in water
recorded the lowest value for all the physical
and biochemical attributes and showed
maximum fungal growth all throughout the
storage period.
Acknowledgement
The first author of the study duly
acknowledges the INSPIRE Fellowship
Programme under the Department of Science
and Technology, Ministry of Science and
Technology, New Delhi for continuous
financial support during the study.
References
A.O.A.C. 2000. Official Methods of Analysis.
17th Ed. Association of Official Analytical
Chemists, Horwitz, USA.
Agbo, A.E. 2014.
Microbiological and
nutrional quality of dried okra sold in
abidjan markets. Int. J. Sci. Tech. 23 (2):
1585-1600.
Akbulut, A. and Durmus, A. 2009. Thin layer
solar drying and mathematical modeling of
mulberry. Int. J. Energy Res. 33: 687–695.
Allen, O.N. 1953. Experiments in Soil
Bacteriology. Burgess Co., Minneapolis,
Minn. pp. 69-70.
Brand-Williams, W., Cuvelier, M.E. and Berset,
C. 1995. Use of a free radical method to
evaluate antioxidant activity. LWT Food
Sci Tech. 28: 25-30.
Dikbasan, T. 2007. Determination of the
effective parameters for drying of apples,
Master of Science in Energy Engineering
(Izmir Institute of Technology, Izmir).
Doymaz, I. 2004a. Effect of pre-treatments
using potassium metabisulphide and
alkaline ethyl oleate on the drying kinetics
of apricots. Biosyst. Eng., 89: 281–287
Doymaz, I. 2004b. Drying kinetics of white
mulberry. J. Food Eng. 61: 341–346.
El-Beltagy, A., Gamea, G.R. and Amer Essa,
A.H. 2007. Solar drying characteristics of
strawberry. J. Food Eng. 78: 456–464.
Huxsoll, C.C. and Bolin, H.R. 1989. Processing
1535
Int.J.Curr.Microbiol.App.Sci (2019) 8(3): 1523-1536
and distribution alternatives for minimally
processed fruits and vegetables. Food
Technol. 2: 124-128.
Kingsly, A.R.P., Singh, R., Goyal, R.K. and
Singh, D.B. 2007. Thin-layer drying
behaviour of organically produced tomato.
Am. J. Food Technol. 2: 71–78.
Kostaropoulos, A.E. and Saravacos, G.D. 1995.
Microwave pre-treatment for sun-dried
raisins. J. Food Sci. 60: 344–347.
Kunzek, H., Kabbert, R. and Gloyna, D. 1999.
Aspects of material science in food
processing: changes in plant cell walls of
fruits and vegetables. Eur. Food Res.
Technol. 208(4): 233-250.
Marquez-Rios, E., Ocan˜ o-Higuera, V.M.,
Maeda-Martinez, A.N., Lugo-Sanchez,
M.E., Carvallo-Ruiz, M.G. and PachecoAguilar, R. 2009. Citric acid as
pretreatment in drying of Pacific Lion‟s
Paw Scallop (Nodipecten subnodosus)
meats. Food Chem. 112: 599–603.
Munyaka, A.W., Oey, I., Van Loey, A. and
Hendrickx, M. 2010. Application of
thermal inactivation of enzymes during
vitamin C analysis to study the influence of
acidification, crushing and blanching on
vitamin C stability in Broccoli (Brassica
oleracea L var. italica). Food Chem.,
120(2): 591-598.
Pan, Z., Shih, C., McHugh, T.H. and
Hirschberg, E. 2008. Study of banana
dehydration using sequential infrared
radiation heating and freeze-drying. Food
Sci. Technol. 41: 1944–1951.
Sheoran, O.P., Tonk, D.S., Kaushik, L.S.,
Hasija, R.C. and Pannu, R.S. (1998).
Statistical
Software
Package
for
Agricultural Research Worker. Recent
Advances in information theory, Statistics
and Computer Applications by D.S. Hooda
and R.C. Hasija, Department of
Mathematics Statistics, CCS HAU, Hisar
(139-143).
Shipley, B. and Vu, T. T. 2002. Dry matter
content as a measure of dry matter
concentration in plants and their parts. New
Phytol. 153, 359-364.
Singleton, V.L., Orthofer, R. and LamuelaRaventos, R.M. 1999. Analysis of total
phenols and other oxidation substrates and
antioxidants by means of Folin-Ciocalteau
reagent. Methods Enzymol. 299: 152-178.
Talburt, W.F and Smith, O. 1987. Potato
Processing, 4th ed. Van Nostrand,
Reinhold/ AVI, New York.
Veli, D., Bili, M., Tomas, S., Planini, M.,
Buci´c-Koji, A. and Aladi, K. 2007. Study
of the drying kinetics of “Granny Smith”
apple in tray drier. Agric. Conspec. Sci. 72:
323–328.
Waldron, K.W., Parker, M.L. and Smith, A.C.
2003. Plant cell wall and food quality: A
review. J. Sci. Food Technol. 2:109-10.
Wickramarachchi,
K.S.,
and
Ranamukhaarachchi,
S.L.
(2005).
Preservation of Fiber-Rich Banana
Blossom as a Dehydrated Vegetable.
Sci,Asia. 31: 265-271.
Zhishen, J., Mengcheng, T. and Jianming, W.
1999. The determination of flavonoid
contents in mulberry and their scavenging
effects on superoxide radicals. Food Chem.
64: 555-59.
How to cite this article:
Ankan Das and Dhua, R.S. 2019. Standardization of Drying Techniques to Develop Ready to
Cook Banana Inflorescence. Int.J.Curr.Microbiol.App.Sci. 8(03): 1523-1536.
doi: />
1536