Toward a new computer-based and easy-to-use tool for the objective measurement of motivational states in humans: A pilot study
Bạn đang xem bản rút gọn của tài liệu. Xem và tải ngay bản đầy đủ của tài liệu tại đây (869.71 KB, 9 trang )
Aouizerate et al. BMC Psychology 2014, 2:23
/>
TECHNICAL ADVANCE
Open Access
Toward a new computer-based and easy-to-use
tool for the objective measurement of motivational
states in humans: a pilot study
Bruno Aouizerate1,2,3,6*, Camille Gouzien1,2,3,6, Olivier Doumy1,2,3,6, Pierre Philip3,4, Catherine Semal3,5, Laurent Demany3,5,
Pier Vincenzo Piazza2,3 and Daniela Cota2,3,6
Abstract
Background: The experimental methods currently used for assessing motivational processes in humans have two
major limitations. Some of them rely on global subjective assessments while others evaluate these processes using
food-related tasks often coupled with functional neuroimaging techniques that have however limited availability
and important associated costs. Here we propose a novel experimental computer-generated and easy-to-use tool
primarily based on the presentation of food images and designed to provide a quantitative and objective measurement
of motivational states in humans.
Methods: Two tasks evaluating respectively visual and time discrimination capacities were developed and tested on
a sample of 30 healthy subjects. The subjects were asked to compare a food stimulus (food picture in color) and its
devalued counterpart (same image in grayscale), at each trial, assessing either the size (task A) or the duration of
presentation (task B). Geometric figures presented in color or grayscale were used as controls. The subjects were
invited to perform tasks A and B during three separate experimental sessions, one under fasting and two under satiety.
Results: Relative to their devalued counterparts, the food images were judged significantly greater in size and shorter
in time of presentation in fasting than in satiety. In fasting, the size and the time of presentation for the food images
were respectively estimated significantly greater and shorter than for the control images when compared to their
respective devalued counterparts. Conversely, there was no overall change in the perception of size or duration of
presentation for the control images between fasting and satiety conditions.
Conclusions: Our findings support that hunger specifically affects the perception of visual food stimuli, and suggest
that this novel computer-based test is potentially useful for the study of motivational states in human diseases that
are characterized by serious disturbances in reward processing.
Keywords: Motivation, Computer-based tasks, Food images, Psychophysics
Background
Given the increasing prevalence of highly disabling pathologies, such as major depression, addiction and obesity,
in which reward function is especially disrupted (Eaton
et al. 2007; Merikangas and McClair 2012; Wang et al.
2011), there is a significant need for an easy-to-use
* Correspondence:
1
Regional medical center for the management and treatment of anxiety and
depressive disorders, Centre Hospitalier Charles Perrens, F-33076 Bordeaux,
France
2
INSERM, Neurocentre Magendie, Physiopathologie de la Plasticité Neuronale,
U862, F-33000 Bordeaux, France
Full list of author information is available at the end of the article
instrumental method designed to provide an accurate
measurement of motivational states in humans.
Motivation (i.e. wanting), as one of the two components
of reward beside the hedonic experience and sensory
pleasure (i.e. liking), relies on the brain process involved
in the attribution of incentive salience and that generates
the desire to consume appetitive food (Berridge 1996;
Berridge 2003; Finlayson et al. 2007; Finlayson and Dalton
2012; Cota et al. 2006; Piazza et al. 2007). The motivation
to obtain and eat food is modulated by the sensations of
hunger, as reflective of the physiological need to introduce
calories (Berridge 1996; Berridge 2003; Finlayson et al.
© 2014 Aouizerate et al.; licensee BioMed Central Ltd. This is an Open Access article distributed under the terms of the
Creative Commons Attribution License ( which permits unrestricted use,
distribution, and reproduction in any medium, provided the original work is properly credited. The Creative Commons Public
Domain Dedication waiver ( applies to the data made available in this
article, unless otherwise stated.
Aouizerate et al. BMC Psychology 2014, 2:23
/>
2007; Finlayson and Dalton 2012; Cota et al. 2006; Piazza
et al. 2007).
Several methodological approaches have been used to
study motivational processes. Some clinical investigations
have tried to explore time experience (e.g. how time passes
slowly or quickly) or judgement (e.g. how the duration of
a given timespan is estimated or produced), as indicative
of the degree of motivation, which is expected to be low
when time is perceived long (Mezey and Cohen 1961;
Wyrick and Wyrick 1977; Bschor et al. 2004). However,
these studies have some limitations due to the frequent
use of subjective assessment methods. Some authors have
instead examined the processing of the motivational value
of food visual cues (Stoeckel et al. 2008; Stoeckel et al.
2009). Such experimental paradigms coupled with functional neuroimaging allow objectively identifying the anatomofunctional correlates of the internal affective state.
However, an important drawback is the limited availability
and costly procedures associated with functional neuroimaging. There are other computer-based tests that
primarily refer to: i) food reinforcement tasks for the study
of motivated responses and effort toward food (Epstein
et al. 2003; Giesen et al. 2010); ii) food tasting tasks for the
evaluation of the hedonic experience and pleasantness
elicited by food intake (Born et al. 2011; Cooke et al.
2011); and, iii) visual probe tasks with food images for the
exploration of cognitive aspects and especially the attentional capture according to the motivational characteristics of food pictures (Di Pellegrino et al. 2011; Nijs et al.
2010). Thus, to date little attention has been paid to
methods assessing motivational states in relation with
the perception. While the manipulation of the emotional
valence of words has recently been documented to create
substantial changes in the size or time perception (Ode
et al. 2012), the perceptual processing of motivationally
significant stimuli such as food, which could putatively be
linked to hunger levels, has not been investigated.
Therefore, our pilot study had as objective the development and use of a new experimental computer-generated
and easy-to-use test based on the presentation of visual
food cues for the objective and quantitative measurement
of motivational states in humans. We explored the influence of both incentive salience and physiological hunger
on the visual and time perception. To this purpose, we
recruited normal-weight, healthy subjects to perform two
behavioral tasks, named task A and task B. These tasks
respectively challenged visual and time discrimination
capacities between two stimuli, a food image in color (“F”)
and its devalued counterpart in grayscale (“D”) under
either fasting or satiety conditions. Geometric figures in
color (“C”) and graycale (“D”) were used as controls. We
hypothesized that fasting specifically causes changes in the
perception of either the size or the presentation duration
of the food images. Measurements of perceptual changes
Page 2 of 9
were based on the assessment of either the point of
subjective equality (PSE) (i.e. the ratio “F”/“D” or “C”/“D”
for which the stimulus “F” or “C” was judged equal to “D”
in terms of size or presentation time) or the percentage of
subjective discrimination (PSD) (i.e. the percentage of
responses where the stimulus “F” or “C” was judged
greater than “D” during the trials where the stimulus “F”
or “C” was physically equal to “D”, in terms of size or
duration of presentation). Our study demonstrates that
the subjects perceived food, but not control, images bigger
in size and shorter in duration of presentation in fasting as compared to satiety. These data thus suggest that
this novel computer-based test easily allows assessing
quantitatively and objectively motivational states in
humans, representing a potentially useful tool for the
study of behavioral responses in subjects suffering from
pathologies in which motivational states are altered.
Results
Hunger levels of the study population and appetitive
properties of food images
Visual analogue scales (VAS) were used to assess both
hunger levels and attractiveness of the food images
shown to the subjects recruited for the study. As expected,
assessment of hunger levels revealed profound differences
across fasting and satiety conditions [condition effect,
F(2,58) = 143.07, p < 0.0001]. Hunger scores were significantly higher during the fasting session than during the
satiety sessions (p < 0.0001). Ratings of appetitive properties of food pictures on VAS showed a mean score of
6.39 (±sem = 0.45). Additionally, there was no significant
difference in the appetitive value of the stimuli “F” when
assessed at the end of the experimental session in either
fasting or satiety [condition effect, F(1,28) = 0.04, p > 0.85].
Therefore, the appetitive properties of the stimuli “F” were
not estimated greater in fasting than in satiety.
Visual and time perceptions changes in response to
hunger levels
Given the absence of significant difference in either the
PSE or PSD for both images “F” and “C” between the two
experimental sessions under satiety, the PSE and PSD
calculated for either the stimuli “F” or “C” in the two satiety sessions were combined.
For task A, assessments of the PSE revealed negative
values on the logarithmic scale for both types of stimuli
“F” and “C” in either fasting or satiety (Figure 1A). This
means that the subjects considered the images “F” or
“C” equal in size to their respective devalued counterparts “D” while the images “F” or “C” were in reality
smaller in size than “D”. Therefore, the subjects overestimated the size of both stimuli “F” and “C” relative to
their respective devalued counterparts “D” under either
fasting or satiety. However, there was a tendency toward
Aouizerate et al. BMC Psychology 2014, 2:23
/>
Page 3 of 9
Task A
Food (F)
Control (C)
0,10
1.072
0,10
0,05
1.035
0,00
1.000
-0,05
0.966
-0,10
satiety
1.179
*
1.116
0,05
1.056
0,00
1.000
-0,05
0.947
0.933
-0,10
0.896
0.901
-0,15
PSE
p=0.07
-0,15
PSE (Log base 3)
0,15
fasting
EXPERIMENTAL SESSION
PSE
1.110
0,15
PSE (Log base 2)
Task B
Food (F)
Control (C)
0.848
satiety
fasting
EXPERIMENTAL SESSION
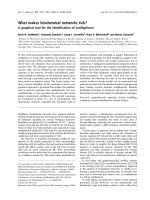
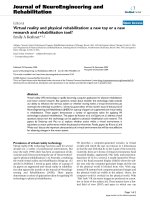
Figure 1 PSE of food/control images for tasks A and B. (A) For task A, there was a tendency toward a greater PSE in satiety than in fasting,
regardless of the type of the presented food image “F” or control image “C” (p = 0.07). (B) For task B, under fasting there was a significantly
greater PSE for “F” than for “C” (*p < 0.02). Error bars represent mean ± sem.
a difference in the PSE between fasting and satiety
conditions, regardless of the type of the viewed stimuli
“F” or “C” [condition effect, F(1,23) = 3.65, p = 0.07]. The
PSE of both images “F” and “C” tended to have more
negative values on the logarithmic scale under fasting as
compared to satiety (Figure 1A). Therefore, the overestimation seemed more marked under fasting than in
satiety for both types of stimuli “F” and “C” when compared to their respective devalued counterparts “D”. In
fasting, the PSE calculated for either the stimuli “F” or “C”
was also found to be inversely correlated with the hunger
levels measured by VAS [stimuli “F”: r = −0.43, p < 0.04;
stimuli “C”: r = −0,45, p < 0.03]. In contrast, there was no
significant relationship between the PSE of the stimuli “F”
in fasting and their appetitive value as assessed by VAS at
the end of the last experimental session [r = −0.09, p >
0.68]. Analysis of the PSD revealed differences between
the stimuli “F” and “C” across the two experimental conditions under fasting and satiety [stimulus x condition interaction, F(1,23) = 4.50, p < 0.04]. The PSD was significantly
greater under fasting than in satiety for the images
“F” (p < 0.02), whereas there was no difference for the
images “C” (p > 0.78). Moreover, in fasting the PSD was
significantly greater for the images “F” than for the images
“C” (p < 0.03) (Figure 2A). Therefore, relative to their
respective devalued counterparts, the stimuli “F” under
fasting were perceived greater in size than either the same
type of stimuli in satiety or the stimuli “C” in fasting.
However, the PSD calculated for the stimuli “F” was not
significantly correlated with either the hunger levels in
fasting [r = 0.10, p > 0.68] or the appetitive value of the
images measured by VAS [r = 0.14, p > 0.53].
For task B, measurements of the PSE for the stimuli
“F” and “C” varied differently across fasting and satiety
conditions [stimulus x condition interaction, F(1,26) =
4.34, p < 0.05]. The PSE for the images “F” had a positive
value on the logarithmic scale in fasting (Figure 1B). In
other words, the subjects considered the stimuli “F”
equal in time of presentation to their devalued counterparts “D” while the stimuli “F” were in reality greater in
time of presentation than “D”. Therefore, in fasting, the
subjects underestimated the duration of presentation of
the stimuli “F” when compared to their devalued counterparts “D”. Opposite results were observed for the
stimuli “C”. The PSE for the images “C” showed a negative value on the logarithmic scale in fasting (Figure 1B).
This means that the subjects perceived the stimuli “C”
equal in time of presentation to their devalued counterparts “D” while the stimuli “C” were in reality smaller in
time of presentation than “D”. In other words, in the
fasting condition, the subjects overestimated the duration
of presentation of the stimuli “C” when compared to their
devalued counterparts “D”. The PSE for the images “F”
was significantly greater than that of the images “C” in
fasting (p < 0.02) (Figure 1B). Therefore, relative to their
respective devalued counterparts “D”, the duration of
presentation of the stimuli “F” was estimated significantly
smaller than that of the stimuli “C” under fasting. Concordant data were obtained for the PSD [stimulus x condition interaction, F(1,26) = 7.59, p < 0.01] (Figure 2B). The
PSD for the images “F” was significantly smaller than that
of the images “C” in fasting (p < 0.01). Additionally, there
was a significantly smaller PSD under fasting than in
satiety for the “F” images (p < 0.01), whereas no difference
Aouizerate et al. BMC Psychology 2014, 2:23
/>
Page 4 of 9
Task B
Task A
100
100
Food (F)
Control (C)
*
*
60
**
60
40
40
20
20
0
satiety
fasting
EXPERIMENTAL SESSION
**
80
PSD (%)
PSD (%)
80
Food (F)
Control (C)
0
satiety
fasting
EXPERIMENTAL SESSION
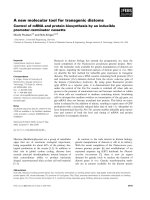
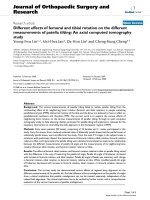
Figure 2 PSD of food/control stimuli for tasks A and B. (A) For task A, there was a significantly greater PSD in response to the food images
(“F”) in fasting than in satiety (*p < 0.02), while no significant difference was found for the control images (“C”) between fasting and satiety
conditions. Additionally, the PSD in fasting was significantly greater for the food images (“F”) than for control images (“C”) (*p < 0.03). (B) For task
B, there was a significantly smaller PSD in response to the food images (“F”) in fasting than in satiety (**p < 0.01), while no significant difference
was found for the control images (“C”) between fasting and satiety conditions. The PSD in fasting was significantly smaller for the food images
(“F”) than for control images (“C”) (**p < 0.01). Error bars represent mean ± sem.
was observed for the “C” images (p > 0.72) (Figure 2B).
Thus, relative to their respective devalued counterparts,
the stimuli “F” under fasting were estimated shorter in
duration of presentation than either “C” under fasting or
“F” under satiety. However, the PSE or the PSD of the
stimuli “F” did not correlate either with hunger levels in
fasting [PSE: r = −0.21, p > 0.29; PSD: r = −0.08, p > 0.69] or
with the appetitive properties of the images measured by
VAS [PSE: r = −0.04, p > 0.85; PSD: r = 0.01, p > 0.97].
Discussion
To our knowledge, this is the first study using psychophysical methods for the development of a test based on
perception for the objective and quantitative assessment
of motivational states in humans.
In the studied subjects, hunger levels recorded in fasting were substantially higher than those in satiety. This
was paralleled by changes in the estimated size of the
selected food images, which was judged greater in fasting than in satiety, when compared to their devalued
counterparts. Interestingly, these changes in the perception of size were inversely related with hunger levels in
fasting. Thus, more the subjects were hungry, more the
size of food images was overestimated in fasting. Concomitantly, relative to their devalued counterparts, the
food images was considered shorter in duration of presentation in fasting than in satiety. Conversely, perception
of geometric figures used as controls remained overall
stable in fasting as compared to satiety. Therefore, hunger is able to specifically produce modifications in the
perception of food pictures, an effect presumably related
to changes in their incentive effects. This is suggested by
studies showing that visual and time perceptions are
both modulated by the affective state in response to the
presentation of food or word-related stimuli (Ode et al.
2012; Gil et al. 2009).
Our data illustrate the interaction between the physiological hunger and motivation. Prolonged fasting is associated with an increased activity within the hypothalamus
(Tataranni et al. 1999) but also evokes midbrain activation
in response to the anticipated experience of a forthcoming
meal (DelParigi et al. 2005). Such activation is assumed to
mediate the motivational aspects related to the expectation of food (Berridge 1996; Berridge 2003; Finlayson
et al. 2007; Finlayson and Dalton 2012; Salamone and
Correa 2002; Salamone and Correa 2012). The motivation
is characterized by the assignment of attractive and desirable properties to an external stimulus such as a food
image and it is mediated by the release of dopamine
within the mesolimbic pathways (Berridge 1996; Berridge
2003; Finlayson et al. 2007; Finlayson and Dalton 2012;
Salamone and Correa 2002; Salamone and Correa 2012).
Interestingly, the mesencephalic dopamine system has also
been described to occupy a pivotal position in the perception of time, according to the classical pacemakeraccumulator model that allows the estimation, integration
and discrimination of time intervals (Buhusi and Meck
2005; Meck et al. 2008).
Our global evaluation of the appetitive value of the
food images used in our study accounted for their incentive value. However, numerous functional neuroimaging
studies have shown that the presentation of visual food
stimuli is associated with the activation of frontal-limbic
loops (Stoeckel et al. 2008; Stoeckel et al. 2009) that are
highly involved in processing the hedonic significance of
environmental stimuli (Krawczyk 2002; Phillips et al.
2003). Visual food stimuli do not only induce incentive,
but also affective responses, which reflect the pleasantness
Aouizerate et al. BMC Psychology 2014, 2:23
/>
of the sensation produced by the presentation of food images (Cabanac 1971; Brondel and Cabanac 2007). Also,
our data confirm previous findings showing that the time
of presentation of food images is underestimated, as compared to that of neutral pictures. Importantly, this effect
is related to the pleasure provoked by the food images
(Gil et al. 2009). Thus, although emotional responses
were not specifically assessed in our study, it cannot be
ruled out that hunger will affect not only the incentive,
but also the hedonic characteristics of the food pictures.
The present study has some limitations. First, differently from what initially expected, the geometric figures
used in our study, were overestimated in size as the food
images, especially under fasting, when compared to their
respective devalued counterparts. This finding is consistent
with earlier studies showing that the color of a stimulus
affects its size perception (Tedford et al. 1977; Ling and
Hurlbert 2004). Relationships between the color and the
emotional reaction elicited by the presentation of a stimulus have also been established (Valdez and Mehrabian
1994). Therefore, it can be assumed that the geometric
figures in color relative to their devalued counterparts in
grayscale could possibly acquire emotional salience, as seen
for the food images, and consequently induce changes in
size perception under fasting, as suggested by the effects of
affective states on size estimation (Ode et al. 2012). Second,
measurements of the PSD showed that hunger specifically
induces an overestimation of the size of the viewed food
images under fasting while assessments of PSE revealed
similar changes in the size perception although occurring
indifferently for both types of stimuli in fasting. This partial
discrepancy between the PSD and PSE could be possibly
due to the chosen psychophysical parameters, especially
the size of the step, which might be too large for identifying
with the PSE small perceptual differences between food
and control stimuli in a sample of healthy subjects free
from any pathology of the reward system. Thus, it might
be necessary to further reduce the size of the step in order
to better differentiate changes in the size perception of the
food pictures from those of control images by using the
PSE. An alternative explanation is the smaller number of
subjects performing the task A than those participating in
the task B for which the PSE and the PSD concordantly
showed that under fasting the time of presentation was
perceived shorter for food but not for control images.
Third, the PSD is a particularly appropriate measurement
derived from the responses to a large number of trials
(from 200 to 350) where both stimuli “F” and “D” are equal
in terms of size and duration of presentation, as those
responses obtained in our study for each experimental
session at the level of the entire group sample. However,
this experimental variable might partially loose its accuracy when calculated individually for each participant
on a smaller number of trials (from 9 to 14) during each
Page 5 of 9
experimental session, thereby resulting in the absence of
correlation with the hunger levels or the appetitive value
of the food images. Fourth, as reported above, the appetitive value of the viewed food images was rated on VAS at
the end of the last experimental session in order to avoid
giving the participants particular information about the
exact objectives of the study, and therefore limiting biased
responses to food images. However, this approach raises
the question about the accuracy of a retrospective measurement of the overall appetitive properties attributed to
the food pictures of the study. This might explain why i)
there was no influence of fasting on the appetitive value of
food images; and, ii) there was no relation with the experimental variables PSE and PSD that we used. Fifth, previous findings have shown the allocation of attentional
resources in response to the salience and relevance of
food-related stimuli (Di Pellegrino et al. 2011; Forestell
et al. 2012; Yokum et al. 2011). In particular, it has been
demonstrated that the attentional processing for food
stimuli is influenced by fasting (Nijs et al. 2010; Siep et al.
2009; Piech et al. 2010). Our study assessed the accuracy
of perception, as reflected by the PSE. However, we did
not assess the precision of perception, which reflects, at
least in part, the participant’s attentional engagement.
Finally, our sample was characterized by an overrepresentation of women. This could impact our findings, as
attested by differential effects of the hunger drive on
hedonic responses to food pictures according to gender
(Stoeckel et al. 2007). Interestingly, such gender effect
seems to depend upon the categories of food (Stoeckel
et al. 2007). Thus, the use of a large variety of food stimuli
as done in our study might have minimized the effects of
gender. However, it might be important to examine the
putative presence of gender effects in future studies
requiring larger samples of subjects.
Conclusion
The present pilot study pleads for the potential usefulness of a novel computer-based test that we have developed for the study of motivational processing of food
images, allowing assessing changes in visual and time
perception in humans. We showed that the accuracy of
the perception depends on the appetitive properties of
the food stimuli and that this is in close relation with
the hunger drive. This computer-based test could therefore contribute to the characterization of disturbances in
reward processes and responses to standard therapeutic
strategies in subjects affected by mood, addictive disorders or obesity.
Methods
Subjects
Thirty healthy subjects (11 men, 19 women), whose
ages ranged from 25 to 58 years (mean age = 32.17
Aouizerate et al. BMC Psychology 2014, 2:23
/>
years ± sem = 1.78), were recruited through printed
announcements and word of mouth. All the subjects
were free of: i) past and current DSM-IV axis I psychiatric
disorders, including drug addiction or abuse; ii) serious
medical and neurological disorders; and, iii) chronic
exposure to psychotropic agents and other medications
affecting the physiology of the central nervous system.
The Body Mass Index (BMI) calculated for each participant before entering the study was systematically comprised between 18.5 and 24.9 kg/m2 (mean BMI = 21.80
kg/m2 ± sem = 0.32). Also, the subjects had normal or
corrected-to-normal vision. They were asked to abstain
from alcohol drinking for at least 2 days before and
throughout the study. Caffeine or tobacco use was not
permitted over the last 3 hours prior to the testing in
order to substantially reduce the risk for attention
and memory biases. The INSERM Institutional Review
Board specifically approved the present study. All the
participants gave written informed consent after a
complete description of the protocol. However, the
subjects were unaware of the exact nature of the study.
They were financially compensated for their participation
in the study.
Computer-based tasks
Two computer-generated tasks were used. They are both
registered under the French agency for the protection of
computer software. The tasks were based on the discrimination of the size (Task A, Figure 3A) or of the time of
presentation (Task B, Figure 3B) of food (“F”, food picture) or control (“C”, geometric image) stimuli and their
devalued counterpart (“D”) in grayscale. Devalued images
were used since earlier studies demonstrated that the
visual characteristics, particularly in terms of colors, have
an impact on the affective reaction to salient cues, thereby
influencing the size and time perception (Smets 1969;
Tedford et al. 1977; Ling and Hurlbert 2004; Valdez
and Mehrabian 1994; Gil et al. 2009). Images were chosen
within a library containing 70 photographs of various
food categories (snacks, meats, fish, pizzas, sandwiches,
cheeses, fruits, and cakes) and the same number of
geometric shapes. At each trial, the stimuli were presented
in a random order on a computer screen so that food or
geometric images in color preceded or followed their
devalued counterparts. The consecutive presentation of
food and geometric images throughout the task were also
random. Each trial started with the presentation of a single
image “F”, “C” or “D” for 1 s. After a 750-ms interval, the
subject had access to the subsequent image “D”, “F” or “C”
for 1 s. For the task A, the subject had to compare the
images by pressing within a 3-s delay the left button of the
keyboard when the first image was estimated greater, in
terms of size, than the second one or the right button
when the second image was judged greater that the
Page 6 of 9
first one. For the task B, the subject had to compare
the images by pressing within a 3-s delay the left button of the keyboard when the time of presentation of
the first image was estimated longer than that of the
second one, or the right button when the time of
presentation of the second image was judged longer
than that of the first one. The presentation time of
the images ranged from 500 to 1500 ms throughout
the task.
The adopted experimental paradigm used to develop
the computer-based program was derived from the classical psychophysical up-down adaptive staircase method
(Jesteadt 1980). Two staircases, respectively called α and
β, were interleaved throughout the task in an alternative
manner (Figure 4). The ratio “F”/“D” or “C”/“D” at each
trial depended on the subject’s response on the previous
trial. If the subject perceived that the size or the presentation time of the stimulus “F” or “C” was respectively
greater or longer than that of the devalued counterpart
“D”, the ratio “F”/“D” or “C”/“D” was reduced by one step
at the subsequent trial. Conversely, it was increased by
one step when the size or the presentation time of the
stimulus “F” or “C” was considered smaller or shorter than
that of the devalued counterpart “D”. The procedure is
terminated after a specified number of reversals (n = 12)
within each staircase α and β (Figure 4).
Experimental sessions
Two experimental sessions in satiety were carried out 3–4
days apart in order to ensure that the behavioral responses
to the tasks remained stable over time. One additional session in fasting for 6 hours before the test was performed
3–4 days apart from those in satiety. The experimental
sessions in satiety preceded or followed the one in fasting
in a randomized order. When tested in satiety, the subjects consumed a calorically-defined meal (600 kcal) 15
minutes after the arrival at the laboratory. Following a
one-hour period of resting, they were asked to perform
tasks A and B with a 20-min time interval between tasks.
The order of the tasks A and B was randomized across
the experimental sessions. Before starting the first task, a
visual analogue scale (VAS) was systematically completed
in order to assess hunger levels. Each subject had to
answer the following question: “How hungry are you?”
and rate hunger levels by placing a mark on a horizontal
line, 100 mm in length, anchored by the word descriptors
“Not at all” on the left end (0) and “Extremely” on the
right end (100). An additional VAS evaluating the appetitive properties of the viewed food pictures was administered although only at the end of the last experimental
session, so that the exact objective of the study
remained unknown to the participants, thereby limiting potential response bias. The following question was
asked: “How much did you consider the presented food
Aouizerate et al. BMC Psychology 2014, 2:23
/>
Page 7 of 9
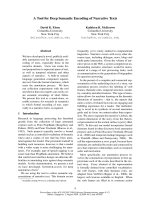
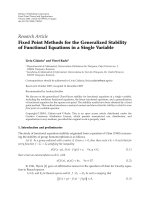
Figure 3 Illustration of tasks A and B, which assess respectively visual and time discrimination capacities. (A) For task A, at each trial, the
subject was asked to compare the size of the food stimulus (food picture in color) to that of its devalued counterpart (same image in grayscale),
and to answer the following question: “Which image is the biggest?” by pressing the left or the right button (arrow key of the standard computer
keyboard) when respectively the first or the second image was considered as the biggest one. Geometric figures (in a range of colors close to
that of food images) and their respective devalued counterparts (in grayscale) were used as controls. For further details see Methods. (B) For task
B, at each trial, the subject was asked to compare the duration of presentation of the food stimulus (food picture in color) to that of its devalued
counterpart (same image in grayscale), and to answer the following question: “Which image has the longest viewing time?” by pressing the left
or the right button (arrow key of the standard computer keyboard) when respectively the first or the second image was estimated as having the
longest time of presentation. Geometric figures (in a range of colors close to that of food images) and their respective devalued counterparts
(in grayscale) were used as controls. For further details see Methods.
images appetitive?”. The subject was invited to place a
mark on the horizontal line anchored by word descriptors
similar to those cited above for the VAS assessing hunger
levels. For both VAS, the score was determined by measuring the distance in millimeters from the left end of the
line to the mark that the subject drew (Wewers and Lowe
1990; Gould et al. 2001).
Data analysis
Two experimental variables were considered as a measurement of perceptual changes that are putatively reflective of changes in motivational states. First, the point of
subjective equality (PSE) calculated for each category of
stimuli “F” and “C” is the ratio “F”/“D” or “C”/“D” for
which the stimulus “F” or “C” was judged equal to “D” in
Aouizerate et al. BMC Psychology 2014, 2:23
/>
1
Page 8 of 9
3
2.615
1
0,875
3
0,75
5
2.280
9
0,625
7
1.987
11
1.732
13
0,375
1.510
15
0,25
1.316
17
0,125
19
0
PSE
16
20
31 32
28
21 22
18
-0,125
-0,25
23
25 26
29 30
39 40
33 34
27
24
37 38
35 36
1.147
43
41 42
45 46
44
49
1
PSD
0.872
47 48
0.760
14
-0,375
0.662
12
-0,5
0.577
10
-0,625
0.503
8
-0,75
0.439
6
-0,875
0.382
4
-1
0.333
2
0
Ratio F/D
Ratio F/D (Log base 3)
0,5
5
10
15
20
25
30
Trial number
staircase
35
40
45
50
55
staircase
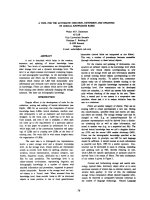
Figure 4 Illustration of the up-down adaptive staircase procedure. In this fictitious block of trials, the subject had to compare, on each trial,
two stimuli, “F” and “D”. The ratio F/D varied from trial to trial and was represented in two interleaved adaptive staircases called α and β. For task
A (size comparisons), F/D was initially equal to 2 for staircase α and 1/2 for staircase β. In both staircases, F/D was subsequently multiplied by
21/12 (i.e., approximately 1.059) when subjects perceived F as smaller than D, and divided by the same factor when subjects perceived F as larger
than D. The block of trials was terminated when at least 12 reversals in the variation of F/D had occurred for each staircase. Similarly, for task B
(duration comparisons), as shown in the figure, the initial values of F/D were always 3 and 1/3, and F/D was always multiplied or divided by a
factor of 31/8 (i.e., approximately 1.147) when F was estimated respectively shorter or longer than D.
terms of size or presentation time and it is estimated by
averaging reversal points within both staircases (Jesteadt
1980). Second, the percentage of subjective discrimination
(PSD) determined for each type of stimuli “F” and “C”
corresponds to the percentage of responses where the
stimulus “F” or “C” was judged greater than “D” during
the trials where the stimulus “F” or “C” was physically
equal to “D”, in terms of size or duration of presentation
(Figure 4). This latter variable is expected to show changes
in either size or time perception similar to those found
with the PSE. For instance, if the PSE for the stimuli “F”
has a positive value, it means that the stimuli “F” are considered equal to their devalued counterparts “D” whereas
the stimuli “F” are in reality greater than “D” in either
size or presentation time. Therefore, the stimuli “F”
were underestimated as compared to “D”. Consequently,
the corresponding PSD will have a value below 50%.
Of the study population, data of the first 6 subjects
enrolled for task A that served for gradual psychophysical parameter adjustments (step size, initial ratio
“F”/“D” or “C”/“D”) were excluded from the final analyses.
For task B, data of 3 subjects were excluded because
pictures were abnormally displayed on the computer
screen when these 3 subjects passed the test.
One- and two-way ANOVAs were respectively performed for the comparison of: i) the hunger levels and
appetitive values of food images between fasting and satiety conditions; and, ii) the PSE and PSD between fasting
and satiety conditions according to the category of stimuli
“F” and “C”. Newman-Keuls test was used for post-hoc
analysis. Pearson’s test was used for correlation analyses
between: 1) the hunger levels and the PSE or PSD
calculated for either the stimuli “F” or “C” in the
fasting condition; and, 2) the appetitive value of the
stimuli “F” and the PSE or PSD calculated for the stimuli
“F” in the fasting condition. Results were considered as
significant at p < 0.05.
Abbreviations
PSE: Point of subjective equality; PSD: Percentage of subjective
discrimination; VAS: Visual analogue scale.
Competing interests
The authors declare that they have no competing interests.
Authors’ contributions
BA, CG, LD, PVP and DC wrote the manuscript. BA, CS, LD, PVP and DC
contributed to the development of the computer-based tasks. BA, CG, LD,
PVP and DC analyzed the data. CG, OD and PP participated in the recruitment
and assessment of the study subjects. All the authors reviewed and approved
the publication.
Authors’ information
Pier Vincenzo Piazza and Daniela Cota share senior authorship.
Acknowledgements
This study was supported by INSERM (D.C., P.V.P.), Fondation pour la
Recherche Médicale Master fellowship (C.G.), Servier/Eutherapie laboratories,
French “Fonds Français pour l′Alimentation et la Santé (B.A.) and Labex
BRAIN ANR-10-LABX-43 (D.C.). All the funders had no further role in the study
design, data collection and analysis, decision to publish, or preparation of
the manuscript. We thank Mrs. Bert-Latrille from the GENPPHASS for helping
with the pre-screening of the potential research participants. We thank the
subjects who have participated in the study.
Author details
1
Regional medical center for the management and treatment of anxiety and
depressive disorders, Centre Hospitalier Charles Perrens, F-33076 Bordeaux,
France. 2INSERM, Neurocentre Magendie, Physiopathologie de la Plasticité
Neuronale, U862, F-33000 Bordeaux, France. 3Université de Bordeaux, F-33000
Aouizerate et al. BMC Psychology 2014, 2:23
/>
Bordeaux, France. 4Study group “Neurophysiology, pharmacology, sleep and
sleepiness”, CHU de Bordeaux, F-33076 Bordeaux, France. 5Group “Auditory
perception and development”, CNRS UMR 5287, Institut de Neurosciences
Cognitives et Intégratives d’Aquitaine, F-33076 Bordeaux, France. 6Group
“Energy Balance and Obesity”, INSERM U862, Neurocentre Magendie, 146 Rue
Léo Saignat, F-33077 Bordeaux, France.
Received: 10 February 2014 Accepted: 18 July 2014
Published: 11 August 2014
References
Berridge, KC. (1996). Food reward: brain substrates of wanting and liking.
Neuroscience and Biobehavioral Reviews, 20(1), 1–25.
Berridge, KC. (2003). Pleasures of the brain. Brain and Cognition, 52(1), 106–128.
Born, JM, Lemmens, SG, Martens, MJ, Formisano, E, Goebel, R, & WesterterpPlantenga, MS. (2011). Differences between liking and wanting signals in the
human brain and relations with cognitive dietary restraint and body mass
index. American Journal of Clinical Nutrition, 94(2), 392–403.
Brondel, L, & Cabanac, M. (2007). Alliesthesia in visual and auditory sensations
from environmental signals. Physiology and Behavior, 91(2–3), 196–201.
Bschor, T, Ising, M, Bauer, M, Lewitzka, U, Skerstupeit, M, Muller-Oerlinghausen, B,
& Baethge, C. (2004). Time experience and time judgment in major
depression, mania and healthy subjects. A controlled study of 93 subjects.
Acta Psychiatrica Scandinavica, 109(3), 222–229.
Buhusi, CV, & Meck, WH. (2005). What makes us tick? Functional and neural
mechanisms of interval timing. Nature Review Neuroscience, 6(10), 755–765.
Cabanac, M. (1971). Physiological role of pleasure. Science, 173(4002), 1103–1107.
Cooke, LJ, Chambers, LC, Anez, EV, Croker, HA, Boniface, D, Yeomans, MR, &
Wardle, J. (2011). Eating for pleasure or profit: the effect of incentives on
children’s enjoyment of vegetables. Psychological Science, 22(2), 190–196.
Cota, D, Tschop, MH, Horvath, TL, & Levine, AS. (2006). Cannabinoids, opioids and
eating behavior: the molecular face of hedonism? Brain Research Reviews,
51(1), 85–107.
DelParigi, A, Chen, K, Salbe, AD, Reiman, EM, & Tataranni, PA. (2005). Sensory
experience of food and obesity: a positron emission tomography study of
the brain regions affected by tasting a liquid meal after a prolonged fast.
NeuroImage, 24(2), 436–443.
Di Pellegrino, G, Magarelli, S, & Mengarelli, F. (2011). Food pleasantness affects
visual selective attention. Quarterly Journal of Experimental Psychology,
64(3), 560–571.
Eaton, WW, Kalaydjian, A, Scharfstein, DO, Mezuk, B, & Ding, Y. (2007).
Prevalence and incidence of depressive disorder: the Baltimore ECA
follow-up, 1981–2004. Acta Psychiatrica Scandinavica, 116(3), 182–188.
Epstein, LH, Saad, FG, Handley, EA, Roemmich, JN, Hawk, LW, & McSweeney, FK.
(2003). Habituation of salivation and motivated responding for food in
children. Appetite, 41(3), 283–289.
Finlayson, G, & Dalton, M. (2012). Current progress in the assessment of ‘liking’
vs. ‘wanting’ food in human appetite. Comment on ‘“You say it’s liking, i
say it’s wanting…”. On the difficulty of disentangling food reward in man’.
Appetite, 58(1), 373–378.
Finlayson, G, King, N, & Blundell, JE. (2007). Liking vs. wanting food: importance
for human appetite control and weight regulation. Neuroscience and
Biobehavioral Reviews, 31(7), 987–1002.
Forestell, CA, Lau, P, Gyurovski, II, Dickter, CL, & Haque, SS. (2012). Attentional
biases to foods: the effects of caloric content and cognitive restraint.
Appetite, 59(3), 748–754.
Giesen, JC, Havermans, RC, Douven, A, Tekelenburg, M, & Jansen, A. (2010). Will
work for snack food: the association of BMI and snack reinforcement.
Obesity, 18(5), 966–970.
Gil, S, Rousset, S, & Droit-Volet, S. (2009). How liked and disliked foods affect time
perception. Emotion, 9(4), 457–463.
Gould, D, Kelly, D, Goldstone, L, & Gammon, J. (2001). Examining the validity of
pressure ulcer risk assessment scales: developing and using illustrated patient
simulations to collect the data. Journal of Clinical Nursing, 10(5), 697–706.
Jesteadt, W. (1980). An adaptive procedure for subjective judgments. Perception &
Psychophysics, 28(1), 85–88.
Krawczyk, DC. (2002). Contributions of the prefrontal cortex to the neural
basis of human decision making. Neuroscience and Biobehavioral Reviews,
26(6), 631–664.
Ling, Y, & Hurlbert, A. (2004). Color and size interactions in a real 3D object
similarity task. Journal of Visualization, 4(9), 721–734.
Page 9 of 9
Meck, WH, Penney, TB, & Pouthas, V. (2008). Cortico-striatal representation of time
in animals and humans. Current Opinion in Neurobiology, 18(2), 145–152.
Merikangas, KR, & McClair, VL. (2012). Epidemiology of substance use disorders.
Human Genetics, 131(6), 779–789.
Mezey, AG, & Cohen, SI. (1961). The effect of depressive illness on time judgment
and time experience. Journal of Neurology, Neurosurgery, and Psychiatry,
24, 269–270.
Nijs, IM, Muris, P, Euser, AS, & Franken, IH. (2010). Differences in attention to food
and food intake between overweight/obese and normal-weight females
under conditions of hunger and satiety. Appetite, 54(2), 243–254.
Ode, S, Winters, PL, & Robinson, MD. (2012). Approach motivation as incentive
salience: perceptual sources of evidence in relation to positive word primes.
Emotion, 12(1), 91–101.
Phillips, ML, Drevets, WC, Rauch, SL, & Lane, R. (2003). Neurobiology of emotion
perception I: the neural basis of normal emotion perception. Biological
Psychiatry, 54(5), 504–514.
Piazza, PV, Lafontan, M, & Girard, J. (2007). Integrated physiology and
pathophysiology of CB1-mediated effects of the endocannabinoid system.
Diabetes & Metabolism, 33(2), 97–107.
Piech, RM, Pastorino, MT, & Zald, DH. (2010). All I saw was the cake. Hunger
effects on attentional capture by visual food cues. Appetite, 54(3), 579–582.
Salamone, JD, & Correa, M. (2002). Motivational views of reinforcement:
implications for understanding the behavioral functions of nucleus
accumbens dopamine. Behavioural Brain Research, 137(1–2), 3–25.
Salamone, JD, & Correa, M. (2012). The mysterious motivational functions of
mesolimbic dopamine. Neuron, 76(3), 470–485.
Siep, N, Roefs, A, Roebroeck, A, Havermans, R, Bonte, ML, & Jansen, A. (2009).
Hunger is the best spice: an fMRI study of the effects of attention, hunger
and calorie content on food reward processing in the amygdala and
orbitofrontal cortex. Behavioural Brain Research, 198(1), 149–158.
Smets, G. (1969). Time expression of red and blue. Perceptual and Motor Skills,
29(2), 511–514.
Stoeckel, LE, Cox, JE, Cook, EW, 3rd, & Weller, RE. (2007). Motivational state
modulates the hedonic value of food images differently in men and women.
Appetite, 48(2), 139–144.
Stoeckel, LE, Weller, RE, Cook, EW, 3rd, Twieg, DB, Knowlton, RC, & Cox, JE. (2008).
Widespread reward-system activation in obese women in response to
pictures of high-calorie foods. NeuroImage, 41(2), 636–647.
Stoeckel, LE, Kim, J, Weller, RE, Cox, JE, Cook, EW, 3rd, & Horwitz, B. (2009).
Effective connectivity of a reward network in obese women. Brain Research
Bulletin, 79(6), 388–395.
Tataranni, PA, Gautier, JF, Chen, K, Uecker, A, Bandy, D, Salbe, AD, Pratley, RE,
Lawson, M, Reiman, EM, & Ravussin, E. (1999). Neuroanatomical correlates of
hunger and satiation in humans using positron emission tomography.
P National Academic Science USA, 96(8), 4569–4574.
Tedford, WH, Jr, Bergquist, SL, & Flynn, WE. (1977). The size-color illusion.
Journal of General Psychology, 97(1st Half), 145–149.
Valdez, P, & Mehrabian, A. (1994). Effects of color on emotions. Journal of
Experimental Psychology: General, 123(4), 394–409.
Wang, YC, McPherson, K, Marsh, T, Gortmaker, SL, & Brown, M. (2011). Health and
economic burden of the projected obesity trends in the USA and the UK.
Lancet, 378(9793), 815–825.
Wewers, ME, & Lowe, NK. (1990). A critical review of visual analogue scales
in the measurement of clinical phenomena. Research in Nursing and Health,
13(4), 227–236.
Wyrick, RA, & Wyrick, LC. (1977). Time experience during depression. Archives of
General Psychiatry, 34(12), 1441–1443.
Yokum, S, Ng, J, & Stice, E. (2011). Attentional bias to food images associated
with elevated weight and future weight gain: an fMRI study. Obesity, 19(9),
1775–1783.
doi:10.1186/s40359-014-0023-6
Cite this article as: Aouizerate et al.: Toward a new computer-based and
easy-to-use tool for the objective measurement of motivational states in
humans: a pilot study. BMC Psychology 2014 2:23.