Absorption, scattering and single scattering albedo of aerosols obtained from in situ measurements in the subarctic coastal region of Norway
Bạn đang xem bản rút gọn của tài liệu. Xem và tải ngay bản đầy đủ của tài liệu tại đây (3.88 MB, 11 trang )
Atmospheric
Chemistry
and Physics
Discussions
1
1,3
, V. Cachorro , J. Lopez
1
, and A. de Frutos
1
Correspondence to: S. Mogo ()
Published by Copernicus Publications on behalf of the European Geosciences Union.
5
|
Discussion Paper
25
Discussion Paper
20
|
The net effect of aerosols on global climate change is uncertain since the effect of
particles can be to cool or to warm, depending on their optical properties. The reduction
in the intensity of a direct solar beam during its propagation through the atmosphere
is determined by absorption and scattering processes. The aerosol single scattering
albedo, ω0 , is defined as the fraction of the aerosol light scattering over the extinction:
σs
ω0 =
,
(1)
σs + σa
where σs and σa are the aerosol scattering and absorption coefficients, respectively.
ω0 is one of the most relevant optical properties of aerosols, since their direct radiative
2162
|
1 Introduction
Discussion Paper
15
|
10
In situ measurements of aerosol optical properties were made in summer 2008 at the
ALOMAR station facility (69◦ 16 N, 16◦ 00 E), located at a rural site in the North of the is˚
land of Andøya (Vesteralen
archipelago), about 300 km north of the Arctic Circle. The
extended three months campaign was part of the POLAR-CAT Project of the International Polar Year (IPY-2007-2008), and its goal was to characterize the aerosols of
this sub-Arctic area which frequently transporte to the Arctic region. The ambient lightscattering coefficient, σs (550 nm), at ALOMAR had a hourly mean value of 5.412 Mm−1
−1
(StD = 3.545 Mm ) and the light-absorption coefficient, σa (550 nm), had an hourly
˚
¨
mean value of 0.400 Mm−1 (StD = 0.273 Mm−1 ). The scattering/absorption Angstr
om
exponents, αs,a , are used for detailed analysis of the variations of the spectral shape
of σs,a . The single scattering albedo, ω0 , ranges from 0.622 to 0.985 (mean = 0.913,
StD = 0.052) and the relation of this property to the absorption/scattering coefficients
˚
¨ exponents is presented. The relationships between all the parameand the Angstr
om
ters analyzed, mainly those related to the single scattering albedo, allow us to describe
the local atmosphere as extremely clean.
Discussion Paper
Abstract
|
2161
Discussion Paper
Received: 2 January 2011 – Accepted: 13 January 2011 – Published: 20 January 2011
|
´
´
Universidad de Valladolid, Grupo de Optica
Atmosferica,
Spain
ˆ
˜ Portugal
Universidade da Beira Interior, Faculdade de Ciencias,
Covilha,
3
´
´ Huelva, Spain
Instituto Nacional de Tecnica
Aeroespacial, Mazagon,
*
´ Center for Optics and Photonics, Chile
now at: Universidad de Concepcion,
2
Discussion Paper
1,2
|
1,*
E. Montilla , S. Mogo
Discussion Paper
Absorption, scattering and single
scattering albedo of aerosols obtained
from in situ measurements in the
subarctic coastal region of Norway
|
This discussion paper is/has been under review for the journal Atmospheric Chemistry
and Physics (ACP). Please refer to the corresponding final paper in ACP if available.
Discussion Paper
Atmos. Chem. Phys. Discuss., 11, 2161–2182, 2011
www.atmos-chem-phys-discuss.net/11/2161/2011/
doi:10.5194/acpd-11-2161-2011
© Author(s) 2011. CC Attribution 3.0 License.
2164
|
|
Discussion Paper
|
Discussion Paper
|
Discussion Paper
25
Discussion Paper
20
|
15
Discussion Paper
10
This study was carried out within the framework of a larger intensive aerosol characterization campaign conducted in northern Norway at a remote subarctic site in summer 2007 and 2008. The main goal of the campaign was to acquire a comprehensive
physical and chemical characterization of local aerosol. It was part of the participation
of the Atmospheric Optics Group of Valladolid University to the International Polar Year
through the POLAR-CAT project, led by the Norwegian Institute for Air Research. Several instruments for aerosol characterization were employed simultaneously: an ultrafine condensation particle counter (UCPC), a scanning mobility particle sizer (SMPS)
and an aerodynamic particle sizer (APS) for numerical size particle distribution in ultrafine, fine and coarse fractions respectively; a cascade impactor having four stages for
independent absorption coefficient determination with an integrating sphere technique;
a diffraction grating spectroradiometer (ASD) was used for global irradiance measurement and a CIMEL photometer for columnar optical aerosol properties. Finally, the
aerosol radiative properties were examined using a particle soot absorption photometer (PSAP) and a nephelometer.
In the present work only results from aerosol absorption and scattering measurements are presented. Our primary goal was to investigate light absorption/scattering
˚
¨ exponents, αa , αs . The determination of optical pacoefficients and their Angstr
om
rameters as a function of wavelength is useful to distinguish between different aerosol
types. For example, Dubovik et al. (2002) found that for urban-industrial aerosols and
for biomass burning the ω0 decreases with increasing wavelength, while for desert
dust, ω0 increases with increasing wavelength. Rosen et al. (1979) measured αa = 1.0
for urban aerosol and Bond (2001) studied the spectral dependence of visible light
absorption by carbonaceous particles emitted from coal combustion and found strong
spectral dependency, 1.0 < αa < 2.9.
|
5
2163
Discussion Paper
25
|
20
Discussion Paper
15
|
10
Discussion Paper
5
effect is very sensitive to it. Those optical properties of aerosol particles suspended
in the atmosphere show, in general, a great spatial and temporal variability and are
determined by their chemical composition, size, shape, concentration and mixing state
(Kokhanovsky, 2008).
Sulfate and nitrate aerosols from anthropogenic sources, are considered the primary
particles responsible for net cooling. They scatter solar radiation and are effective as
cloud condensation nuclei affecting the lifetime of clouds, the hydrological cycle and
resulting in a negative radiative forcing that leads to a cooling of the Earth’s surface.
To some extent, they are thought to counteract global warming caused by greenhouse
gases such as carbon dioxide (Boucher and Haywood, 2001). On the other hand,
light-absorbing particles, mainly formed by black carbon produced by incomplete combustion of carbonaceous fuels, are effective absorbers of solar radiation and have,
therefore, the opposite effect i.e. they warm the atmosphere. Absorption of solar radiation by aerosols causes heating of the lower troposphere, which may lead to altered
vertical stability, with implications for the hydrological cycle (Ramanathan et al., 2001).
In addition, deposition of light-absorbing particles onto snow and ice results in a
reduction of the surface albedo, which in turn affects the snow pack and the Earth’s
albedo (Law and Stohl, 2007; IPCC, 2007). Clarke and Noone (1985) found that the
snow albedo is reduced by 1–3% in fresh snow and by a factor of 3 as the snow
ages and the light absorbing particles become more concentrated. The Arctic summer
provides an excellant opportunity to study aerosols in regions where there are few
sources of natural particles and limited influence of man-made sources.
The data retrieved from satellites are limited to clear sky conditions and are mainly
valid over dark targets; few satellites retrieve data valid over bright land and snow/ice
surfaces. Also, aerosol optical properties are much more variable at the surface than
at the top of the atmosphere making them much more difficult to estimate (Li et al.,
2007). While columnar aerosol properties have already been studied (Toledano et al.,
2006), as far as we know, no work has been reported on surface measurements of
these important optical aerosol properties in the area of our study.
2.1
5
Data processing
Discussion Paper
2.3
|
aerosols are continuously deposited onto a glass fiber filter at a known flow rate. The
change in the transmitted light is related to the optical absorption coefficient using
Beer’s law. The instrument is an improved version of the integrating plate method (Lin
et al., 1973) and is described in detail by Bond et al. (1999) and Virkkula et al. (2005).
The scattering and backscattering coefficients were measured at three wavelengths
(450, 550 and 700 nm) with an integrating nephelometer (model 3563, TSI) working
with a flow rate of 46 l min−1 . The instrument is described in detail by Anderson et al.
(1996) and Anderson and Ogren (1998). Calibration is carried out twice per month by
using CO2 as high span gas and filtered air as low span gas. The averaging time was
set to 1 min. The zero signal was measured once per hour. For the 1-min averages
−1
applied here, the detection limits for scattering coefficients are 0.65, 0.25, 0.38 Mm
for 450, 550 and 700 nm, respectively (Anderson et al., 1996).
Discussion Paper
10
2165
|
5
Discussion Paper
25
|
20
Aerosol samples were obtained from a stainless steel inlet protected with a rain cap
and a metal screen designed to keep away insects. The inlet of the sampling line is
about 2 m above the roof of the measurement station building, about 7 m above the
ground. The cut off diameter of the inlet nozzle and sample transport line was about
10 µm. The sample air is heated when necessary to achieve a low relative humidity
of 40% prior to entering the instruments. Airflow through the sampling line is divided
into several separate flows and is directed to individual instruments. The working flow
to each instrument was controlled once a day using an electronic bubble flowmeter
(Gilibrator system, Gilian).
The light absorption coefficients were measured at three wavelengths (470, 522 and
660 nm) with a particle soot absorption photometer (PSAP, Radiance Research) working with flow set to 1.5 l min−1 . The instrument uses a filter-based technique in which
Discussion Paper
15
Instrumentation
|
2.2
Discussion Paper
The ALOMAR (Arctic Lidar Observatory for Middle Atmosphere Research) station is
◦
◦
located on Andøya island close to Andenes town (69 16 N, 16 00 E, 380 m a.s.l.), on
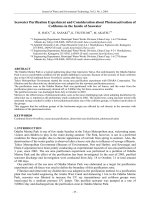
the Atlantic coast of Norway about 300 km north of the Arctic Circle, Fig. 1. The facility
is managed by the Andøya Rocket Range and the site is very suitable for tropospheric
measurements due to the absence of large regional pollution sources. From the end of
May to the end of July the sun is 24 h above the horizon, with a maximum elevation dur◦
◦
ing the solstice of 42 at noon and 2 at midnight. The climate is strongly influenced by
the Gulf Stream, which provides mild temperatures during the entire year, with average
temperatures of −2 ◦ C in January and 11 ◦ C in July. Rapid variations of temperature
can occur in summer months, from 4◦ to 30 ◦ C. Further details on the measurement
station can be found on Skatteboe (1996) and Toledano et al. (2006).
|
10
Site description
Discussion Paper
2 Methods
|
20
Discussion Paper
|
2166
|
25
The response of the PSAP depends on the loading of particles on the filter, on the
amount of light scattered by the particles, on the flow rate and on the spot size (Bond
et al., 1999; Virkkula et al., 2005). The data were corrected for these dependencies
according to the procedure described by Bond et al. (1999). The averaging time was
60 s and the filter was replaced whenever the amount of transmitted light achieved
70% of the initial intensity. As the algorithms presented by Bond et al. (1999) and
Virkkula et al. (2005) agreed well for higher ω0 and smaller σa , and no other values of
σa > 6 Mm−1 have been observed at ALOMAR during the measurements, there is no
need to apply the correction procedure proposed by Virkkula et al. (2005).
The corrected aerosol absorption coefficients at 470, 522 and 660 nm were extrapolated to the working wavelengths of the nephelometer, 450, 550 and 700 nm.
We prefer not to present backscattering as their values lie below the error threshold.
For investigating the wavelength dependence of σa,s , we calculated the absorp˚
¨ exponent. This parameter is commonly used for a more
tion/scattering Angstr
om
Discussion Paper
15
σa,s = K λ−αa,s .
5
log(λ2 /λ1 )
(3)
.
2168
|
Discussion Paper
|
Discussion Paper
25
|
20
Discussion Paper
15
|
10
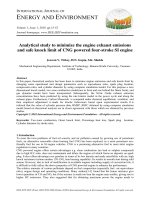
the mean. While the value of σs varies widely, more than two orders of magnitude,
the value of σa remains more stable. The statistics on σs and σa values is presented
in Table 1 and a time series representing over 70 days of measurement is shown in
Fig. 2.
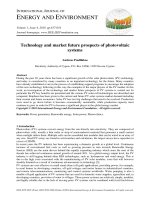
1166 hourly means are available for σs and 1046 for σa , which allowed for the calculation of 883 hourly values of ω0 . The frequency histogram of σs , σa and ω0 at 550 nm,
shown in Fig. 3, presents only one frequency mode, centered at 3 Mm−1 , 0.3 Mm−1
and 0.95, respectively for each parameter. Though the magnitude of σs and σa depend
on many factors, our results were compared with literature values of some other areas
and Table 1 suggests that the magnitude of aerosol scattering/absorption coefficients
in ALOMAR were comparable to those in other polar regions, such as those presented
by Delene and Ogren (2002) and Quinn et al. (2007) at Barrow, or Aaltonen et al.
(2006) at Pallas.
Correspondingly, the hourly mean values of the ω0 parameter measured at ALOMAR
were found to present an average value of 0.928, 0.913 and 0.893 for 450 nm, 550 nm
and 700 nm, respectively; ranging from 0.601 to 0.986, 0.622 to 0.985 and 0.496 to
0.986, see Fig. 2 and Table 1. Nonetheless, the lower value registered was 0.622
(450 nm), in fact, it was observed to vary mainly between 0.8 and 0.985 as can be
seen in Fig. 2 and confirmed by the value of the median, 0.923 (450 nm). See also
Fig. 3. These values are in the range presented for polar regions by several authors
and compiled by Tomasi et al. (2007).
The spectral series of σs and σa measured were examined to derive the correspond˚
¨ exponents following the best fit
ing values of the scattering and absorption Angstr
om
˚
¨ exponent calculated for the 450 nm/700 nm
procedure based on Eq. (2). The Angstrom
wavelength pair was found to range between 0.196 and 3.069 for scattering and between 0.008 and 0.969 for absorption. Statistical properties of the hourly mean values
of the calculated parameters are presented in Table 1 and show mean values of 1.368
and 0.403, respectively. In both cases the median value is lower than the mean. The
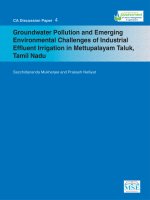
standard deviations are 0.613 and 0.205, respectively. Figure 4a shows the hourly
Discussion Paper
5
|
20
The aerosols sampled on ALOMAR during the 2008 summer campaign were representative of an extremely clean area. During our observations, hourly mean σs at 450 nm,
550 nm and 700 nm ranged from 0.289 to 31.236 Mm−1 , 0.254 to 23.209 Mm−1 and
0.193 to 18.950 Mm−1 (average 7.309, 5.412 and 4.083 Mm−1 and standard deviation
−1
4.794, 3.545 and 2.841 Mm ), respectively. The hourly mean values of σa at 450 nm,
−1
−1
550 nm and 700 nm ranged from 0.135 to 2.715 Mm , 0.130 to 2.281 Mm and 0.119
−1
to 1.917 Mm (average 0.448, 0.400 and 0.358 and standard deviation 0.329, 0.273
and 0.226 Mm−1 ), respectively. For both parameters the median value is lower than
2167
Discussion Paper
3.1 Temporal variations in aerosol properties
|
15
Discussion Paper
3 Results and discussion
|
Absorption and scattering data are available from 13 June to 26 August 2008. The
statistical data are calculated based on the hourly averages, which seems reasonable
given the low values observed. The hourly averages were preferred to the daily averages since they are more sensitive to local effects, while the daily averages are more
useful to identify external long range effects.
Discussion Paper
log(σa,s(λ2 ) /σa,s(λ1 ) )
|
In practice, we calculated αa,s(λ1 ,λ2 ,...,λn ) for more than two wavelengths through the
logarithmic fit of Eq. (2) and we calculated αa,s(λ1 ,λ2 ) for a pair of wavelengths, λ1 ,λ2 ,
according to the following simplified formula:
αa,s = −
10
(2)
Discussion Paper
detailed analysis of the variations of the spectral shape of σa,s and is defined as the
negative slope of the logarithm of absorption coefficient as a function of wavelength
and is given by:
|
25
In Fig. 5a, c we present the correlation between the scattering/absorption in the different channels. The relation between channels describes the proportion of the measurements for different wavelengths and each pair of measurements should obey the
Eq. (2). In this way, the slope of the linear fit for each correlation is the respective
˚
¨ exponent. For absorption coefficients one line is enough to correlate the
Angstr
om
different channels but for scattering we observe two lines with different slopes. The
slopes depend on the particle size, therefore apparently these two lines represent dif˚
¨ exponent can be used to help in identifying
ferent aerosol types and the Angstr
om
2169
those aerosol types. The line with smaller slope is due to larger particles, probably
maritime aerosols, while the line with higher slope is due to smaller particles, maybe
continental aerosol.
Also in Fig. 5b, d, we present the relation between scattering/absorption coefficients
˚
˚
¨ exponents. The Angstr
¨ exponents were calculated for
and the respective Angstr
om
om
the pairs of wavelengths 450 nm/550 nm (αa,s(450−550) ), 550 nm/700 nm (αa,s(550−700) ),
450 nm/700 nm (αa,s(450−700) ) and for the three wavelengths 450 nm/550 nm/700 nm
˚
¨ exponents
(αa,s(450−550−700) ). For both cases, scattering and absorption, the Angstr
om
are higher for the pair of wavelengths 450 nm/550 nm and smaller values for the pair
450 nm/700 nm, defining in this way the shape of the scattering and absorption spectra: decreases quickly on the 450 nm/550 nm range and decreases less abruptly on
˚
¨ exponents calculated, we determined the fit
the 550 nm/700 nm. For all the Angstr
om
error, e, and the quality of the fit through the R parameter. Both, e and R were used to
evaluate and clean the data set.
Figure 6a presents the relation between the scattering and the absorption coefficients. This represents another way to analyze the single scattering albedo parameter.
˚
¨ exponents is also presented and two
In Fig. 6b the relation between the Angstr
om
regions can be identified as showing a higher density of data. Region 1, with higher
exponents due to fine particles may be from continental urban sources. And region 2,
with lower exponents due to coarse particles, clean and less absorbent, may be from
marine origin. These two regions represent the two modes that we could already see
in the frequency histogram of the αs parameter, Fig. 4b. Note the higher density around
αs = 0.7 and αs = 1.9 but the lower density around αs = 1.3.
Figure 7 displays the ω0 as a function of the scattering/absorption coefficients and
˚
¨ exponents. For a given σa value, the lower ω0 values correspond to
the Angstr
om
smaller particles and higher ω0 values correspond to larger particles (Clarke et al.,
2007). Also, the fine particles are present in the more absorbent region while the
coarse particles appear as less absorbent. In addition, the particle size can be indi˚
¨ exponent, with higher αs for smaller particles
cated through the scattering Angstr
om
Discussion Paper
2170
|
|
Discussion Paper
|
Discussion Paper
25
Discussion Paper
20
|
15
|
10
Discussion Paper
3.2
|
Discussion Paper
20
5
Relationships between the aerosol parameters
Discussion Paper
15
|
10
Discussion Paper
5
˚
¨ exponent values for the 450 nm/700 nm wavelength pair covering the
mean Angstr
om
whole measurement period.
The frequency histogram of αs and αa are shown in Fig. 4b, c. The histogram for
αa presents only one frequency mode, centered at 0.35, whereas the histogram for
αs presents two modes, centered at 0.7 and 1.9, respectively. While the absorption
˚
¨ exponent is in the range presented for other polar regions (Tomasi et al.,
Angstr
om
˚
¨ exponent presents some higher
2007; Aaltonen et al., 2006), the scattering Angstr
om
values more typical of sites affected by urban or continental pollution (Vrekoussis et al.,
2005).
We also analyzed the spectral dependence of the single-scattering albedo, since this
parameter, αω0 , is known to be very sensitive to the composition of the particles. For the
450 nm/700 nm wavelength pair, αω0 was found to range between −0.112 and 0.949,
mean value of 0.091 and standard deviation of 0.088. Therefore, the high standard
deviation of this parameter within its range of values indicates that a large variety of
aerosol types are present at ALOMAR during summer. The observed negative values
are due to desert aerosol air masses that reach the ALOMAR station. These are rare
and usually weak short duration episodes as the desert aerosol has to travel across
Europe before reaching ALOMAR station. However, one or two events, 1 to 2 days
long, have been observed every summer (Rodr´ıguez, 2009).
Discussion Paper
4 Conclusions
|
10
Discussion Paper
5
and smaller αs for larger particles. In this way, the relationship between ω0 , as an intensive aerosol optical property and the σa , as an extensive property, can be used to
differentiate background aerosol and inputs of primary aerosols (Cappa et al., 2009).
For the ALOMAR station, we observe the predominant high values of ω0 , due to very
low σa values. This fact, together with the αs values registered, allow us to describe
the local as extremely clean and only episodically influenced by small particles resulting
from long range transport.
In Fig. 7e the single scattering albedo, ω0 , is plotted versus its own exponent, αω0 .
The spectral shape decreases mainly with the wavelength, αω0 > 0, but some cases
were registered for which the single scattering albedo increased with the wavelength
(αω0 < 0) due to the arrival of dust.
|
analyzed. The spectral shape decreases mainly with the wavelength. However, some
cases were noted for which the single scattering albedo increased with the wavelength.
Discussion Paper
Financial supports from the Spanish MICIIN (projects CGL2008-05939-CO3-00/CLI and
´ are gratefully
CGL200909740) and from the GR-220 Project of the Junta de Castilla y Leon
acknowledged.
References
2172
|
|
Discussion Paper
25
Discussion Paper
20
Aaltonen, V., Lihavainen, H., Kerminen, V.-M., Komppula, M., Hatakka, J., Eneroth, K., Kulmala, M., and Viisanen, Y.: Measurements of optical properties of atmospheric aerosols in
Northern Finland, Atmos. Chem. Phys., 6, 1155–1164, doi:10.5194/acp-6-1155-2006, 2006.
2168, 2169
Anderson, T. and Ogren, J.: Determining aerosol radiative properties using the TSI 3563 integrating nephelometer, Aerosol Sci. Tech., 29, 57–69, 1998. 2166
Anderson, T., Covert, D., Marshall, S., Laucks, M., Charlson, R., Waggoner, A., Ogren, J.,
Caldow, R., Holm, R., Quant, F., Sem, G., Wiedensohler, A., Ahlquist, N., and Bates, T.:
Performance characteristics of a high-sensitivity, three-wavelength, total scatter/backscatter
nephelometer, J. Atmos. Ocean. Tech., 13, 967–986, 1996. 2166
Bond, T.: Spectral dependence of visible light absorption by carbonaceous particles emitted
from coal combustion, Geophys. Res. Lett., 28, 4075–4078, 2001. 2164
Bond, T., Anderson, T., and Campbell, D.: Calibration and intercomparison of filter-based measurements of visible light absorption by aerosols, Aerosol Sci. Tech., 30, 582–600, 1999.
2166
Boucher, O. and Haywood, J.: On summing the components of radiative forcing of climate
change, Clim. Dynam., 18, 297–302, 2001. 2163
|
15
Discussion Paper
Acknowledgements. The ALOMAR eARI (Enhanced Access to Research Infrastructure)
Projects, under the EUs 5th framework program (FP), funded the aerosol measurements at
Andenes. We thank ALOMAR team for their help and dedication and the INTA team for providing and operate part of the instrumentation. Also, we thank the Division of Atmospheric
Sciences (Helsinky University) team headed by Kulmala and its responsible for POLARCAT
activities, Laakso, for calibration facilities.
|
10
2171
|
5
Discussion Paper
25
|
20
Discussion Paper
15
Aerosol optical properties relevant to direct climate forcing were investigated during
2008 summer at the ALOMAR station, located in Andøya island, on the Atlantic coast
of Norway about 300 km north of the Arctic Circle. Primary measurements were light
absorption by particle soot absorption photometry and light scattering by nephelometry. The scattering coefficients presented strong variability, ranging from 0.254 to
−1
23.209 Mm at 550 nm, while the absorption coefficients remain more stable, rang−1
ing from 0.130 to 2.281 Mm also at 550 nm. The mean absorption coefficient was
found to be very weak, leading to higher single scattering albedos (mean ω0 = 0.912
at 550 nm).
˚
¨ exponents, both present the same behavior,
The scattering and absorption Angstr
om
with higher values in the 450–550 nm range of the spectrum and smaller values in the
˚
¨ exponents registered were
range from 550 to 700 nm. Yet, the absorption Angstr
om
˚
¨ exponents.
considerably smaller than the scattering Angstr
om
We calculated the single scattering albedo and obtained values ranging from 0.622
to 0.985 at 550 nm. The spectral dependence of the single scattering albedo was also
|
Discussion Paper
|
Discussion Paper
20
Discussion Paper
15
|
10
Rosen, H., Hansen, D., Gundel, L., and Novakov, T.: Identification of the graphitic carbon
component of source and ambient particulates by Raman spectroscopy and an optical attenuation technique, in: Carbonaceous particles in the atmosphere, Lawrence Berkeley Laboratory, 229–232, 1979. 2164
Skatteboe, R.: ALOMAR: atmospheric science using lidars, radars and ground based instruments, J. Atmos. Terr. Phys., 58, 1823–1826, doi:10.1016/0021-9169(95)00173-5, 1996.
2165
´ A., Sorribas, M., Vergaz, R., de Frutos, A., Anton,
´ M., and
Toledano, C., Cachorro, V., Berjon,
Gausa, M.: Aerosol optical depth at ALOMAR Observatory (Andøya, Norway) in summer
2002 and 2003, Tellus, 58B, 218–228, 2006. 2163, 2165
Tomasi, C., Vitale, V., Lupi, A., Carmine, C. D., Campanelli, M., Herber, A., Treffeisen, R., Stone,
R., Andrews, E., Sharma, S., Radionov, V., von Hoyningen-Huene, W., Stebel, K., Hansen,
¨
G., Myhre, C., Aaltonen, C. W. V., Lihavainen, H., Hillamo, A. V. R., Strom,
J., Toledano,
C., Cachorro, V., Ortiz, P., de Frutos, A., Blindheim, S., Frioud, M., Gausa, M., Zielinski,
T., Petelski, T., and Yamanouchi, T.: Aerosols in polar regions: A historical overview based
on optical depth and in situ observations, J. Geophys. Res., 112, D16205, doi:10.1029/
2007JD008432, 2007. 2168, 2169
Virkkula, A., Ahquist, N., Covert, D., Arnott, W., Sheridan, P., Quinn, P., and Coffman, D.:
Modification, calibration and a field test of an instrument for measuring light absorption by
particles, Aerosol Sci. Tech., 39, 68–83, 2005. 2166
Vrekoussis, M., Liakakou, E., Koc¸ak, M., Kubilay, N., Oikonomou, K., Sciare, J., and Mihalopoulos, N.: Seasonal variability of optical properties of aerosols in the Eastern Mediterranean,
Atmos. Environ., 39, 7083–7094, doi:10.1016/j.atmosenv.2005.08.011, 2005. 2169
Discussion Paper
5
2173
|
30
Discussion Paper
25
|
20
Discussion Paper
15
|
10
Discussion Paper
5
Cappa, C., Bates, T., Quinn, P., and Lack, D.: Source characterization from ambient measurements of aerosol optical properties, Geophys. Res. Lett., 36, L14813, doi:10.1029/
2009GL038979, 2009. 2171
Clarke, A. and Noone, J.: Measurements of soot aerosol in Arctic snow, Atmos. Environ., 19,
2045–2054, 1985. 2163
Clarke, A., McNaughton, C., Kapustin, V., Shinozuka, Y., Howell, S., Dibb, J., Zhou, J.,
Anderson, B., Brekhovskikh, V., Turner, H., and Pinkerton, M.: Biomass burning and
pollution aerosol over North America: Organic components and their influence on spectral optical properties and humidification response, J. Geophys. Res., 112, D12S18, doi:
10.1029/2006JD007777, 2007. 2170
Delene, D. and Ogren, J.: Variability of aerosol optical properties at four North American surface
monitoring sites, J. Aerosol Sci., 59, 1135–1150, 2002. 2168
´ D., and Slutsker,
Dubovik, O., Holben, B., Eck, T., Smirnov, A., Kaufman, Y., King, M., Tanre,
I.: Variability of absorption and optical properties of key aerosol types observed in worldwide
locations, J. Atmos. Sci., 59, 590–608, 2002. 2164
IPCC: Climate Change 2007, Tech. rep., Intergovernamental Panel on Climate Change, 2007.
2163
Kokhanovsky, A.: Aerosol optics: light absorption and scattering by particles in the atmosphere,
Springer, Praxis, 2008. 2163
Law, K. and Stohl, A.: Arctic Air Pollution: Origins and Impacts, Science, 315, 1537–1540,
doi:10.1126/science.1137695, 2007. 2163
Li, Z., Xia, X., Cribb, M., Mi, W., Holben, B., Wang, P., Chen, H., Tsay, S.-C., Eck, T., Zhao,
F., Dutton, E., and Dickerson, R.: Aerosol optical properties and their radiative effects in
northern China, J. Geophys. Res., 112, D22S01, doi:10.1029/2006JD007382, 2007. 2163
Lin, C., Baker, M., and Charlson, R.: Absorption coefficient of atmospheric aerosol: a method
of measurement, Appl. Optics, 12, 1356–1363, 1973. 2166
Quinn, P., Shaw, G., Andrews, E., Dutton, E., Ruoho-Airola, T., and Gong, S.: Arctic haze:
current trends and knowledge gaps, Tellus, 59, 99–114, 2007. 2168
Ramanathan, V., Crutzen, P., Kiehl, J., and Rosenfeld, D.: Aerosols, climate, and the hydrological cycle, Science, 294, 2119–2124, doi:10.1126/science.1064034, 2001. 2163
´ de los aerosoles en la estacion
´ sub-artica
´
Rodr´ıguez, E.: Caracterizacion
de ALOMAR (69◦ N,
◦
´
´
16 E) mediante el analisis
de propiedades opticas,
Ph.D. thesis, University of Valladolid,
2009 (in Spanish). 2169
|
Discussion Paper
|
2174
Discussion Paper
|
Discussion Paper
1.368
0.613
450 nm
550 nm
700 nm
0.448
0.400
0.358
0.329
0.273
0.226
0.403
0.205
0.008–0.969
0.394
0.928
0.913
0.893
0.041
0.047
0.062
0.601–0.986
0.622–0.985
0.496–0.986
0.938
0.923
0.904
0.091
0.088
−0.112–0.949
0.071
450 nm
550 nm
700 nm
range
0.289–31.236
0.254–23.209
0.193–18.950
|
2175
median
Discussion Paper
4.794
3.545
2.841
|
αω0 (450−750)
1.363
0.347
0.322
0.296
StD
7.309
5.412
4.083
αa(450−750)
ω0
0.196–3.069
0.135–2.715
0.130–2.281
0.119–1.917
mean
450 nm
550 nm
700 nm
αs(450−750)
σa [Mm−1 ]
6.576
4.753
3.392
Discussion Paper
−1
σs [Mm ]
|
Table 1. Evaluation of the overall ranges and median values of the absorption/scattering coef˚
¨ exponents and the single scattering albedo obtained from the data set
ficients, the Angstr
om
measured at ALOMAR.
Discussion Paper
|
Discussion Paper
|
Discussion Paper
|
|
2176
Discussion Paper
Fig. 1. Location of the ALOMAR station in Northern Norway.
Discussion Paper
0 .9
0 .8
(a )
0 .7
J u l 1 3
J u l 2 8
A u g 1 2
A u g 2 7
]
-1
2 0
(b )
1 5
1 0
5
0
J u n 1 3
J u n 2 8
2 .5
2 .0
1 .5
1 .0
0 .5
0 .0
J u n 1 3
J u l 1 3
J u l 2 8
A u g 1 2
A u g 2 7
Discussion Paper
(c )
J u n 2 8
J u l 1 3
J u l 2 8
A u g 1 2
|
σa ( 5 5 0 n m ) [ M m
2 5
|
σs ( 5 5 0 n m ) [ M m
-1
]
J u n 2 8
Discussion Paper
0 .6
J u n 1 3
|
ω0 ( 5 5 0 n m )
1 .0
A u g 2 7
Fig. 2. Time-series of hourly average values of (a) single scattering albedo, (b) scattering
coefficient and (c) absorption coefficient at 550 nm.
Discussion Paper
2177
|
D a y
Discussion Paper
4 0 0
6 0 0
(a )
(b )
5 0 0
3 0 0
1 0 0
3 0 0
2 0 0
1 0 0
0
0
0
5
1 0
1 5
σs ( 5 5 0 n m ) [ M m
2 0
-1
2 5
0 .0
0 .5
1 .0
1 .5
σa ( 5 5 0 n m ) [ M m
]
2 .0
-1
2 .5
]
Discussion Paper
1 6 0
1 4 0
1 2 0
F re q u e n c y
|
(c )
1 8 0
Discussion Paper
F re q u e n c y
2 0 0
|
F re q u e n c y
4 0 0
1 0 0
8 0
6 0
4 0
2 0
|
0
0 .7
0 .8
0 .9
1 .0
ω0 ( 5 5 0 n m )
Fig. 3. Frequency histogram for the (a) scattering coefficient, (b) absorption coefficient and
(c) single scattering albedo.
|
2178
Discussion Paper
0 .6
αs
3
5 0 -7 0 0
1
0
J u n 1 3
J u n 2 8
J u l 1 3
J u l 2 8
A u g 1 2
Discussion Paper
α4
|
2
A u g 2 7
D a y
|
F re q u e n c y
F re q u e n c y
1 2 0
1 0 0
8 0
6 0
4 0
2 0
0
0 .8
1 .2
1 .6
2 .0
2 .4
2 .8
3 .2
0 .0
0 .2
0 .4
αa
(4 5 0 -7 0 0 )
0 .6
0 .8
1 .0
(4 5 0 -7 0 0 )
˚
¨ expoFig. 4. (a) Time-series of hourly average values of the absorption/scattering Angstr
om
˚
¨ exponents.
nents. (b, c) Frequency histogram for the scattering and absorption Angstr
om
|
3 5
3 .0
3 0
2 .5
]
-1
1 5
5
(a )
0
2 .0
1 .5
1 .0
0 .5
(c )
0 .0
0
5
1 0
1 5
σs ( 5 5 0 n m ) [ M m
-1
2 0
2 5
0 .0
0 .5
1 .5
2 .0
-1
2 .5
]
αa
(4 5 0 -5 5 0 )
αa
(4 5 0 -7 0 0 )
(4 5 0 -7 0 0 )
αa
(5 5 0 -7 0 0 )
(5 5 0 -7 0 0 )
αa
(4 5 0 -5 5 0 -7 0 0 )
αs
(4 5 0 -5 5 0 )
αs
αs
αs
(4 5 0 -5 5 0 -7 0 0 )
1 .5
1 .0
αa
αs
2
0 .5
1
(b )
(d )
0 .0
0
5
1 0
1 5
-1
2 5
0 .0
0 .5
1 .0
1 .5
σa ( 5 5 0 n m ) [ M m
-1
2 .5
]
Fig. 5. Hourly average values of the (a) scattering and (c) absorption for different wavelengths.
Hourly average values of the (b) scattering coefficient at 550 nm as a function of the scattering
˚
¨ exponents and (d) absorption coefficient at 550 nm as a function of the absorption
Angstr
om
˚
¨ exponents.
Angstr
om
2180
|
]
2 .0
Discussion Paper
σs ( 5 5 0 n m ) [ M m
2 0
|
0
Discussion Paper
3
1 .0
σa ( 5 5 0 n m ) [ M m
|
4
]
Discussion Paper
1 0
σa ( 4 5 0 n m ) [ M m
-1
2 0
|
σs ( 4 5 0 n m ) [ M m
Discussion Paper
]
2179
2 5
Discussion Paper
αs
|
0 .4
(c )
2 0 0
1 8 0
1 6 0
1 4 0
1 2 0
1 0 0
8 0
6 0
4 0
2 0
0
1 4 0
Discussion Paper
(b )
1 6 0
0 .0
Discussion Paper
αa
(a )
4
Discussion Paper
|
(4 5 0 -7 0 0 )
αs
-1
]
1 0
5
0
0 .0
0 .5
1 .0
1 .5
2 .0
2 .5
-1
σa ( 5 5 0 n m ) [ M m
r e g io n 1
r e g io n 2
0 .0
0 .5
αa
]
1 .0
1 .5
(4 5 0 -7 0 0 )
Fig. 6. Relationship between (a) the coefficients σs and σa , (b) the slopes αs and αa and (C)
the single scattering albedo, ω0 , and its slope, αω0 .
Discussion Paper
σs ( 5 5 0 n m ) [ M m
1 5
(b )
|
3 .5
3 .0
2 .5
2 .0
1 .5
1 .0
0 .5
0 .0
(a )
2 0
Discussion Paper
2 5
|
Discussion Paper
|
2181
1 .0
0 .8
0 .7
0 .8
0 .7
0 .6
0 .0
0 .5
1 .0
1 .5
-1
2 .0
2 .5
0
5
]
1 .0
1 0
1 5
-1
σs ( 5 5 0 n m ) [ M m
2 0
2 5
]
1 .0
(c )
(d )
0 .9
ω0 ( 5 5 0 n m )
0 .9
0 .8
0 .7
0 .8
Discussion Paper
σa ( 5 5 0 n m ) [ M m
|
0 .6
ω0 ( 5 5 0 n m )
(b )
0 .9
ω0 ( 5 5 0 n m )
ω0 ( 5 5 0 n m )
0 .9
Discussion Paper
(a )
1 .0
0 .7
|
0 .6
0 .0
0 .2
0 .4
αa
0 .6
0 .8
1 .0
1 .2
0 .0
0 .5
1 .0
(4 5 0 -7 0 0 )
1 .0
1 .5
αs
2 .0
2 .5
3 .0
3 .5
(4 5 0 -7 0 0 )
(e )
0 .8
|
ω0 ( 5 5 0 n m )
0 .9
Discussion Paper
0 .6
0 .7
-0 .2
0 .0
0 .2
0 .4
αω
0
0 .6
0 .8
1 .0
(4 5 0 -7 0 0 )
Fig. 7. Hourly average values of the single scattering albedo as a function of the (a) ab˚
¨ exponent, (d) scattering
sorption coefficient, (b) scattering coefficient, (c) absorption Angstr
om
˚
¨ exponent and (e) exponent αω0 .
Angstr
om
|
2182
Discussion Paper
0 .6