Indentation for investigation of strain rate effect on mechanical properties in structural steel weld zone
Bạn đang xem bản rút gọn của tài liệu. Xem và tải ngay bản đầy đủ của tài liệu tại đây (1005.04 KB, 9 trang )
Journal of Science and Technology in Civil Engineering NUCE 2019. 13 (3): 104–112
INDENTATION FOR INVESTIGATION
OF STRAIN RATE EFFECT ON MECHANICAL PROPERTIES
IN STRUCTURAL STEEL WELD ZONE
Pham Thai Hoana,∗, Nguyen Ngoc Vinhb , Nguyen Thi Thanh Tungc
a
Faculty of Building and Industrial Construction, National University of Civil Engineering,
55 Giai Phong road, Hai Ba Trung district, Hanoi, Vienam
b
Department of Civil and Environmental Engineering, Sejong University,
98 Gunja-dong, Gwangjin-gu, Seoul, South Korea
c
Faculty of Civil Engineering, Vinh University,
182 Le Duan street, Truong Thi district, Vinh city, Nghe An province, Vietnam
Article history:
Received 22/07/2019, Revised 21/08/2019, Accepted 22/08/2019
Abstract
In this study, instrumented indentation testing was conducted at room temperature for the investigation of the
effect of strain rate on the hardness and yield strength in the weld zone of a commonly used structural steel,
SM520. A number of indentation tests were undertaken at a number of strain rate values from 0.02 s−1 to
0.2 s−1 in the weld metal (WM), heat-affected zone (HAZ), and base metal (BM) regions of the weld zone.
The mechanical properties including yield strength (σy ) and hardness (H) in WM, HAZ, and BM were then
computed from the applied load-penetration depth curves using a proposed method. As the result, the effects
of strain rate indentation on yield strength and hardness in all regions of the weld zone were evaluated. The
results displayed that hardness and yield strength in the weld zone’s components are influenced on the strain
rate, where both hardness and yield strength decrease with the decreasing strain rate.
Keywords: indentation; mechanical properties; strain rate effect; structural steel; weld zone.
/>
c 2019 National University of Civil Engineering
1. Introduction
The excellent weldability and machinability of structural steel, which caused by it’s high strength,
stiffness, toughness, and ductility, have led to the common usage of this material in many construction
fields including buildings, bridges, tunnels and in the manufaction of machinery parts and equipments
[1–3]. Welding is considered as the efficient method to form the strong joints between the steel parts,
where the structural steel is used. However, the welding joints are also considered as the weakest parts
of structures [4]. The heating or cooling stages influence the microstructures in the weld zone, including the weld metal (WM) region, the heat-affected zone (HAZ), and base metal (BM) region near
the weld due to the transformation of solid-state phases, leading to the change of material properties
in the weld zone [5–8]. Thus, the properties in the local regions of weld joints need to be evaluated. The high ductility and energy dissipation capacity have also been the important reason for the
wide utilization of structural steel in both static and seismic applications. It has been pointed out that
the mechanical properties of structural steel are governed by the metallurgical aspects and strongly
∗
Corresponding author. E-mail address: (Hoan, P. T.)
104
Hoan, P. T., et al. / Journal of Science and Technology in Civil Engineering
dependent on the conditions of strain rate [9–11]. For example, Luecke et al. [11] carried out the
dynamic loading tensile tests for several low-carbon steel types and concluded that their tensile and
yield strength decrease with the decreasing strain rate. However, the influences of strain rate on the
hardness and yield strength in the weld zone of structural steel have not been well reported. Since
these effects are the important factor for the engineering analyses as well as the steel structure designs
in the both static and dynamic problems, it is essential to have a comprehensive investigation of the
strain rate influences on the hardness and yield strength in the weld zone of structural steel.
Instrumented indentation testing (IIT) has been known as an efficient method in extracting material properties at both the macro- and nano-scales [12]. For characterization of the mechanical
properties under different strain rate levels, it has also proved to be reliable and efficient since this
approach can not only provide accurate results [13–16] but also overcome the uneconomical and
time-consuming dynamic tensile loading tests.
This work aims to evaluate the strain rate influences on the hardness and yield strength in the weld
zone of structural steel using instrumented indentation tests. A number of indentations were undertaken at a number of strain rate values from 0.02 s−1 to 0.2 s−1 in the weld zone (WM), heat-affected
zone (HAZ), and base metal (BM) regions. The mechanical properties including yield strength (σy )
and hardness (H) in WM, HAZ, and BM were then computed from applied load-penetration depth
curves of indentation using a proposed method. As the result, the effects of strain rate indentation on
yield strength and hardness in all regions of the weld zone were investigated.
2. Methods
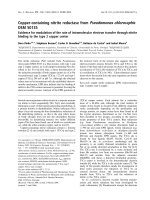
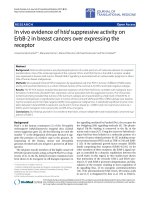
Fig. 1 illustrates a typical load-depth (P-h) curve of an elastic-plastic material to a three-sided
Berkovich indentation [17]. From this curve, several indentation characteristic parameters, such as the
maximum penetration depth hm , the maximum applied load Pm , the residual depth after unloading hr ,
the initial unloading slope S , the loading curvature C, the projected of contact Ac , the residual plastic
work W p , and the recovered elastic work We , can be extracted. As can be seen in Fig. 1, hm , Pm , hr , W p ,
and We , can be directly obtained from the P-h curve, while S , C, and Ac can only be extracted based
on the description of loading and unloading curves. For sharp indenters, the initial unloading slope
S , the loading curvature C, and the projected of contact Ac can be expressed, respectively, as follows
[17]:
dP
= mB (hm − hr )m−1
dh h=hm
Pm
C= 2
hm
Ac = 24.5h2c
S =
(1)
(2)
(3)
where hc = hm − ε∗ Pm /S and ε∗ = 0.75 for sharp indenters [17].
The mechanical properties of the indented material, such as elastic modulus E, yield strength σy ,
strain hardening exponent n, and hardness H, can thus be evaluated from these above indentation
parameters. Numerous analytical approaches that allow the determining of the mechanical properties
from the indentation load-penetration depth curve have been proposed in recent years [17–21]. Among
which Oliver and Pharr’s method [17] has been considered as one of the most popular methods to
extract elastic modulus and hardness of indented material, while the algorithm proposed by Pham
et al. [21] could be considered as a representative approach for determination of yield strength and
105
C=
Pm
hm2
(2)
Ac = 24.5hc2
(3)
= hm −P. T.,Pmet al.
S and
=of0.75
where hc Hoan,
for sharp
indenters in[17].
/ Journal
Science
and Technology
Civil Engineering
*
*
Figure
indentation
Figure1.1.Typical
Typical load-depth
load-depth (P-h) curve of indentation
The mechanical properties of the indented material, such as elastic modulus E,
yield strength
y, of
strain
hardening
exponent
n, and
H, can thus
evaluated
strain hardening
exponent
structural
steel.
In Oliver
andhardness
Pharr’s method,
thebe
value
of E and H
from
these
indentation
parameters.
be extracted
from
theabove
following
relations
[17]: Numerous analytical approaches that allow
the determining of the mechanical √
properties from the indentation load-penetration
π S
Er =in recent
depth curve have been proposed
√ years [17-21]. Among which Oliver and
2β A
Pharr’s method [17] has been considered cas one of the most popular methods to
−1
1 − v2i material, while the algorithm
1 − vof2 indented
extract elastic modulus and hardness
E =
+
proposed by Pham et al. [21] rcould beE considered
Ei as a representative approach for
determination of yield strength andPm
strain hardening exponent of structural steel. In
H value
= of E and H can be extracted from the following
Oliver and Pharr’s method, the
Ac
can
(4)
(5)
(6)
where Er is the reduced modulus owing to the effects
of elastic deformation of the indenter. E, υ, Ei
3
and υi are the elastic modulus and Poisson’s ratio of the sample and indenter, respectively.
For determination of the yield strength, the algorithm proposed by Pham et al. [21] that allows
extracting yield strength σy of structural steel was used. In this method, the yield strength σy in the
weld zone can be determined with respect to α using the following polynomial equations [21]:
Er∗
=
σy
4
4
3
ai jk n j−1 αk−1
i=1 j=1 k=1
S
=
∗
E r hm
4
4
Er∗
C
i−1
3
bi jk n j−1 αk−1 ln
i=1 j=1 k=1
(7)
Er∗
σy
i−1
(8)
where α is defined as the ratio of the strain at starting point of strain hardening and the yield strain
and ai jk and bi jk are coefficients [21]. The α value of the weld zones can be obtained with the aid of
FE analysis of indentation by correlating the experimental with the simulated load- depth curves. The
details of the procedure for determination of the yield strength in the weld zones from the proposed
method and FE analysis can be found in the previous work [22].
3. Experiments
One of the most common used structural steel (SM520) with the chemical composition listed in
Table 1 was chosen to be investigated. The weld with suitable weld material in the form of double V
106
Hoan, P. T., et al. / Journal of Science and Technology in Civil Engineering
groove butt with no root gap was employed to connect two 12 mm-thickness steel plates by welding
using metal arc method under an 100 A of current and 22 V of voltage.
Table 1. Compositions of weld and steel material (in wt.%)
Material
C
Si
Mn
P
S
Al
Cu
Ni
Steel
Weld
0.17
0.12
0.41
0.35
1.39
1.44
0.017
0.010
0.001
0.003
0.04
0.04
0.02
-
0.13
From the welded plate, a slice across the weld was cut out by water jet cutting method. Such cutting method did not affect the transformation of properties in the weld zone. The slice was then used
for the preparation of indentation specimen according to ASTM E3-01 standards [23]. The smooth
and flat of specimen surface were ensured to meet the requirement of the indentation standard after
being polished in seven stages by silicon carbide papers, poly diamond particles, and colloidal silica
with the fineness of the last stage about 40 nm. Such a smooth and flat surface of specimen for indentation tests is considered as main criterion to eliminate the surface roughness in the similarity analysis
and to minimize the occurance of error in the tests [24]. Indentation testing was carried out using a
Nano Hardness Tester at room temperature comforming to ASTM E2546-07 standard [25]. The diamond Berkovich indenter with elastic modulus of Ei = 1141 GPa and Poission ratio of υ = 0.07, was
Journal of
of Science
Science and
and Technology
Technology in
in Civil
Civil Engineering
Engineering -- NUCE
2019
employed. Indentation tests were undertaken in threeJournal
regions,
WM,
HAZ,
and
BM ofNUCE
the2019
weld zone
by using the displacement control mode without a holding time at a number of strain rate values from
0.02 s−1 to 0.2 s−1 . A 50 µm spacing - grid of 5 × 5 indenting points were performed at each strain rate
value of 0.02 s−1 , 0.04 s−1 , 0.1 s−1 , and 0.2 s−1 for each region of the weld, leading to the total of 100
and 300 indenting points in each region and in all regions of the weld, respectively. All indentations
were also carried with a maximum applied load of 2000 nm in order to obtain the composite behavior
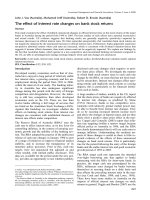
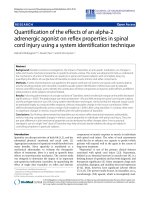
instead of a microstructural phase response from the tests. Fig. 2 shows the cut-out location of the
specimen from the welded plate and the polishing specimen surface, on which the indenting positions
Journal
of Science
and Technology
in Civil
- NUCE
2019 sample in the indentation test machine.
are
also illustrated,
and
theEngineering
installation
of the
(a)
(a)
(a)
(a)
(b)
(b)
(b)
(c)
(c)
(c)
Figure 2. (a) Cut-out
Cut-out from
from the
the welded
welded plate
plate by
by water
water jet,
jet, (b)
(b) Indenting
Indenting positions
positionsin
ineach
each
region, and
and (c)
(c) Sample
Sample installed
installed in
in the
the indentation
indentation test
test machine
machine
Figure 2. (a) Cut-out from the welded plate by water jet, (b) Indenting positions in each region
and (c) Sample installed in the indentation test machine
4. Results and discussion
discussion
4.1. Indentation response
response
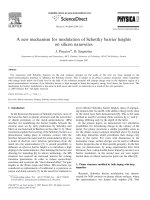
The representative
representative indentation
indentation responses
responses of
of the
the material
material in
in BM,
BM, HAZ,
HAZ, and
and WM,
WM,
at different strain rate
rate levels,
levels, together
together with
with the
the averaged
averaged load-depth
load-depth curves
curves in
in these
these
regions at a certain strain
strain rate
rate level
level of
of 0.2
0.2 ss-1-1 are
are displayed
displayed in
in Fig.
Fig. 3.
3. ItIt isis seen
seen from
from
Figs. 3a-c
that strain rate
107
rate during
during indentation
indentation tests
tests influences
influences both
both the
the shape
shape and
and the
the
magnitude of the load-depth
load-depth curves
curves of
of the
the tests.
tests. For
For all
all regions
regions in
in the
the weld,
weld, the
the
loading curvature tends
tends to
to decrease
decrease with
with the
the decreasing
decreasing strain
strain rate
rate during
during the
the tests,
tests,
leading to the higher maximum
maximum applied
applied load
load with
with the
the higher
higher strain
strain rate
rate level
level due
dueto
tothe
the
66
Hoan, P. T., et al. / Journal of Science and Technology in Civil Engineering
4. Results and discussion
Journal
of Science
Science and
and Technology
Technology in
in Civil
Civil Engineering
Engineering -- NUCE
NUCE 2019
2019
Journal
of
4.1. IndentationJournal
response
of
Journal
ofScience
Scienceand
andTechnology
Technology in
in Civil
Civil Engineering
Engineering -- NUCE
NUCE 2019
2019
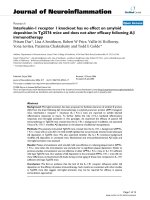
The representative indentation responses of the material in BM, HAZ, and WM, at different strain
rate levels, together with the averaged load-depth curves in these regions at a certain strain rate level
applied
constant
maximum
displacement
in
all
the
tests.
Regarding
to
the
correlation
applied
constant
maximum
displacement
in
all
the
Regarding
to
the
applied
maximum
displacement
in
tests.
Regarding
to
the
correlation
applied
constant
maximum
displacement
in all
all the
the tests.
tests.
Regarding
toindentation
the correlation
correlation
of
0.2 s−1constant
are displayed
in Fig. 3. It
is seen from Figs.
3(a)–3(c)
that strain
rate during
tests
between
the
indentation
response
in
different
regions
of
the
weld,
the
distinguishable
influences
both
the
shape
and
the
magnitude
of
the
load-depth
curves
of
the
tests.
For
all
regions
in
between
the
indentation
response
in
different
regions
of
the
weld,
the
distinguishable
between
between the
the indentation
indentation response
response in
in different
different regions
regions of
of the
the weld,
weld, the
the distinguishable
distinguishable
the weld, the
loading
curvature tends
to decrease
with
the decreasing
strain
rate
during
thebetests,
leadvariation
of
the
indentation
curves
obtained
from
BM,
HAZ,
and
WM
can
observed
variation
of
the
indentation
curves
obtained
from
variation
BM,
HAZ,
and
WM
can
be
observed
variationof
ofthe
theindentation
indentation curves
curves obtained
obtained from
from BM,
BM, HAZ,
HAZ, and
and WM
WM can
can be
beobserved
observed
ing to the higher maximum applied load with the higher strain rate level due to the applied constant
in
Fig.
3d.
can
be
seen
from
this
figure
that
both
loading
curvature
and
applied
load
that
both
loading
curvature
and
load
in
ItIt
this
figure
loading
curvature
and
applied
load
in Fig.
Fig. 3d.
3d.
It can
can be
be seen
seen
from
this
figure that
that
both
loading
curvature
and applied
applied
load
maximum
displacement
in all from
the
tests.
Regarding
to theboth
correlation
between
the indentation
response
of
the
indentation
lowest
and
these
parameters
are
highest
in
the
curves
in
the
BM
are
lowest
and
these
parameters
are
highest
in
in
regions ofcurves
the weld,
variation
of
the indentation
curves
obtained
from
of
the
in
the
BM
and
parameters
are
the
ofdifferent
the indentation
indentation
curves
inthe
thedistinguishable
BM are
are lowest
lowest
and these
these
parameters
are highest
highest in
inthe
the
BM, HAZ,
and three
WM can
be observed
in observation
Fig. 3(d). It can
be
seen
from
this
figure
that
both
loading
WM
among
regions.
This
observation
consists
with
the
available
results
of
consists
with
the
available
results
WM
three
regions.
This
consists
with
the
available
results
of
WM among
among
three load
regions.
This observation
observation
consists
with
the
available
resultsareof
of
curvature
and
applied
of
the
indentation
curves
in
the
BM
are
lowest
and
these
parameters
indentation
of
other
structural
steels
[3,
6,
22]
and
responses
for
the
weld
zone
of
other
structural
steels
[3,
6,
22]
and
indentation
responses
for
the
of
structural
steels
and
indentation
responses
for regions.
the weld
weld
zone
of other
other
structural
steels [3,
[3, 6,
6,of22]
22]
and
highest
in the WM
among three
Thiszone
observation
consists
with the available
results
indencorresponds
to
the
lowest
hardness
and
yield
strength
in
BM
among
three
regions,
yield
strength
in
among
tation
responses
thelowest
weld zone
of other and
structural
steels
[3, 6, 22]
and
to theregions,
lowest
corresponds
to
hardness
strength
in
BM
among
three
regions,
corresponds
toforthe
the
lowest
hardness
and yield
yield
strength
in BM
BMcorresponds
among three
three
regions,
hardness and yield
strength
among three
regions, respectively, which will be discussed below.
respectively,
below.
which
willinbeBM
discussed
below.
respectively,
respectively,which
which will
will be
be discussed
discussed below.
below.
(a) (a)
(a)
(a)
(c)
(b)
(b)
(b)
(b)
(b)
(d)
(c)
(d)
(d)
(c)
(d)
(c)
(d)
−1
Figure 3. Indentation
responses
(P-h
curves)
in
(a)
BM,
(b)
HAZ,
(c)
WM
and
(d)
All
regions(c)
at εWM,
= 0.2 sand
3. Indentation responses (P-h curves)
in
(a)
BM,
(b)
HAZ,
Figure
curves)
in
(a)
BM,
(b)
HAZ,
(c)
WM,
and
Figure3.
3.Indentation
Indentation responses
responses (P-h
(P-h curves)
curves) in
in (a)
(a) BM,
BM, (b)
(b) HAZ,
HAZ, (c)
(c) WM,
WM, and
and
Figure
-1
(d) All regions
at
== 0.2
ss-1
regions
at
0.2
-1
-1
(d) All
All regions
regions
at == 0.2
0.2 ss
(d)
108 at
rate effect on mechanical properties
in
the
weld
zone
4.2.
Strain
properties
in
the
weld
zone
4.2.Strain
Strainrate
rateeffect
effect on
on mechanical
mechanical properties
properties in
in the
the weld
weld zone
zone
4.2.
Hoan, P. T., et al. / Journal of Science and Technology in Civil Engineering
4.2. Strain rate effect on mechanical properties in the weld
zone
Journal
of Science and Technology in Civil Engineering - NUCE 2019
H (MPa)
From the applied load-depth curve of indenta4000
tion test, the contact area Ac and maximum load
Pm can be easily measured and then the hardness
3500
was computed using Eq. (6). The calculated results are presented in Fig. 4 in such the way to
3000
show the change of hardness with respect to different strain rate levels in all regions of the weld as
2500
well as the distinguishable hardness values in the
BM
HAZ
WM
2000
three regions. In this figure, each presented hard0.00
0.05
0.10
0.15
0.20
ness value is the mean of 25 values obtained from
( )
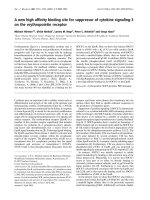
an indentation test series in individual region, toFigure
4. Strain
rate effect
hardness
the weld zone
Figure
4. Strain
rateoneffect
onofhardness
gether with the corresponding error bar of ±1 stanWhile the hardness can beofdirectly
extracted
from
indentation curve P-h, the
the weld zone
dard deviation, which are listed in Table 2. The
yield strength in the regions of the weld zone was determined using Eqs. (7) and (8),
best fit curve of the changing trend of hardnessin in
which an unknown parameter corresponding to the yielding part of the structural
each region is also accompanied.
steel’s - curve () needs to be pre-estimated for each region. The value of each
region is estimated using the results from the analysis of indentation FE simulation,
Table 2. Hardness in each region which
of weld
at in
different
are zone
detailed
previousstrain
works rate
[3, 6,levels
22]. In present work, by applying such
BM
Strain rate
0.02
0.04
0.10
0.20
∗
H (MPa)
STDEV∗ (MPa)
2950
2996
3130
3216
70
57
62
138
approach, the values at each strain rate values for BM, HAZ, and WM regions were
estimated and
the yield strength in each region of
the weld zone was extracted for
HAZ
WM
certain strain rate level. With the same illustrated way for hardness in Fig. 4, the
strength(MPa)
in each region
of the weld
zone at different
H extracted
(MPa) yield
STDEV
H (MPa)
STDEV
(MPa)values of strain
rate are presented in Fig. 5. The corresponding values in this figure are also listed in
3110
148
3380
85
Table 3 for more clarity.
3159
76
3441
74
Table 3. Yield strength in each region of weld zone at different strain rate levels
3312
44 BM
3572 HAZ 82
WM
3375
240
3680 y
153
Strain rate
STDEV*
STDEV
STDEV
y
y
(MPa)
Standard deviation
0.02
420.08
(MPa)
14.19
(MPa)
455.61
(MPa)
20.42
(MPa)
436.18
(MPa)
23.96
From Fig. 4, the effecta of strain rate on the hardness
region of465.69
weld zone7.80
are clearly
0.04 in individual
432.03
16.87
447.10
13.79
observed. The same trend is that higher strain rate0.10
level leads
to the 14.79
higher hardness
all regions
448.28
480.42 for
15.04
464.13
8.44
WM, HAZ and BM of the weld zone. This trend is0.20
recognized
that the
hardness
value 15.66
quite rapidly
461.18
11.32
495.55
474.73
18.42
increases as strain rate level increases from 0.02 s−1*Standard
to 0.04deviation
s−1 and the increment of hardness reduces
when strain rate levels change from 0.1 s−1 to 0.2
s−1Fig.
. It5,istheinteresting
to observe
that strength
the change
From
strain rate influences
on the yield
in individual region
observed.
The same
is that
higherto
strain
level leads
of hardness in individual region with respectaretoclearly
different
strain
ratetrend
levels
seem
be rate
obeyed
an to the higher
yield strength for all regions BM, HAZ and WM of the weld zone. This trend is also
exponential function, as can be seen in Fig. 4. It is also noted that the hardness in BM is lower than
the corresponding one in HAZ at a certain strain rate level, while the corresponding
hardness value in
9
WM is highest in the weld zone. These results match well with the trends reported in previous works
for the weld zone of other structural steels [3, 22].
While the hardness can be directly extracted from indentation curve P-h, the yield strength in the
regions of the weld zone was determined using Eqs. (7) and (8), in which an unknown parameter
corresponding to the yielding part of the structural steel’s σ-ε curve (α) needs to be pre-estimated for
each region. The α value of each region is estimated using the results from the analysis of indentation
FE simulation, which are detailed in previous works [3, 6, 22]. In present work, by applying such
approach, the α values at each strain rate values for BM, HAZ, and WM regions were estimated and
the yield strength in each region of the weld zone was extracted for certain strain rate level. With the
same illustrated way for hardness in Fig. 4, the extracted yield strength in each region of the weld
109
Hoan, P. T., et al. / Journal of Science and Technology in Civil Engineering
Journal
Science
and Technology in Civil
Engineering
- NUCE
2019
zone at different values of strain rate are presented in Fig.
5.ofThe
corresponding
values
in this
figure
are also listed in Table 3 for more clarity.
recognized that the increment of yield strength values when strain rate value changes
-1 different strain rate levels
Table 3. Yield strength in each region
of weld
from 0.02
s-1 tozone
0.04 sat
is greater than the increment of yield strength when strain rate
BM
Strain rate
0.02
0.04
0.10
0.20
∗
σy (MPa) STDEV∗ (MPa)
420.08
432.03
448.28
461.18
14.19
16.87
14.79
11.32
Standard deviation
value changes from 0.1 s-1 to 0.2 s-1. Similar to the hardness, the change of yield
strength in individual
HAZ region with respect to different
WMstrain rate levels seem to be
obeyed an exponential function, as can be seen in Fig. 5. Considering the correlation
σbetween
STDEV
(MPa)
y (MPa)
y (MPa)
the yield
strength(MPa)
values in σ
each
region, theSTDEV
yield strength
in BM is lowest in
the weld zone, while the yield strength in HAZ at a certain strain rate level is higher
455.61
20.42
436.18
23.96
than the corresponding one in WM. This result indicates that the chosen weld material
465.69
7.80
447.10
13.79
in this case eventhougth satify the requirements for the weld, it is still should be
480.42
15.04
464.13
chosen better in order to avoid the failure of the weld 8.44
due to the weld material.
495.55 these obtained
15.66results are consistent
474.73 with the reported
18.42 trends for the same
However,
structural steel weld zone in the previous works [3].
From Fig. 5, the strain rate influences on the
550
yield strength in individual region are clearly observed. The same trend is that higher strain rate
500
level leads to the higher yield strength for all re450
gions BM, HAZ and WM of the weld zone. This
trend is also recognized that the increment of yield
400
strength values when strain rate value changes
−1
−1
from 0.02 s to 0.04 s is greater than the inBM
WM
HAZ
350
crement of yield strength when strain rate value
0.00
0.05
0.10
0.15
0.20
0.25
( )
changes from 0.1 s−1 to 0.2 s−1 . Similar to the
hardness, the change of yield strength in individFigure 5. Strain rate effect on yield strength in the weld zone
Figure 5. Strain rate effect on yield strength
ual region with respect to different strain rate levFor the validation of reliability
and weld
accuracy
of the present results, the obtained
in the
zone
els seem to be obeyed an exponential function,
as and yield strength at a certain strain rate of 0.02 s-1 were compared with the
hardness
corresponding values in the same weld zone, which are available in the literature [3],
can be seen in Fig. 5. Considering the correlation
as listed
Table 4.
It is obvious
that hardness
andinyield
values at strain rate
between the yield strength values in each region,
theinyield
strength
in BM
is lowest
thestrength
weld zone,
of 0.02 s-1 in this work match well with corresponding reported ones [3]. The relative
while the yield strength in HAZ at a certain strain rate level is higher than the corresponding one in
error in case of hardness is within ± 3.72%, while it is even smaller in case of yield
WM. This result indicates that the chosen weld
material in this case eventhougth satify the requirestrength with the error within ± 3.25%. The observation and comparison indicates that
ments for the weld, it is still should be chosen
order
to avoid
failure
the weld due to
the better
obtainedin
results
in this
work arethe
accurate
and of
reliable.
the weld material. However, these obtained results
are
consistent
with
the
reported
trends
for the same
Table 4. Comparison of mechanical properties at strain rate of 0.02 s-1 between
structural steel weld zone in the previous works [3].
present and previous works [3]
For the validation of reliability and accuracy of the presentYield
results,
the obtained hardness Hardness
and yield
strength (MPa)
(MPa)
strength at a certain strain rate of 0.02 s−1 were compared with the corresponding values in the same
weld zone, which are available in the literature [3], as listed in Table 4. It is obvious
that hardness and
10
Table 4. Comparison of mechanical properties at strain rate of 0.02 s−1 between present and previous works [3]
BM
HAZ
WM
Yield strength (MPa)
Hardness (MPa)
Present work Previous work [3] Error %
Present work Previous work [3] Error %
420.08
455.61
436.18
426.41
470.92
434.57
−1.48
−3.25
0.37
110
2950
3110
3380
3064
3185
3475
−3.72
−2.35
−2.72
Hoan, P. T., et al. / Journal of Science and Technology in Civil Engineering
yield strength values at strain rate of 0.02 s−1 in this work match well with corresponding reported
ones [3]. The relative error in case of hardness is within ± 3.72%, while it is even smaller in case
of yield strength with the error within ± 3.25%. The observation and comparison indicates that the
obtained results in this work are accurate and reliable.
5. Conclusions
In this study, the influences of strain rate on the hardness and yield strength of a typical structural steel (SM520) weld zone was investigated using indentation. The following conclusions can be
withdrawn:
- Strain rate during influences on both the shape and magnitude of the indentation applied loaddepth curves. For all the regions in the weld, the loading curvature increase as the strain rate during
indentation increases, leading to the higher maximum applied load with the higher strain rate level
due to the applied constant maximum displacement in all the tests.
- Strain rate level has strong effect on the hardness for all regions in the weld zone. The trend is
that the hardness values quite rapidly increase as strain rate value increases from 0.02 s−1 to 0.04 s−1
and the increment of hardness reduces when strain rate value change from of 0.1 s−1 to 0.2 s−1 . The
trend seems to be obeyed an exponential function.
- Strain rate level has strong effect on the yield strength for all regions in the weld zone. The trend
is that the increment of yield strength values when strain rate value changes from 0.02 s−1 to 0.04 s−1
is greater than the increment of yield strength when strain rate value changes from 0.1 s−1 to 0.2 s−1 .
Similar to the hardness, the change of yield strength in individual region with respect to different
strain rate levels seem to be obeyed an exponential function.
In conclusion, the mechanical properties in the investigated structural steel weld zone are strongly
influenced by indentation strain rate and the relationships between hardness and yield strength with
strain rate obtained in present study provide an assessment of these mechanical properties in the weld
zone at a specific strain rate level without conducting any additional tests.
Acknowledgement
This research is funded by Vietnam National Foundation for Science and Technology Development (NAFOSTED) under grant number 107.01-2018.22.
References
[1] Pham, T.-H., Kim, J. J., Kim, S.-E. (2014). Estimation of microstructural compositions in the weld zone
of structural steel using nanoindentation. Journal of Constructional Steel Research, 99:121–128.
[2] Pham, T.-H., Kim, S.-E. (2015). Nanoindentation for investigation of microstructural compositions in
SM490 steel weld zone. Journal of Constructional Steel Research, 110:40–47.
[3] Pham, T.-H., Kim, S.-E. (2017). Characteristics of microstructural phases relevant to the mechanical
properties in structural steel weld zone studied by using indentation. Construction and Building Materials,
155:176–186.
[4] Tamboli, A. R. (1999). Handbook of structural steel connection design and details. McGraw-Hill, New
York.
[5] Bayraktar, E., Kaplan, D., Devillers, L., Chevalier, J. (2007). Grain growth mechanism during the welding
of interstitial free (IF) steels. Journal of Materials Processing Technology, 189(1-3):114–125.
111
Hoan, P. T., et al. / Journal of Science and Technology in Civil Engineering
[6] Pham, T.-H., Kim, S.-E. (2016). Microstructure evolution and mechanical properties changes in the
weld zone of a structural steel during low-cycle fatigue studied using instrumented indentation testing.
International Journal of Mechanical Sciences, 114:141–156.
[7] Boumerzoug, Z., Derfouf, C., Baudin, T. (2010). Effect of welding on microstructure and mechanical
properties of an industrial low carbon steel. Engineering, 2(07):502.
[8] Lee, C.-H., Shin, H.-S., Park, K.-T. (2012). Evaluation of high strength TMCP steel weld for use in cold
regions. Journal of Constructional Steel Research, 74:134–139.
[9] Boyer, H. E. (1990). Atlas of stress–strain curves. ASM International, Metals Park, Ohio 44073, USA.
[10] Nagarajarao, N., Lohrmann, M., Tall, L. (1966). Effect of strain rate on the yield stress of structural steel.
ASTM Journal of Materials, 1(1).
[11] Luecke, W. E., McColskey, J. D., McCowan, C. N., Banovic, S. W., Fields, R. J., Foecke, T., Siewert,
T. A., Gayle, F. W. (2005). Mechanical properties of structural steels. NIST NCSTAR1-3D.
[12] Wei, Q. (2007). Strain rate effects in the ultrafine grain and nanocrystalline regimes—influence on some
constitutive responses. Journal of Materials Science, 42(5):1709–1727.
[13] Nguyen, N.-V., Pham, T.-H., Kim, S.-E. (2018). Characterization of strain rate effects on the plastic
properties of structural steel using nanoindentation. Construction and Building Materials, 163:305–314.
[14] Nguyen, N.-V., Pham, T.-H., Kim, S.-E. (2019). Microstructure and strain rate sensitivity behavior of
SM490 structural steel weld zone investigated using indentation. Construction and Building Materials,
206:410–418.
[15] Lu, Y. C., Tandon, G. P., Putthanarat, S., Schoeppner, G. A. (2009). Nanoindentation strain rate sensitivity
of thermo-oxidized PMR-15 polyimide. Journal of Materials Science, 44(8):2119–2127.
[16] Nguyen, N.-V., Pham, T.-H., Kim, S.-E. (2019). Strain rate-dependent behaviors of mechanical properties
of structural steel investigated using indentation and finite element analysis. Mechanics of Materials, 137.
[17] Oliver, W. C., Pharr, G. M. (1992). An improved technique for determining hardness and elastic modulus
using load and displacement sensing indentation experiments. Journal of Materials Research, 7(6):1564–
1583.
[18] Pham, T.-H., Phan, Q.-M., Kim, S.-E. (2018). Identification of the plastic properties of structural steel
using spherical indentation. Materials Science and Engineering: A, 711:44–61.
[19] Antunes, J. M., Fernandes, J. V., Menezes, L. F., Chaparro, B. M. (2007). A new approach for reverse
analyses in depth-sensing indentation using numerical simulation. Acta Materialia, 55(1):69–81.
[20] Kang, J. J., Becker, A. A., Sun, W. (2012). Determining elastic–plastic properties from indentation data
obtained from finite element simulations and experimental results. International Journal of Mechanical
Sciences, 62(1):34–46.
[21] Pham, T.-H., Kim, J. J., Kim, S.-E. (2015). Estimating constitutive equation of structural steel using
indentation. International Journal of Mechanical Sciences, 90:151–161.
[22] Pham, T.-H., Kim, S.-E. (2015). Determination of mechanical properties in SM490 steel weld zone using
nanoindentation and FE analysis. Journal of Constructional Steel Research, 114:314–324.
[23] ASTM E3-01 (2007). Standard guide for preparation of metallographic specimens. ASTM International,
West Conshohocken, PA.
[24] Miller, M., Bobko, C., Vandamme, M., Ulm, F.-J. (2008). Surface roughness criteria for cement paste
nanoindentation. Cement and Concrete Research, 38(4):467–476.
[25] ASTM E2546-07 (2007). Standard practice for instrumented indentation testing. ASTM International,
West Conshohocken, PA.
112