Spectrophotometric and TLC-densitometric methods for the simultaneous determination of Ezetimibe and Atorvastatin calcium
Bạn đang xem bản rút gọn của tài liệu. Xem và tải ngay bản đầy đủ của tài liệu tại đây (585.01 KB, 9 trang )
Journal of Advanced Research (2013) 4, 51–59
Cairo University
Journal of Advanced Research
ORIGINAL ARTICLE
Spectrophotometric and TLC-densitometric methods
for the simultaneous determination of Ezetimibe
and Atorvastatin calcium
Yehia Z. Baghdady a, Medhat A. Al-Ghobashy
Soheir A. Weshahy a
b,c,*
, Abdel-Aziz E. Abdel-Aleem b,
a
Pharmaceutical Chemistry Department, Faculty of Pharmaceutical Sciences and Pharmaceutical Industries,
Future University, Cairo, Egypt
b
Analytical Chemistry Department, Faculty of Pharmacy, Cairo University, Cairo 11562, Egypt
c
Biotechnology Centre, Faculty of Pharmacy, Cairo University, Cairo, Egypt
Received 17 October 2011; revised 7 January 2012; accepted 13 January 2012
Available online 16 February 2012
KEYWORDS
Ezetimibe;
Atorvastatin calcium;
Derivative spectrophotometry;
Isosbestic spectrophotomery;
Spectrophotometry
Abstract Three sensitive methods were developed for simultaneous determination of Ezetimibe
(EZB) and Atorvastatin calcium (ATVC) in binary mixtures. First derivative (D1) spectrophotometry was employed for simultaneous determination of EZB (223.8 nm) and ATVC (233.0 nm) with a
mean percentage recovery of 100.23 ± 1.62 and 99.58 ± 0.84, respectively. Linearity ranges were
10.00–30.00 lg mLÀ1 and 10.00–35.00 lg mLÀ1, respectively. Isosbestic point (IS) spectrophotometry, in conjunction with second derivative (D2) spectrophotometry was employed for analysis of
the same mixture. Total concentration was determined at IS, 224.6 nm and 238.6 nm over a concentration range of 10.00–35.00 lg mLÀ1 and 5.00–30.00 lg mLÀ1, respectively. ATVC concentration
was determined using D2 at 313.0 nm (10.00–35.00 lg mLÀ1) with a mean recovery percentage of
99.72 ± 1.36, while EZB was determined mathematically at 224.6 nm (99.75 ± 1.43) and
* Corresponding author. Tel.: +20 0114 650 66 53.
E-mail address: (M.A. Al-Ghobashy).
2090-1232 ª 2012 Cairo University. Production and hosting by
Elsevier B.V. All rights reserved.
Peer review under responsibility of Cairo University.
doi:10.1016/j.jare.2012.01.003
Production and hosting by Elsevier
52
Y.Z. Baghdady et al.
238.6 nm (99.80 ± 0.95). TLC-densitometry was employed for the determination of the same mixture; 0.10–0.60 lg bandÀ1 for both drugs. Separation was carried out on silica gel plates using
diethyl ether–ethyl acetate (7:3 v/v). EZB and ATVC were resolved with Rf values of 0.78 and
0.13. Determination was carried out at 254.0 nm with a mean percentage recovery of
99.77 ± 1.30 and 99.86 ± 0.97, respectively. Methods were validated according to ICH guidelines
and successfully applied for analysis of bulk powder and pharmaceutical formulations. Results were
statistically compared to a reported method and no significant difference was noticed regarding
accuracy and precision.
ª 2012 Cairo University. Production and hosting by Elsevier B.V. All rights reserved.
Introduction
Ezetimibe (EZB) inhibits the absorption of cholesterol,
decreasing the delivery of intestinal cholesterol to the liver.
Atorvastatin calcium (ATVC) is a synthetic lipid-lowering
agent that inhibits ß-hydroxy-ß-methylglutaryl-coenzyme A
(HMG-CoA) reductase. Recently, a combination of EZB and
ATVC has been introduced to the market. The co-administration of both drugs offers a well-tolerated and highly efficient
treatment option for patients with dyslipidemia and helps in
prescribing a low dose ATVC, which may reduce side effects
[1]. Chemically EZB is [(3R,4S)-1-(4-fluorophenyl)-3-[(3S)-3(4-fluorophenyl)-3-hydroxypropyl]-4-(4-hydroxyphenyl)-2-azetidinone], and ATVC is [R-(R\,R\)]-2-(4-fluorophenyl)-b,
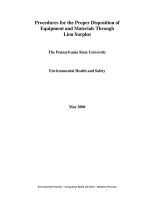
d-dihydroxy-5-(1-methylethyl)-3-phenyl-4-[(phenylamino)carbonyl]-1H-pyrrole-1 – heptanoic acid – calcium salt (2:1) trihydrate [2]. The chemical structures of ATVC and EZB are shown
in Fig. 1.
A survey of the literature revealed the following analytical
techniques concerned with the determination of EZB/ATVC
mixture. Reported spectrophotometric methods for the simultaneous determination of EZB/ATVC mixture include simultaneous equation method [3–5], dual wavelength measurement
[6], absorbance ratio method [3,7], derivative ratio method
[8,9], H-point standard addition method [9], multi-wavelength
method [10] and differential spectrophotometry [9]. Other
methods include; HPTLC [5,11–13], HPLC [4,5,8,14–19].
With the rapid increase in the number of generics in local
markets, manufacturers tend to seek for reliable analysis protocols. Such methods should meet the strict requirements of local regulatory authorities. Unfortunately, not all published
methods are reliable for this purpose. In many cases, they
are not properly validated and problems arise upon method
transfer to quality control labs. The aim of this work is the
development of orthogonal, simple, sensitive and validated
methods for the determination of EZB and ATVC in their binary mixtures and pharmaceutical preparations. Spectrophotometry and TLC-densitometry were trialled in order to
provide orthogonal results via analyse of the studied mixture
using different techniques.
Experimental
Instruments
A double beam UV–visible spectrophotometer model UV1650 PC (SHIMADZU, Japan) connected to IBM compatible
computer was used for all determinations. Hardware control
as well as data acquisition and treatment was carried out using
UV Probe software, version 2.2.1 (SHIMADZU, Japan). An
offline automatic sample applicator equipped with 100 lL syringe (Camag Linomat 5, Switzerland) and a TLC scanner (Camag, Switzerland) were employed for preparation and
measurement of TLC plates, respectively. Both of the scanner
and the densitometer were controlled using winCATS software. A UV lamp with short wavelength 254.0 nm (Vilber
Lourmat, MARN´E LA VALLEE Cedex 1, France) was used
for visualization of TLC plates.
Pure drugs and samples
EZB and ATVC pure standards were kindly supplied by Marcyrl Pharmaceutical Industries, El-Obour City, Egypt. Their
purity were found to be 99.85% and 100.35%, respectively,
according to the absorptivity values reported [4,5]. Samples
of AtorezaÒ tablets (Marcyrl); batch no. 1030599, labeled to
contain 10 mg Ezetimibe and 10 mg Atorvastatin, per tablet
were obtained from the market.
Chemicals, reagents and standard solutions
Fig. 1 Chemical structure of Ezetimibe (a) and Atorvastatin
calcium (b).
All chemicals used throughout this work were of analytical
grade, and solvents were of spectroscopic grade. TLC plates
(20 · 20 cm) pre-coated with silica gel 60F254 were obtained
from Merck, Germany. EZB and ATVC stock solutions
(1 mg mLÀ1) were prepared by weighing accurately 100 mg
of each powder into two separate 100-mL volumetric flasks.
Methanol (50 mL) was added, shaken for a few minutes and
completed to volume with the same solvent. Working solutions
(100 lg mLÀ1 in methanol) were prepared by accurately transferring 10 mL of the stock solution of EZB and 10 mL of the
stock solution of ATVC in two separate 100-mL measuring
flasks and diluting to the mark with methanol. A set of
Spectro & densito of Ezetimibe and Atorvastatin
laboratory prepared mixtures of different ratios (1:1, 1:1.5,
1.5:1, 1:2 and 2:1) were prepared by transferring different volumes of each of EZB and ATVC stock solutions into 10-ml
volumetric flasks and diluting to volume with methanol.
Procedures
Construction of calibration curve for D1 spectrophotometric
method
Different aliquots equivalent to 100.00–300.00 lg of EZB and
100.00–350.00 lg of ATVC working solutions (100 lg mLÀ1 in
methanol) were accurately transferred into a series of 10-mL
volumetric flasks then diluted to volume using methanol. D1
spectra were recorded at Dk = 4 and scaling factor = 10 using
methanol as a blank. Calibration curves were obtained by plotting the peak amplitude at 223.8 and 233.0 nm versus the corresponding concentration of EZB and ATVC, respectively.
Construction of calibration curve for D2 spectrophotometric
method
Aliquots of ATVC working solution (100 lg mLÀ1 in methanol) equivalent to 100.00–350.00 lg were accurately transferred
into a series of 10-mL volumetric flasks. The volume was completed to the mark with methanol and the D2 spectra were recorded against methanol as a blank at Dk = 8 and scaling
factor = 1000. Calibration curve was obtained by plotting
the peak amplitude at 313.0 nm (corresponding to zero-crossing of EZB) versus the corresponding concentration of ATVC.
Construction of calibration curve for IS spectrophotometric
method
Into two separate sets of 10-mL volumetric flasks, aliquots
equivalent to 100.00–350.00 lg and 50.00–300.00 lg of EZB
were transferred from their working solution (100 lg mLÀ1
in methanol) and the volume was completed with methanol.
Calibration curves were obtained by plotting the peak amplitude at 224.6 nm and 238.6 versus the corresponding concentration of EZB.
53
were spotted as bands of 6 mm width on TLC plates
(20 · 10 cm). Bands were applied at 5 mm interval and
15 mm from the bottom and sides. Linear ascending plate
development to a distance of 8 cm was performed in a suitable
chromatographic tank previously saturated for 1 h with the
developing mobile phase (diethyl ether–ethyl acetate; 7:3, v/
v) at room temperature. The peak area was recorded at a scanning wavelength of 254.0 nm. Calibration curves were constructed by plotting the integrated peak area versus the
corresponding concentrations of each drug and regression
equation parameters were computed.
Application to pharmaceutical formulations
A total of ten AtorezaÒ tablets were accurately weighed and
crushed to a fine powder. An amount equivalent to one tablet
(containing10 mg of EZB and 10 mg of ATVC) was taken, extracted using 30 mL of methanol using a magnetic stirrer for
30 min. The mixture was transferred into a 100 mL volumetric
flask through a Whatman No. 10 filter paper (pore size = 11 lm). The residue was washed twice with methanol
and the combined filtrate and washings were made up to the
mark with methanol to a final concentration of 100 lg mLÀ1
of each drug. A suitably diluted sample was measured as mentioned under each method. The possibility of interference from
dosage form additives to assay performance was investigated
using the standard addition technique.
Results and discussion
Analytical methods for the determination of binary mixture
without previous separation are of interest to quality control
(QC) labs and national regulatory authorities (NRA) around
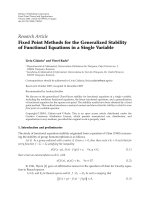
the world. The absorption spectra of EZB and ATVC show severe overlap (Fig. 2) that makes their simultaneous determination difficult. In this work, our main task was to develop
simple, sensitive and accurate analytical methods for the determination of EZB and ATVC in their binary mixture and pharmaceutical formulation with satisfactory precision for good
Optimization of TLC-densitometric separation parameters
A laboratory prepared mixture of EZB and ATVC (1:1 ratio,
0.2 lg bandÀ1) used to investigate the optimum separation
conditions. Developing systems of different composition and
ratios were tried: chloroform–ethyl acetate (8:2, v/v), chloroform–acetone (7:3, v/v), Toluene–methanol (6:4, v/v), and
diethyl ether–acetonitrile (8:2, v/v). Various band dimensions
were tested in order to obtain sharp and symmetrical peaks.
Plates were scanned at different wavelengths: 232.0 nm,
246.0 nm, and 266.0 nm) and using different slit dimensions.
Optimum set of instrumental parameters were employed for
measurement of all plates in future experiments.
Construction of calibration curve for TLC-densitometric method
For preparation of a calibration plot, 1, 2, . . . , 6 lL of standard working solutions of ATVC and EZB (100 lg mLÀ1)
Fig. 2 Zero order absorption spectra of 20 lg mLÀ1 of Ezetimibe (––), 20 lg mLÀ1 of Atorvastatin calcium (- - -) and a (1:1)
mixture contains10 lg mLÀ1 of each (Á Á Á) using methanol as a
blank.
54
Y.Z. Baghdady et al.
correlation was obtained between peak amplitude and the corresponding concentration in the range of 10.00–35.00 lg mLÀ1
for ATVC. Regression equation was computed and various
regression parameters are summarized in Table 1.
PA ¼ 0:0349C À 0:0047
r ¼ 0:9994 at 313:0 nm
where PA is peak amplitude at 313.0 nm, C is the concentration in lg mLÀ1 and r is the correlation coefficient. The proposed method is valid for determination of ATVC in presence
of EZB in different laboratory prepared mixtures with mean
percentage recoveries of 100.47 ± 1.06 as represented in Table
2. The suggested method has been applied to assay ATVC in
AtorezaÒ tablets, and its validity was further assessed by applying the standard addition technique, Table 3. The D2 method
failed to determine EZB in the presence of ATVC. Thus, total
concentration was determined using the below IS method.
Then, EZB concentration was determined mathematically.
Fig. 3 First derivative absorption spectra of 20 lg mLÀ1 of
Ezetimibe (––) and 20 lg mLÀ1 of Atorvastatin calcium (Á Á Á) using
methanol as a blank.
analytical practice (GAP).
D1 spectrophotometric method
Derivative spectrophotometry offers greater selectivity than
does normal spectrophotometry as it decreases spectral
overlap and allows better resolution. First derivative (D1)
spectrophotometric technique was used to resolve spectral
overlapping of the absorption spectra of EZB and ATVC.
Upon applying (D1) technique, EZB and ATVC could be determined by measuring peak amplitude of D1 spectra at 223.8 nm
(corresponding to zero-crossing of ATVC) and 233.0 nm
(corresponding to zero-crossing of EZB) respectively (Fig. 3).
A linear correlation was obtained between peak amplitude
and the corresponding concentration in the range of 10.00–
30.00 lg mLÀ1 for EZB and in the range of 10.00–35.00
lg mLÀ1 for ATVC. Regression equations were computed
and various regression parameters are summarized in Table 1.
PA ¼ 0:017C þ 0:0219
r ¼ 0:9995 at 223:8 nm for EZB
PA ¼ 0:006C À 0:0012
r ¼ 0:9998 at 233:0 nm for ATVC
where PA is peak amplitude, C is the concentration in
lg mLÀ1 and r is the correlation coefficient. The proposed
method was found valid for the simultaneous determination
of EZB and ATVC in different laboratory prepared mixtures
with mean percentage recoveries of 99.66 ± 1.03 and
99.39 ± 0.81, respectively, as represented in Table 2. The suggested method has been applied to assay EZB and ATVC in
AtorezaÒ tablets and its validity was further assessed by
applying the standard addition technique, Table 3.
D2 spectrophotometric method
D2 spectrophotometric technique was also used to resolve
spectral overlapping of the absorption spectra of EZB and
ATVC, Fig. 4. Upon applying D2 technique, ATVC could be
determined by measuring peak amplitude of D2 spectrum at
313.0 nm (corresponding to zero-crossing of EZB). A linear
IS spectrophotometric method
Erram and Tipnis [20] developed the isosbestic spectrophotometric method. At the isosbestic point the mixture of drugs
acts as a single component and gives the same absorbance as
pure drug. In this mixture, the absorbance value at the isosbestic points 224.6 nm (Aiso1) and 238.6 nm (Aiso2) was
determined (Fig. 2) and the total concentration of both drugs
was calculated. Since the concentration of ATVC in this mixture can be measured using D2 spectroscopy at 313.0 nm, the
concentration of EZB could be calculated by subtraction. A
linear correlation was obtained between the absorbance values
and the corresponding drug concentrations. Regression equations were computed and various regression parameters are
summarized in Table 1.
Aiso1 ¼ 0:0365C þ 0:0137
Aiso2 ¼ 0:043C þ 0:0316
r ¼ 0:9995 at 224:6 nm
r ¼ 0:9997 at 238:6 nm
where A is the absorbance, C is the total concentration of both
drugs in lg mLÀ1 and r is the correlation coefficient. The proposed methods were found valid for the determination of EZB
in laboratory prepared mixtures with mean percentage recoveries of 100.89 ± 0.89 and 100.47 ± 0.81 as represented in Table 2. The proposed methods were successfully applied for the
analysis of both drugs in pharmaceutical dosage form and the
results are shown in Table 3.
TLC-densitometric method
TLC-densitometry is a useful technique for the qualitative and
quantitative determination of drug mixtures. This technique offers a simple approach to quantify separated drugs directly on
TLC plates via measuring band optical densities. The amount
of each compound is determined by comparison to a standard
curve prepared using a reference material and chromatographed under the same condition [21]. In this work, TLC-densitometric method showed low limits of detection and
quantitation. To improve separation of bands, it was necessary
to investigate the effect of different experimental variables.
Reported TLC-densitometric methods for the simultaneous
determination of EZB/ATVC mixture employed different mobile phases [5,11–13]. Most of the reported mobile phases were
Results of assay validation parameters obtained by applying the proposed methods.
Parameter
Ezetimibe
Atorvastatin calcium
IS
D1
224.6 nm
À1
238.6 nm
À1
D1
TLC-densitometry
À1
À1
D2
TLC-densitometry
À1
Concentration range
10.00–30.00 (lg mL ) 10.00–35.00 (lg mL ) 5.00–30.00 (lg mL ) 0.10–0.60 (lg band ) 10.00–35.00 (lg mL ) 10.00–35.00 (lg mLÀ1) 0.10–0.60 (lg bandÀ1)
Linearity
Slope
Intercept
Correlation coefficient (r)
Standard error of the slope
Confidence limit of the slope
Standard error of the intercept
Confidence limit of the intercept
Accuracy (Mean ± S.D.)
0.0170
0.0219
0.9995
0.0003
0.0170 ± 0.0008
0.0057
0.0219 ± 0.0158
100.23 ± 1.62
0.0365
0.0137
0.9995
0.0006
0.0365 ± 0.0016
0.0140
0.0137 ± 0.0389
99.75 ± 1.43
0.0430
0.0316
0.9997
0.0005
0.0430 ± 0.0014
0.0095
0.0316 ± 0.0265
99.80 ± 0.95
4656.6857
À190.7733
0.9998
42.5386
4656.6857 ± 118.1060
16.5664
À190.7733 ± 45.9957
99.77 ± 1.30
0.0060
À0.0012
0.9998
0.00005
0.0060 ± 0.0002
0.0013
À0.0012 ± 0.0036
99.58 ± 0.84
0.0349
À0.0047
0.9994
0.0006
0.0349 ± 0.0017
0.0144
À0.0047 ± 0.0399
99.72 ± 1.36
5165.4857
76.7133
0.9999
33.3275
5165.4857 ± 92.5321
12.9792
76.7133 ± 36.0361
99.86 ± 0.97
Precision (RSD %)
Repeatabiltya
Intermediate precisionb
Specificity
Limit of detection (LOD)c
Limit of quantitation (LOQ)c
0.96
1.16
99.66 ± 1.03
2.70 lg mLÀ1
8.19 lg mLÀ1
0.45
1.31
100.89 ± 0.89
3.10 lg mLÀ1
9.41 lg mLÀ1
0.48
1.10
100.47 ± 0.81
1.79 lg mLÀ1
5.43 lg mLÀ1
1.00
1.40
100.25 ± 0.82
0.03 lg bandÀ1
0.09 lg bandÀ1
1.24
1.32
99.39 ± 0.81
1.75 lg mLÀ1
5.31 lg mLÀ1
1.14
1.34
100.47 ± 1.06
3.33 lg mLÀ1
10.09 lg mLÀ1
0.97
1.29
100.49 ± 0.78
0.02 lg bandÀ1
0.06 lg bandÀ1
Spectro & densito of Ezetimibe and Atorvastatin
Table 1
LOD = (SD of the response/slope) · 3.3; LOQ = (SD of the response/slope) · 10.
a
The intraday (n = 3), average of three concentrations repeated three times within day.
b
The interday (n = 3), average of three different concentrations repeated three times in three successive days.
c
Limits of detection and quantitation are determined via calculations.
55
56
Table 2
Determination of Ezetimibe and Atorvastatin calcium in laboratory prepared mixtures by the proposed spectrophotometric methods and the reported method.
Ezetimibe recovery %a
Mixture no.
Claimed taken (lg mLÀ1)
1
2
3
4
5
Mean ± S.D.
a
b
Atorvastatin calcium recovery %a
IS
Atorvastatin
Ezetimibe
D1
224.6 nm
238.6 nm
Reported methodb
D1
D2
Reported methodb
10
10
10
15
20
10
15
20
10
10
98.88
100.43
98.27
100.65
100.06
99.66 ± 1.03
99.67
101.82
101.7
100.7
100.58
100.89 ± 0.89
100.86
99.86
101.61
100.45
99.59
100.47 ± 0.81
100.85
99.91
101.68
100.1
100.57
100.62 ± 0.70
100.33
98.67
98.67
99.11
100.17
99.39 ± 0.81
98.77
100.77
101.06
100.23
101.53
100.47 ± 1.06
100.4
100.07
98.6
99.4
98.18
99.33 ± 0.94
Average of three determinations.
Absorbance ratio method (Q-analysis) at 238.6 nm (iso-absorptive point) and 232.6 nm (kmax of Ezetimibe) [3].
Table 3
Determination of Ezetimibe and Atorvastatin calcium in AtorezaÒ tablets by the proposed methods and application of standard addition technique.
D1
Product
IS
Recoverya
% ±S.D.
Added Founda Recovery %
lg mLÀ1 lg mLÀ1
Ezetimibe in
100.02 ± 1.29
AtorezaÒ tablets
5
(Batch No. 1030599).
10
15
Mean ± S.D.
5.06
9.94
15.23
TLC-densitometry
224.6 nm
238.6 nm
Recoverya % Added Founda Recovery
±S.D.
lg mLÀ1 lg mLÀ1 %
Recoverya % Added Founda Recovery % Recoverya
±S.D.
lg mLÀ1 lg mLÀ1
% ±S.D.
101.05 ± 1.63
99.03 ± 0.91
101.2
99.4
101.53
100.71 ± 1.15
8
10
12
D1
8.05
9.92
12.23
100.63
99.2
101.92
100.58 ± 1.36
100.44 ± 1.26
8
10
12
8.15
9.94
11.84
D2
0.1
0.2
0.4
0.102
0.201
0.407
102
100.5
101.75
101.42 ± 0.80
TLC-densitometry
Added
lg mLÀ1
Found
lg mLÀ1
Recovery %
Recoverya %
±S.D.
Added
lg mLÀ1
Founda
lg mLÀ1
Recovery %
Recoverya %
±S.D.
Added
lg bandÀ1
Founda
lg bandÀ1
Recovery %
Atorvastatin calcium
in AtorezaÒ tablets
(Batch No. 1030599).
Mean ± S.D.
99.48 ± 0.82
5.00
10.00
15.00
5.00
10.17
15.00
100.00
101.70
100.00
100.57 ± 0.98
100.46 ± 0.83
8.00
10.00
12.00
7.88
10.09
11.86
98.50
100.90
98.83
99.41 ± 1.30
100.14 ± 1.02
0.10
0.20
0.40
0.101
0.203
0.400
101.00
101.50
100.00
100.83 ± 0.76
Y.Z. Baghdady et al.
Recovery
% ±S.D.
Average of three determinations
a
101.88
99.4
98.67
99.98 ± 1.68
Product
a
a
Founda
Recovery %
Added
lg bandÀ1 lg bandÀ1
Spectro & densito of Ezetimibe and Atorvastatin
57
symmetrical and well resolved peaks. The optimum band
width was chosen (6 mm) and the inter-space between bands
was found to be 5 mm. Different scanning wavelengths were
tried where 254 nm was found optimum for both drugs.
Scanned peaks were sharp, symmetrical and minimum noise
was noticed. Moreover, at this wavelength maximum sensitivity was obtained for both drugs. The slit dimensions of the
scanning light beam should ensure complete coverage of band
dimensions on the scanned track without interference of adjacent bands. Different slit dimensions were tried, where
6 mm · 0.3 mm proved to be the slit dimension of choice which
provides highest sensitivity (results not shown).
Calibration curves were constructed by plotting the integrated peak area versus the corresponding concentrations in
the range of 0.10–0.60 lg bandÀ1 for both EZB and ATVC.
The concentration of EZB and ATVC were calculated from
the following regression equations. Regression equation
parameters are summarized in Table 1.
Fig. 4 Second derivative absorption spectra of 20 lg mLÀ1 of
Ezetimibe (––) and 20 lg mLÀ1 of Atorvastatin calcium (Á Á Á) using
methanol as a blank.
of relatively complex composition. When a two-component
mobile phase was employed, insufficient validation was carried
out and no system suitability data was calculated [12]. Thus the
aim of this TLC-densitometric work was to investigate the use
of new, simple, two component only mobile phase. Different
developing systems of different composition and ratios were
tried for separation and results were evaluated with respect
to efficiency of separation and the shape of separated bands.
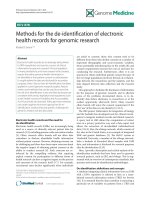
The optimum mobile phase composition was found to be
diethyl ether–ethyl acetate (7:3, v/v). This mobile phase allowed good separation between the binary mixtures with good
Rf values without tailing of the separated bands (Fig. 5). Different band dimensions were tested in order to obtain sharp,
For EZB; Y1 ¼ 4656:6857C1 À 190:7733 r1 ¼ 0:9998
For ATVC; Y2 ¼ 5165:4857C2 þ 76:7133 r2 ¼ 0:9999
where Y1 and Y2 are the integrated peak area of EZB and
ATVC, respectively, C1 and C2 are the concentration of EZB
and ATVC in lg bandÀ1, respectively, and r1 and r2 are the
correlation coefficients of EZB and ATVC, respectively.
Various validation parameters are summarized in Table 1.
The validity of the proposed methods was assessed by applying
the standard addition technique. Results obtained were reproducible with low relative standard deviation as shown in Table
3. Various separation parameters; resolution (Rs), peak symmetry, capacity factor (K0 ) and selectivity factor (a) were calculated using a (1:1) mixture contains 0.2 lg bandÀ1 of each drug
and ATVC as reference. Resolution and selectivity were found
to be 10.46 and 27.32, respectively. Peak symmetry factor was
found to be 0.71 and 0.94 while capacity factor was 10.11 and
0.37 for ATVC and EZB, respectively.
Fig. 5 Thin layer chromatogram of separated peaks of 0.2 lg bandÀ1 of Ezetimibe (a), 0.2 lg bandÀ1 of Atorvastatin calcium (b), and a
(1:1) mixture contains 0.2 lg bandÀ1 of each (c) using diethyl ether: ethyl acetate (7:3, by volume) as a mobile phase.
Y.Z. Baghdady et al.
100.01
0.99
0.99
5
0.984
Conclusion
Figures between parentheses represent the corresponding tabulated values of t and F at P = 0.05.
Absorbance ratio method (Q-analysis) (Godse et al. [3]) at 238.6 nm (iso-absorptive point) and 232.6 nm (kmax of Ezetimibe) [3].
a
b
Atorvastatin calcium
Ezetimibe
A statistical comparison of the results obtained by the three
proposed methods and the reported method [3] was carried
out. The values of the calculated t and F were found smaller
than the tabulated ones. This proved that there is no significant
difference between the proposed methods and the reported
method with respect to accuracy and precision. Results are
summarized in Table 4.
100.27
0.87
0.87
5
0.764
TLC-densitometry
100.14
1.02
1.02
5
1.044
0.204
1.06
100.46
0.83
0.83
5
0.694
0.786
1.42
Mean
S.D.
R.S.D. %
n
Variance
Student’s t-test (2.31)a
F-value (6.39)a
100.02
1.29
1.29
5
1.656
0.366
2.17
101.05
1.63
1.61
5
2.659
0.981
3.48
99.03
0.91
0.91
5
0.82
2.209
1.07
100.44
1.26
1.25
5
1.585
0.252
2.08
99.48
0.82
0.83
5
0.677
0.923
1.45
D2
224.6 nm
D1
IS
238.6 nm
TLC-densitometry
D1
Atorvastatin calcium
Reported methodb
Statistical comparison to reported method
Ezetimibe
Table 4 Statistical comparison of the results obtained by applying the proposed methods and the reported reference method for the analysis of Ezetimibe and Atorvastatin calcium in
pharmaceutical dosage form.
58
Three new selective and sensitive methods for the simultaneous
determination of EZB and ATVC were developed. The D1, D2,
IS spectrophotometric, and TLC-densitometric method were
applied for the simultaneous determination of EZB and ATVC
either in their bulk powder form or in their pharmaceutical formulations. Results demonstrated the lack of interference from
dosage form additives and the usefulness of the methods. All
methods are simple, sensitive, precise, accurate, inexpensive
and non polluting to environment. Methods are suitable for
routine quality control analysis of EZB and ATVC in pharmaceutical preparations.
References
[1] Ballantyne CM, Houri J, Notarbartolo A, Melani L, Lipka LJ,
Suresh R, et al. Effect of Ezetimibe coadministered with
atorvastatin in 628 patients with primary hypercholesterolemia: a prospective, randomized, double-blind trial.
Circulation 2003;107(19):2409–15.
[2] O’Neil MJ, Smith A, Heckelman PE, Budavari SB. Merck
Index, 14th ed. Darmstadt: Merck Sharp & Dohme Corp.; 2006.
[3] Godse VP, Deodhar MN, Bhosale AV, Sonawane RA, Sakpal
PS, Borkar DD, et al. Simultaneous spectrophotometric
estimation of Ezetimibe and atorvastatin in pharmaceutical
dosage form. Asian J Res Chem 2009;2(1):86–9.
[4] Sonawane SS, Shirkhedkar AA, Fursule RA, Surana SJ.
Application of UV-Spectrophotometry and RP-HPLC for
simultaneous determination of atorvastatin calcium and
Ezetimibe in pharmaceutical dosage form. Eurasian J Anal
Chem 2006;1(1):31–41.
[5] Rajamanickam
V,
Rajasekaran
A, Rathinaraj BS,
Anandarajagopal K. Development and validation of analytical
methods for simultaneous estimation of atorvastatin calcium
and Ezetimibe in combined dosage form. World Appl Sci J
2010;9(12):1424–9.
[6] Baldha RG, Patel Vandana B, Mayank B. Simultaneous
spectrophotometric determination of atorvastatin calcium and
Ezetimibe in tablet dosage form. Int J ChemTech Res
2009;1(2):233–6.
[7] Sonawane SS, Shirkhedkar AA, Fursule RA, Surana SJ.
Simultaneous spectrophotometric estimation of atorvastatin
calcium and Ezetimibe in tablets. Indian J Pharm Sci
2007;69(5):683–4.
[8] Patel V, Baldha R, Patel D. Simultaneous determination of
atorvastatin calcium and Ezetimibe by ratio spectra derivative
spectrophotometry and reverse phase-high performance liquid
chromatography. Asian J Chem 2010;22(4):2507–11.
[9] Maher HM, Youssef RM, Hassan EM, El Kimary EI, Barary
MA. Enhanced spectrophotometric determination of two
antihyperlipidemic
mixtures
containing
Ezetimibe
in
pharmaceutical preparations. Drug Test Anal 2010;3:97–105.
Spectro & densito of Ezetimibe and Atorvastatin
[10] Deshmukh DD, Bhatia NM, More HN, Bhatia MS.
Colorimetric estimation of Ezetimibe and simultaneous
spectrophotometric estimation of Ezetimibe with atorvastatin
calcium in tablet formulation. Asian J Chem 2008;20:
155–60.
[11] Aiyalu R, Mani K. HPTLC method development, validation,
and stress degradation studies for atorvastatin and Ezetimibe in
multicomponent tablet dosage form. Med Chem Res 2012;21(7):
1297–301.
[12] Dhaneshwar SS, Dhaneshwar SR, Deshpande P, Patil M.
Development and validation of a method for simultaneous
densitometric estimation of atorvastatin calcium and Ezetimibe
as the bulk drug and in tablet dosage forms. Acta Chromatogr
2007;19:141.
[13] Chaudhari BG, Patel NM, Shah PB, Modi KP. Development
and validation of a HPTLC method for the simultaneous
estimation of atorvastatin calcium and Ezetimibe. Indian J
Pharm Sci 2006;68(6):793–6.
[14] Sama JR, Kalakuntla RR, Rao VSN, Reddanna P.
Simultaneous estimation of atorvastatin and Ezetimibe in
pharmaceutical formulations by RP-HPLC method. Der
Pharmacia Lettre 2010;2(1):427–36.
[15] Bhatt KK, Shankar MB, Patel JB, Christian MC. Simultaneous
estimation of atorvastatin calcium and Ezetimibe in tablet by
RP-HPLC method. Int J Pharm Appl Sci 2010;1(1):114–7.
59
[16] Chaudhari BG, Patel NM, Shah PB, Patel LJ, Patel VP.
Stability-indicating reversed-phase liquid chromatographic
method for simultaneous determination of atorvastatin and
Ezetimibe from their combination drug. J AOAC Int
2007;90(6):1539–46.
[17] Seshachalam U, Kothapally CB. HPLC analysis for
simultaneous determination of atorvastatin and Ezetimibe in
pharmaceutical formulations. J Liq Chromatogr Relat Technol
2008;31(5):714–21.
[18] Qutab SS, Razzaq SN, Khan IU, Ashfaq M, Shuja ZA.
Simultaneous determination of atorvastatin calcium and
Ezetimibe in pharmaceutical formulations by liquid
chromatography. J Food Drug Anal 2007;15(2):139–44.
[19] Choudhari VP, Nikalje AP. Simultaneous estimation of
atorvastatin, Ezetimibe and fenofibrate in pharmaceutical
formulation by RP-LC-PDA. Pharm Anal Acta 2010;1(111).
doi:10.4172/2153-2435.1000111 [open access].
[20] Erram SV, Tipnis HP. Simple spectrometric analysis of
propranolol hydrochloride and hydrochlorothiazide from
combined pharmaceutical dosages. Indian Drugs 1994;31:
65–8.
[21] Grinberg N. Chromatographic science series. Modern thin-layer
chromatography, vol. 52. Marcel Dekker; 1990.