Surface and subsurface characteristics of the Çankırı Basin (Central Anatolia, Turkey): Integration of remote sensing, seismic interpretation and gravity
Bạn đang xem bản rút gọn của tài liệu. Xem và tải ngay bản đầy đủ của tài liệu tại đây (5.38 MB, 22 trang )
Turkish Journal of Earth Sciences (Turkish J. Earth Sci.), Vol. 19, 2010, pp. 79–100. Copyright ©TÜBİTAK
doi:10.3906/yer-0807-3
First published online 28 December 2009
Surface and Subsurface Characteristics of the Çankırı Basin
(Central Anatolia, Turkey): Integration of Remote Sensing,
Seismic Interpretation and Gravity
NURETDİN KAYMAKCI1, ŞENOL ÖZMUTLU2, PAUL. M. VAN DIJK3 & YAKUP ÖZÇELİK4
1
RS/GIS Labaoratory, Department of Geological Engineering, Middle East Technical University,
TR−06531 Ankara, Turkey (E-mail: )
2
Vryhof Anchors B.V. Rhijnspoor 255 2901 LB - PO Box 109 2900 AC, Capelle a/d IJssel, The Netherlands
3
4
ITC, Hengelosestr 99, P.O. B0x 6, 7500 AA Enschede, The Netherlands
Turkish Petroleum Coorporation (TPAO), Söğütözü Caddesi No: 27, Söğütözü, TR−06520 Ankara, Turkey
Received 03 July 2008; revised typescript receipt 02 March 2009; accepted 04 March 2009
Abstract: The geology of the Çankırı Basin has been studied using multi-source data including satellite images, aerial
photos, gravimetric data and seismic sections, which are subsequently used to generate maps and a 3D model of that
part of the basin covered by the seismic sections. From the compilation, three different phases of deformation are
recognized. The earliest phase is characterized by thrusting during the Early Tertiary. The second deformation phase is
characterized by extensional deformation associated with normal faulting in the latest Early Miocene to Middle
Miocene. The third, and the last, phase is characterized by compressional deformation manifested by inversion of some
of pre-existing normal structures that has been taken took place since the Late Miocene. Finally, the constructed model
and the maps helped to better understand the 3D geometry and tectono-sedimentary evolution of the Çankırı Basin
and the collisional history of the Sakarya Continent and the Kırşehir Block along the İzmir-Ankara-Erzincan Suture
Zone.
Key Words: Remote Sensing, data integration, subsurface geology, seismic interpretation, gravity, Çankırı Basin, central
Anatolia
Çankırı Havzası’nın Yüzey ve Yeraltı Jeolojisi (Orta Anadolu, Türkiye):
Uzaktan Algılama, Sismik Yorumlama ve Gravite Verilerinin Entegrasyonu
Özet: Çankırı Havzasının jeolojisi uydu görüntüleri, hava fotografları, gravite ve sismik kesitleri içeren çok kaynaklı
veri setleri kullanılarak çalışılmış ve elde edilen veriler havzanın değişik amaçlı haritaların hazırlanması ve sismik
kesitlerin kapladığı kısmının ise 3 Boyutlu modelinin oluşturulmasında kullanılmıştır. Derlenen verilerden havzanın üç
farklı evrede deformasyona uğradığı anlaşılmıştır. Erken Tersiyer dönemine tarihlenen en eski evre bindirme fayları ile
karakterizedir. Erken Miyosen sonu ile Orta Miyosen dönemine tarihlenen ikinci evre, normal faylanma ile ilişkili
genişleme tektoniği ile karakterizedir. Geç Miyosen’den itibaren etkin olan üçüncü ve son evre ise bir önceki evrede
gelişmiş normal fayların terslenmesi ile kendini gösteren, sıkıştırmalı deformasyon ile karakterizedir. Sonuç olarak,
oluşturulan model ve haritalar, havzanın 3 Boyutlu geometrisi ile tektono-stratigrafik evrimi ve İzmir-Ankara-Erzincan
Kenet Kuşağı boyunca meydana gelen Sakarya Kıtası ile Kırşehir Bloğunun çarpışma tarihçesinin daha iyi anlaşılmasını
sağlamıştır.
Anahtar Sözcükler: Uzaktan Algılama, veri entegrasyonu, yeraltı jeolojisi, sismik yorumlama, gravite, Çankırı Havzası,
Orta Anadolu
79
SURFACE AND SUBSURFACE CHARACTERISTICS OF THE ÇANKIRI BASIN
Introduction
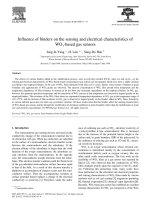
The Çankırı Basin, one of the largest Tertiary basins
in Turkey (Figure 1), has possible economic
hydrocarbon and industrial mineral (mainly
evaporatic) reserves. It lies within the İzmir-AnkaraErzincan Suture Zone (IAESZ) (Figure 1), which
demarcates the former position of the northern
branch of the Neotethys Ocean. After consumption
of Neotethys, final collision occurred along the
IAESZ, during which the Sakarya continent of the
Pontides in the north amalgamated with the Kırşehir
Block in the south (Şengör & Yılmaz 1981; Görür et
al. 1984; Robertson & Dixon 1984; Tüysüz &
Dellaloğlu 1992; Okay et al. 1998; Robertson et al.
1996; Kaymakcı 2000; Kaymakcı et al. 2000, 2003a,
b). The Çankırı Basin is a unique area in north
central Anatolia to study subduction and collision
processes owing to an almost 4-km-thick Upper
Cretaceous to recent in-fill, with only minor breaks
in sedimentation.
The number of published geological studies in the
Çankırı Basin is relatively small. This is due to
difficulty in dating continental deposits as well as the
geological complexity of the region, with a
superimposed,
multi-deformational
history.
Recently, due to advances in digital technology and
improvements in geophysical and remote sensing
methods, the number of studies in the region has
increased. For this purpose, the Turkish Petroleum
Co. (TPAO, Ankara-Turkey) shot 24 seismic lines,
which amount to nearly 1000 km in line length.
Improved gravity measurements were made available
by the General Directorate of Mineral Exploration
and Research Department (MTA, Ankara-Turkey).
The aim of this paper is to present the surface and
subsurface characteristics of the Çankırı Basin based
on satellite and airborne remote sensing, seismic
images, local gravity, and field studies in order to
understand better the subduction history of the
Neotethys and collisional and post collisional
processes along the İzmir-Ankara-Erzincan Suture
zone. The remotely sensed data, combined with field
data and the published literature, were used to obtain
an up-to-date geological map of the basin. The
seismic sections were interpreted and were used to
construct a 3D model for part of the basin. The
gravity data were used to obtain gravity anomaly
80
images that were used to validate the generated 3D
model.
Geological Background
The Çankırı Basin is located between the Sakarya
Continent in the north and the Kırşehir Block in the
south and is bounded in the west, north and east by
an ophiolitic mélange (North Anatolian Ophiolitic
Mélange, NAOM, cf. Rojay 1995), associated with
Upper Cretaceous volcano-sedimentary rock
assemblages, which collectively constitute the rim of
the basin (Figure 1). The same rock assemblages
partly underlie the infill of the Çankırı Basin in the
north, and in the south it is underlain and delimited
by the Sulakyurt granitoids, forming the
northernmost tip of the Kırşehir Block.
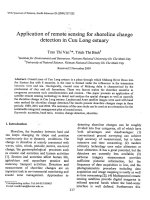
The infill of the Çankırı Basin accumulated in 5
different cycles of sedimentation (Figure 2). The
oldest cycle comprises Upper Cretaceous to
Paleocene volcaniclastic rocks (Yaylaçayı and
Yapraklı formations), regressive shallow marine
units and Paleocene mixed environment red clastics
and carbonates (Dizilitaşlar, Kavak and Badiğin
formations). In this paper, these are referred to as the
‘Upper Cretaceous units’. They are overlain by the
second cycle, which is a Paleocene to Oligocene
regressive flysch to molasse sequence referred to as
the ‘Tertiary clastics’ in this study. In it a widespread
thin (<100 m) ‘nummulitic limestone’ of Middle
Eocene age (Kocaçay Formation), that constitutes
the marker horizon in the seismic sections, passes
upwards into very thick (up to 2000 m) Middle
Eocene to Oligocene continental red clastics (İncik
Formation) interfingering with and overlain by
Oligocene evaporites (Güvendik Formation). The
third cycle is represented by fluvio-lacustrine clastics
deposited in the Early to Middle Miocene, which,
together with the Tortonian Tuğlu Formation are
referred to as the ‘Middle to Upper Miocene units’ in
this study. The fourth cycle is represented by upper
Miocene fluvio-lacustrine deposits which frequently
alternate with evaporites (Tuğlu, Süleymanlı and
Bozkır formations). Plio−Quaternary alluvial fan
deposits and recent alluvium locally overlie all these
units (Figure 2).
The structures, which have played a role in the
tectonic development of the Çankırı Basin, from
H
el
an S
nc
en
ic
e
Tr
EA
FZ
BITLIS-ZAG
RO
TU
Arabian Plate
h
RE
FZ
NA
N
LCA
NIC
40 km
ST
FZ
YF
ES
FZ
ÇANKIRI
BASIN
FZ
Z
KF
Upper Cretaceous to Paleogene units
Neogene and Quaternary cover units
ANKARA
I
ÇIL
N
HA SIN
BA
O
NV
TEACE
A
L
GA OVIN
PR
c
syncline, anticline
thrust faults
strike-slip faults
NAFZ
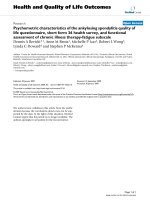
(a) Inset map showing the geological outline of Eastern Mediterranean area (modified after Şengör et al. 1984; Okay et al. 1998). Box shows the location of
the study area. (b) Active tectonic scheme of the Eastern Mediterranean area. ÇB− Çankırı Basin, DFZ− Dead Sea Fault Zone, NAFZ− North Anatolian Fault
Zone (Şengör et al. 1985; Barka 1992; Özçelik 1994; Kaymakcı 2003a). (c) Tectono-stratigraphic map of central Anatolia. ESFZ− Ezinepazarı-Sungurlu Fault
Zone, KFZ− Kızılırmak Fault Zone, YFFZ− Yağbasan-Faraşlı Fault Zone.
Sakarya Continent lithologies (Laurasia)
Kýrþehir Block lithologies (Laurasia)
b
Eurasian Plate
40°
Late Cretaceous ophiolites and ophiolitic melanges (the rim)
African Plate
Mediterranean Sea
ea
Figure 1.
ÇB
NAFZ
Black Sea
500 km
SU
34°
30°
Anatolian Block
MEDITERRANEAN SEA
42°
EURASIAN PLATE
NKAR
AAN SUTURE ZO
-A
NE
ERZÝNC
IR
M
Ý Z M E N DE R ES
K
TA
OC
UR
L
ARABIAN PLATE
IDE B
ARYA CONTINE
NT
SAK
ÇANKIRI BASIN
BLACK SEA
S
BASEMENT
DFZ
Aege
IN FILL
a
N. KAYMAKCI ET AL.
81
Tkv
Kya
Ky
GS
NAOM
Karagüney Formation (clastics derived mainly from
Tkg
the Kýrþehir Block)
Karabalçýk Formation (distributary channel
Tk
conglomerates and sandstones with coal seams)
Ty Yoncalý Formation (Eocene flysch)
Dizilitaþlar and Hacýhalil formations (mainly turbidites and
Td &Th
intercalated limestones)
Tba Badiðin Formation (neritic limestones)
Tkv Kavak Formation (red clastics and carbonates)
Gs Sulakyurt granitoids of the Kýrþehir Block
Kya Yapraklý Formation (proximal fore-arc facies)
NAOM
Yaylaçayý Formation (distal fore-arc sequence)
North Anatolian Ophiolitic Melange
Figure 2.
82
1
REGIONAL TECTONICS
ii
i
FAULTS
TRANSCURRENT
EXTENSIONAL
2
SUBDUCTION TO COLLISION
Td+Th
Tm Mahmatlar Formation (clastics derived from granitoids)
Ky
Tk
Ty
Tba
TECTONIC PHASE
Tm
STRIKE-SLIP
To
Tb
NORMAL
Tkg
Tko
THRUST/TRANSPRESSIONAL
3
THRUST
SALT DOMES
Ti
Eocene
PA L E O G E N E
MN4-6
mid-Oligocene
Paleocene
Maastrichtian
to
Campanian
LATE
CRETACEOUS
NO RECORD
Tg
Oligocene
iii
4
Ttu
Tç
COLLOQUIAL NAMES
USED IN THE
SEISMIC SECTIONS
Ts
LATE
MIOCENE
UNITS
MN 13
iv
MIDDLE MIOCENE TO
TORTONIAN UNITS
Tbo
TERTIARY
CLASTICS
MN 14
5
LATE CRETACEOUS
UNITS
Tde
MN10-12
Tf
TERTIARY
MN 17
fluvio-lacustrine
Miocene
NEOGENE
Pliocene
fluvial
Alluvium (Qal)
Quaternary
DEPOSITIONAL
CYCLE
TECTONOSTRATIGRAPHY
accretionary wedge,
regressive flysch/molasse,
arc, fore-arc deposits minor volcanics, and continental
AGE
DEPOSITIONAL
SETTING
SURFACE AND SUBSURFACE CHARACTERISTICS OF THE ÇANKIRI BASIN
Tde Deyim Formation (fluvial clastics)
Tbo Bozkýr Formation (evaporites)
Ts Süleymanlý Formation (fluvio-lacustrine red clastics)
Ttu Tuðlu Formation (evaporites and lacustrine shale/marl)
Tf
Faraþlý Basalt
Tç Çandýr Formation (fluvio-lacustrine sediments)
Tgu Guvendik Formation (evaporites)
Ti Ýncik Formation (continental red clastics)
Kocaçay Formation (Nummulitic limestone
Tko
marker horizon
Osmankahya Formation (mixed environment
To
clastics and red beds)
Bayat Formation
Formation(Eocene
(Eocene volcanics
Tb
and volcanoclastics)
Generalized tectono-stratigraphic column of the units exposed in and around the Çankırı Basin.
MN– ages of units in European mammal zones.
N. KAYMAKCI ET AL.
oldest to youngest, are: (1) Compressional faults
(thrust and reverse faults with locally considerable
amounts of strike-slip component) situated mainly
along the rim of the basin. (2) Dominantly NE−SWoriented strike-slip faults that cut the basin infill, the
basement, and the rim. These include the presently
active Sungurlu Fault Zone (a sub strand of the
Ezinepazarı-Sungurlu Fault Zone), the YağbasanFaraşlı Fault Zone and the Kızılırmak Fault Zone
(Figure 1c). (3) Other, but less pronounced
structures are normal faults concentrated mainly in
the central part of the basin and which have
displaced some of the compressional structures at
the rim (Figure 3).
The active tectonics of the Çankırı Basin area are
currently dominated by regional transcurrent
tectonics (Figure 1c), controlled by splay faults of the
North Anatolian Fault Zone (NAFZ). The NAFZ is
an approximately 1200-km-long strike-slip fault
zone that formed due northwards drift of the
Arabian Plate and its collision with the Eurasian
Plate (Şengör & Yılmaz 1981; Jackson & McKenzie
1984; Şengör et al. 1985).
Remote Sensing
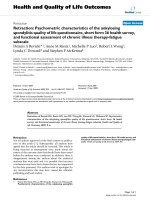
Two scenes from Landsat Thematic Mapper (TM)-5
images were used as a basis for the geological map of
the Çankırı Basin (Figures 3 & 4). The characteristics
of these images are given in Table 1. Before the
images were processed, a radiometric enhancement
(Lavreau 1992; Richard 1993) was carried out and
then they were mosaiced. Subsequently, the portion
of the image covering the Çankırı Basin was
extracted from the mosaic for further analysis.
A number of different image enhancement
techniques were performed to differentiate and map
each lithostratigraphic unit and to delineate the
geological structures. These techniques include
simple linear contrast enhancement, decorrelation
stretch enhancement (Soha & Schwartz 1978;
Gillespie et al. 1986), Intensity-Hue-Saturation
enhancement (Hayden 1982; Daily 1983; Grasso
1993) and Principal Component Analysis (Taylor
1974; Chavez & Kwarteng 1989). Since each
technique has its own strengths and weaknesses, they
could only enhance certain types of geological units
and none of the techniques had the ability to
discriminate all of the lithological units and
structures in one scene. Therefore, during
interpretation,
all
the
above-mentioned
enhancements were used to identify the units and
structures in a GIS medium. However, decorrelation
stretching technique with band combination of Red:
5, Green: 3, and Blue: 1 produced the optimum
enhanced image to show most of the structures and
almost all units. Therefore, final interpretation and
tracing of the boundaries and plotting of structures
were performed on this image while the other
processed images were used in support. The image
and the resultant map are presented in Figures 3 and
4.
Image Interpretation
The interpretation of the images and the aerial
photos was performed in three successive steps. In
the first step before fieldwork, published maps were
used to support interpretation (Akyürek et al. 1980;
Dellaloğlu et al. 1992; Özçelik & Savun 1993; Özçelik
1994). The resulting interpreted map was verified
during field studies. In areas where sufficient
resolution could not be achieved, due to the small
scale of the structures and/or the intensity of the
deformation, field mapping was performed using
1:25.000 scale topographical maps. Then the images
were re-interpreted and verified in the successive
fieldwork seasons. This procedure (Figure 5) was
repeated four times and verified in the field until a
final map was produced. In the final map (Figure 4),
the formation boundaries, faults, folds and the
photo-lineaments (O’Leary et al. 1976) were traced
using on-screen digitizing directly onto the image
using advanced cartographic techniques. Hardcopies
were only utilized during field verification.
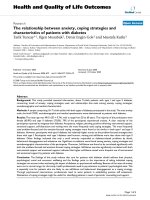
Using remote sensing and field data, twenty-eight
formations, plus the alluvium, were recognized and
mapped (Figure 4). Six of these formations are
recognized for the first time in this study. These are,
in stratigraphic order, upper Cretaceous quartz-latite
member of the NAOM, upper Cretaceous to
Paleocene Kavak and Badiğin formations, the
Middle Eocene to Oligocene İncik Formation, which
was separated into two units (Ti1 and Ti2) although
83
SURFACE AND SUBSURFACE CHARACTERISTICS OF THE ÇANKIRI BASIN
BADÝÐÝN
HACIHALÝL
YAPRAKLI
ÝSKÝLÝP
BAYAT
ÇANKIRI
TUÐLU
HANCILI
KIZILIRMAK
SUNGURLU
SULAKYURT
KALECÝK
SARIYAKA
KIRIKKALE
Figure 3.
syncline
reverse and thrust faults
anticline
transpressional/transtensional and strike-slip faults
overturne syncline
normal faults
overturned anticline
photolineaments
(a) Decorrelation stretching enhancement applied Landsat TM-4 Image of the study area (RGB: 5, 3, 1). Major faults,
folds and photo-lineaments are overlaid on the image.
in the field they could not be differentiated clearly,
the Oligocene Güvendik Formation and Tortonian
Tuğlu Formation, which had previously been
mapped as a single unit. In addition, the Kılçak,
84
Altıntaş, Hancılı, and Çandır formations, which were
partly recognized by previous researchers, have been
separated and mapped out for the first time in this
study.
16
KIRIKKALE
SULAKYURT
ÇANKIRI
KIZILIRMAK
Geological map of the Çankırı Basin.
kilometre
Figure 4.
N
TUÐLU
BAYAT
ÝSKÝLÝP
SUNGURLU
HACIHALÝL
C O N T I N E N TA L
Early to Middle Miocene
BASEMENT
M A I N LY M A R I N E
N. KAYMAKCI ET AL.
85
Late Miocene
SURFACE AND SUBSURFACE CHARACTERISTICS OF THE ÇANKIRI BASIN
Table 1. Specifications of the images used in this study.
IMAGE
LANDSAT TM-5
Path/row
Date
176/32 and 177/32
17 August 1991 and
01 September 1984
2
10800km
Area covered (x,y)
Coordinates of studied portion (UTM ZONE 36)
Upper left corner x
Upper left corner y
Lower right corner x
Lower right corner y
523298
4523570
630518
4422840
Aerial Photos
Colour
Date
Scale
Black and white
1963-1974
1:60.000 full coverage
1:35.000 partial coverage
(mainly basin margins are covered)
Lineament Analysis
Photo-lineaments are defined as simple or composite
linear features on the earth’s surface which can be
recognized on maps or on satellite images, must be
mappable for at least a few kilometres length and
which have a rectilinear or slightly curvilinear
geometry and presumably reflect subsurface
phenomena (O’Leary et al. 1976; Park & Jaroszewski
1994). These lineaments (Figure 6) were categorized
into two classes based on their quality. Only those
with appreciable offset are classified as ‘faults’ and
were analyzed together with the faults that are
verified in the field (see Kaymakcı et al. 2000, 2003a).
The others are classified as photo-lineaments. In the
analyses, the Çankırı Basin was divided into 11 subareas (Figure 6), based on variation in structural
trends and the geometry of the basin rim. For each
sub-area, length weighted rose diagrams for the
faults and the photo lineaments were prepared and
compared.
Spatial Characteristics of the Lineaments
Apart from the differences in the orientations of the
lineaments, there is also a difference in their
distribution in the study area. The lineaments are
concentrated mainly in the rim of the basin and in
86
the pre-Neogene units. The southern sub-areas (sub
areas 3, 4, 5 and 9) have the highest frequency of
faults, while the western sub-areas (sub areas 1 to 3)
have the highest frequency of photo-lineaments
(Tables 2 & 3). Sub-area 7 has the least frequency of
faults, and, considering its size, the photo-lineaments
are also fewer than in other parts of the Çankırı
Basin (Figure 6).
Tectonic Implications of the Lineaments
The domination of the lineaments within the preNeogene units may indicate that these units were
subjected to deformation phases (Kaymakcı et al.
2000, 2003a) that did not affect the Neogene units. It
is obvious that the younger rocks are exposed to
fewer deformation phases, as in sub-area 7 where
mainly Late Miocene formations are exposed.
The rose diagrams prepared for all the faults and
for the photo-lineaments display a Riedel geometric
pattern (Figure 9b) in which all components of the
Riedel shears are developed and displayed. In this
pattern the Sungurlu, Kızılırmak, and YağbasanFaraşlı fault zones constitute the y-shears. The
Eldivan Fault Zone (EFZ), which defines the western
margin of the Çankırı Basin (sub-areas 1−3), is
almost parallel to the orientation of the expected
compressional structures (f in Figure 7) in a Riedel
system, although, it slightly deviates from it
(approximately 15° anticlockwise).
Gravity
The gravity data from the Çankırı Basin and adjacent
areas was obtained from MTA (General Directorate
of Mineral Exploration and Research (MTA),
Ankara-Tukey). The data set has a 2*2 km average
sample interval. It was gridded using the
conventional Krigging method. The resulting image
of the processed gravity data is illustrated in Figure 8.
In the processed gravity image, the rim of the
basin, the granitoids of the Kırşehir Block, and two
buried (blind) thrust belts (discussed below; one in
the central northern part and one in the eastern
margin), are expressed respectively as a positive
anomaly with respect to the basin in-fill (Figure 8).
In addition, a NE−SW-trending fault that dextrally
displaces the northern margin of the Çankırı Basin is
N. KAYMAKCI ET AL.
GEOGRAPHIC INFORMATION SYSTEMS
various PC and UNIX based softwares
LANDSAT
1. image rectification
georefencing
haze correction
AERIAL PHOTOS
PUBLISHED MAPS
1:60.000 & 1:35.000 scale
1:100.000 (i, ii, iii)
1: 50.000 (ii, iii)
1:25.000 (ii, iii)
2. image processing/enhancement
simple contrast stretching
principal component analysis
de-correlation stretching
IMAGES
1:100.000 (optimum) scale
VISUAL INTERPRETATION
1. lithological discrimination
- stratigraphic
- petrographic
- lithological boundaries
2. structural maps
- faults
- folds
- lineaments
FIELD STUDIES
GEOLOGICAL MAP
of the Çankýrý Basin
1. verification of
lithological and
structural interpretations
2. data collection
- fault-slip analysis
- sedimentological
- stratigraphical/palaeontological
- palaeomagnetical
published maps: i. Dellaloðlu et al. (1992), ii. Akyürek et al. (1980), iii. Özçelik & Savun (1993)
Figure 5.
Flow chart illustrating the steps followed in production of the geological map of the study area. Numbers iiii indicate the references of the published maps. (i) Dellaloğlu et al. (1992), (ii) Akyűrek et al. (1980), (iii)
Őzçelik & Savun (1993).
recognized. This fault is seen only in the preNeogene units (Figures 4 & 6) but can be traced
below the cover of Neogene units for a considerable
distance (approximately 30 km) on the processed
gravity image. In the southern part of the basin, the
Yağbasan-Faraşlı Fault Zone and the main strand of
the Sungurlu Fault Zone (YFFZ and MSFZ,
respectively) are delineated on the gravity image
(Figure 8). Pseudo-stereo shaded relief images
facilitate 3-D visualization of thickness variation of
the infill and help the identification of the structures,
chiefly including the outline of the rim, the
87
Figure 6.
q
a
4
YAÐ
7
Z ONE
BASA
8
FA
5
ULT
I FA
L
Þ
ARA
N-F
Z
KI
M
R
ILI
AK
e
Area 5
f
area 9
11
g
AU
UF
NE
ZO
NE
O
TZ
UL
L
PE FAULT
UR
RÝTE
G
N
SÝV
U
OF THE S
RAND
T
S
TER
M AS
Area 4
3
2
1
6
LT
9
Area 10
NE
ZO
10
i
Area 11
Areas 9,10
Areas 6,11
Areas 7,8
Area 8
Area 7
j
k
m
p
o
n
Lineament map of the study area. (e−w) rose diagrams for each selected subarea and combinations. The upper quadrants of the rose diagrams display the fault
classes and lower quadrants display the photo-lineament classes (see Tables 2 & 3 for the frequencies).
WHOLE DATA
Areas 3,4,5,9
d
Area 3
h
Area 1
Area 2
Areas 1,2,3
c
b
Area 6
Z O
N E
F A
U L
T
88
E L D Ý V A N
l
SURFACE AND SUBSURFACE CHARACTERISTICS OF THE ÇANKIRI BASIN
N. KAYMAKCI ET AL.
Table 2. Percentages of the faults in the subareas.
west
Area
80-89
W
1
2
3
4
5
6
7
8
9
10
11
1,2,3
3,4,5,9
9,10,
6.11
7.8
0
0
0
0
5.405
6.667
0
0
0
0
0
0
1.389
0
2.597
0
3
4
5
0
0
3
2
0
0
6
3
3
0
2
3
1
1
7
0
2
0
2
0
0
0
0
5
3
0
0
4
0
1
4
0
0
0
5
0
5
0
4
2
2
0
1
3
2
east
3
4
5
2
0
0
6
0
1
0
1
3
1
1
1
3
0
0
0
0
5
0
5
2
4
0
4
0
3
3
3
3
3
0
0
0
3
0
8
2
1
0
2
2
1
1
1
5
0
0
0
2
1
0
6
3
0
6
2
0
1
2
1
5
0-9
W
1-10
E
2.86
0
4.76
0
0
6.67
3.17
9.68
0
3.92
6.38
2.52
0.35
1.03
6.49
6.4
17.1
10.7
0
4.08
0
0
0
1.61
1.39
0
2.13
12.6
1.39
1.03
1.3
0.8
81-90 Total
E
Length
23
25
0
2
0
0
5
6
4
6
2
19
2
5
1
6
14
18
0
0
3
0
0
42
13
16
1
13
7
13
1
21
6
4
5
2
0
3
3
3
15
27
2
5
8
18
3
3
14
7
10
4
9
22
8
5
28
0
3
12
18
21
10
6
4.3
0
24
10
15
30
21
18
6.9
9.8
11
6.7
11
7.7
18
19
7.1
18
48
4.1
30
8.3
25
3.2
20
5.9
28
17
22
16
20
14
0
0
0
61
18
5
8
0
6
14
14
0
18
8
10
4
0
0
0
6.12
10.8
8.33
0
0
0
1.96
10.6
0
3.82
0.51
9.74
0
9.78
3.91
2.93
6.84
10.34
8.38
8.80
8.66
20.11
7.12
13.13
16.62
40.22
27.23
21.51
17.46
Bulk= 28.81
Table 3. Percentages of the photo-lineaments in the subareas.
west
Area
80-89
W
1
2
3
4
5
6
7
8
9
10
11
1,2,3
3,4,5,9
9,10,
6.11
7.8
1
0
4.8544
0
5.8824
0
2.3121
1.9417
0
0
5.0691
1.4327
2.6634
0
2.6895
2.1739
0
0
0
0
0
0
0
0
0
0
2
0
0
0
1
0
1.4
8.4
0
2.9
0
0
1.2
0
0
0
1.4
2.1
0.7
0
0.7
0.7
1
2
0
1
0
2
3
0
0
0
1
1
0
0
1
2
east
2 3 3.6
8 1 0
2 1 0
0 4 8.7
3 0 0
0 0 0
9 10 12
2 3 2.9
3 0 4.8
0 6 10
2 5 8.8
3 2 2.6
2 1 3.4
2 3 7.2
1 3 4.6
7 8 8.7
1
0
2
2
0
0
1
3
6
4
4
1
2
5
2
2
0-9
W
1-10
E
0.6
0
0
0
0
0
0
4.854
2.885
0
0.922
0.43
0.726
1.657
0.489
1.812
3.4
5.263
9.709
3.846
0.98
0
2.312
0
4.808
3.896
2.765
4.585
4.843
4.42
1.467
1.449
81-90 Total
E
Length
13
3
6
6
3
11
9
1
9
18
3
10
6
13
7
6
7
7
15
6
6
1
22
16
15
14
13
8
10
15
7
20
8.4
6.3
7.8
11
12
19
12
7.8
22
23
8.3
8
13
23
13
10
6
15
5
7
12
36
3
14
18
3
7
7
10
12
21
7
16
25
19
2.9
6.9
22
0.6
23
1.9
7.8
15
17
7.7
4.4
18
9.1
19.2
13.7
27.2
25
5.88
8.33
9.25
11.7
10.6
6.49
11.1
19.6
17.2
8.84
9.78
10.1
14
4
1
10
41
0
0
10
0
0
7
10
13
0
4
4
0
0
0
11.54
3.922
1.042
2.312
0
1.923
2.597
0.922
0
4.358
2.21
0.978
1.449
28.25
5.37
5.82
5.88
5.76
10.85
9.77
5.82
5.88
4.35
12.26
39.44
23.33
10.23
23.11
15.59
Bulk= 71.19
89
SURFACE AND SUBSURFACE CHARACTERISTICS OF THE ÇANKIRI BASIN
N
W
E
S
Figure 7.
(a) Figure illustrating Andersonian geometric relationship between principal
stresses (σ1−σ3) for brittle faults and the dihedral angle between the faults that
would develop under the indicated stress orientations (σ2 is perpendicular to
the plane of the figure), (b) Riedel pattern of deformation applied to the
Çankırı Basin and respective stress orientations (model is adopted from
Bartlett et al. 1981; Sylvester 1988; Dresen 1991). These are not listed in
reference list. Note the angle between the Eldivan Fault Zone (EFZ) and the σ1.
f− folds and high angle thrust faults, p− secondary synthetic shear, r− synthetic
shear, r’− antithetic shear, t− extension structures, y− principal displacement
zone.
Yağbasan-Faraşlı Fault Zone (YFFZ), the master
strand of the Sungurlu Fault Zone (MSFZ) and a
basement step in the Eastern Margin of the Kırşehir
Block (Figure 8b, c). The basin fill was found to be
the thickest along a NE-trending belt in the
northeastern part of the basin. In addition, it was
observed that the eastern boundary of the Kırşehir
Block is a steeply dipping discontinuity, which we
interpreted as a normal fault on the seismic sections.
Three Dimensional (3D) Volume Model
Introduction
3D modelling characterizes the subsurface geology
in three dimensions. The process consists of
90
identification of geological entities (i.e. formation
boundaries, unconformities, faults, etc.) and their
interpolation. The flexibility and 3D visualization
capabilities of the interface allow the interpreter to
visually analyze data in any direction and decide on
the continuity and extrapolation of geological units
and discontinuities in 3D. This in turn improves the
interpretation of geological features in 3D in the area
of interest. In this study, the geometrical
functionality of the LYNX software (Lynx
Geosystems Incorporation 1997) was used. The
geometrical modelling can simply be defined as the
definition and interpretation of the boundaries of
geological objects.
N. KAYMAKCI ET AL.
a
c
n
Yo
rn
the
r
No
lt
au
F
alý
Çankýrý
elt
tB
rus
Th
ak
rm
ýzýlý
one
tZ
aul
F
K
Eastern T
u st
hr
n
Yaðbasa
lý
F a r aþ
ne
Fault Zo
b
e
on
tZ
aul
F
d
u
url stran
g
n
Su ster
ma
B e lt
Kýrþehir
Block
c
Ç
Figure 8.
(a) Gravity image of the study area obtained from gridding using Krigging of 2*2 km gravity data. Ç− Çankırı. (b, c)
Pseudo-stereo pair of the shaded relief images of the gravity data. The blue indicates areas where the sediment
thickness is the thickest.
91
SURFACE AND SUBSURFACE CHARACTERISTICS OF THE ÇANKIRI BASIN
Methodology
Results
The data available for 3D modelling consists of
geological cross-sections based on 2D seismic
sections and geological map. The seismic sections
were acquired in three periods between 1988 and
1996 and were processed, stacked and interpreted by
the TPAO-Exploration Department (Ankara,
Turkey). Unfortunately, no depth conversion was
possible due to insufficient borehole information.
The orientations of the seismic lines are given in
Figure 9a.
In the seismic sections, 9 different rock packages
were identified (Figure 10a) namely, from older to
younger: (1) lithologies of the Kırşehir Block and the
upper Cretaceous to Paleocene units (here referred
to as ‘upper Cretaceous units’); (2) ‘Tertiary clastics’;
(3) an lower to Middle Eocene nummulitic limestone
marker horizon (Kocaçay Formation); (4) ‘salt
domes’ including adjacent deformed rocks; (5, 6) the
very thick Middle Eocene to Oligocene ‘İncik
Formation’ is differentiated into two sub units,
namely a lower and upper unit; (7) Oligocene
‘Güvendik Formation’; (8) ‘Middle Miocene to
Tortonian’ units (Çandır-Tç and Tuğlu-Ttu
formations); (9) ‘Late Miocene units’ (Süleymanlı
and
Bozkır
formations)
together
with
Plio−Quaternary units including alluvium. In
addition, in the lower parts of some of the seismic
sections, a very distinct reflection horizon was
observed (indicated with arrow in Figure 10a).
However, this reflector could not be correlated with
any exposed lithologies or bore-hole data from the
Çankırı Basin. In addition, the interface between the
northern tip of the Kırşehir Block and the Late
Cretaceous units was not distinguishable (indicated
with ‘?’ in the Figure 10a). This might indicate that
the Kırşehir Block extends further to the north
beyond the seismic coverage area or, due to seismic
attenuation, the interface is obscured.
Interpretations of the seismic sections were done
manually, that is visual interpretation directly from
the hard-copies, on the time sections. The
interpreted sections were then correlated with the
geological map to identify the litho-stratigraphic
units. The boundaries of exposed units on the map
were extrapolated in the seismic sections and these
were subsequently re-interpreted. The final
interpretations were digitized using a Calcomp ISOA0-sized tablet digitizer. The digitized sections were
subsequently introduced to the LYNX-software and
georeferenced. In order to generate 3D model of the
area of interest, regularly spaced parallel sections are
required (Figure 9). To do this, volume models with
a finite lateral extent were generated for each of the
seismic section independently (Figure 10). These
volume models were then projected onto the plane of
the intermediate section. For the construction of
each intermediate section, the volume models of the
closest seismic sections were used (Figure 9). In the
next intermediate section, the volume model of the
previous seismic sections, the first developed
intermediate section and the next seismic sections
were projected on to the active visualization panel.
After this, the next intermediate section was
interpreted and used to improve the previous
intermediate sections. Transverse sections were then
generated and used to improve the interpretation of
the previous intermediate sections. This procedure
was repeated iteratively until the final regularly
spaced mesh of fence diagrams of the region was
generated (Figures 10 & 12). Finally, a number of
depth maps were derived at 3.50s (second), 2.25s,
and 0.50s time levels (Figure 11) for comparison with
the surface geological map and the gravity anomaly
map.
92
The most spectacular structures in the seismic
sections are the northern and eastern fold and thrust
belts, a step (normal fault) in the eastern margin of
the Kırşehir Block, salt domes, and the normal faults
mainly in the sedimentary sequences on the Kırşehir
Block which could be continued into the block
(Figures 11 & 12).
The Çankırı Basin is floored by the NAOM and
associated Upper Cretaceous units. Almost all lower
Tertiary and Neogene units (Figure 2) display a
wedge-like geometry thinning from north to south
and from east to west (Figures 10 & 12b, c) and they
are onlapping on the Kırşehir Block (Figure 13). The
basin fill was found to be the thickest in the NE part
of the basin (Figures 8, 10 & 12).
The youngest unit affected by the thrust faults is
the Oligocene Güvendik Formation (Figure 10b),
N. KAYMAKCI ET AL.
1 2
1
a
4
b
seismic sections
Figure 9.
3
c
intermediate section
lines of projection
d
(a) Orientations of the seismic sections; arrows are the orientations of the intermediate sections that are used to
generation of the fence diagram of the part of the Çankı Basin. (b−c) Procedure followed in construction of
intermediate sections. After the first intermediate section is produced using the closest seismic sections (b), then the
next section is produced using another set closest to the second intermediate section. The previous seismic and
intermediate sections including the transverse sections, produced with the same procedure (3−4 in c), are also used
to smooth-out the previous sections, (d) final orientations of the intermediate sections.
which indicates that thrusting lasted at least until the
Oligocene. These thrust faults were displaced by a
number of normal faults oriented in various
directions, namely NE−SW to NNE−SSW (Figures
10b & 12a, b). The eastern thrust belt is oriented
parallel to a basement step of the Kırşehir Block,
which may account for the accretion of these thrust
sheets in this part of the basin (Figure 10b). The
northern thrust faults have displaced the Middle
Eocene to Oligocene İncik Formation and have
affected the Middle to Upper Miocene units,
resulting in folding at the tip lines of the faults
(Çandır, Tuğlu, Süleymanlı, and Bozkır formations,
Figure 2). The concentration of thrust faults and
accretion of thrust sheets in the northern part of the
basin may indicate indirectly that accretion is
affected by a ramp formed at the northern tip of the
Kırşehir Block. Unfortunately, its exact position
could not be identified in the seismic sections.
The salt domes concentrate along a NNE−SSW
line in the east central part of the model. Most of the
salt domes arise from the top of the Early to Middle
Eocene Kocaçay Formation (Tko, Figures 10 & 12)
and affect Middle Miocene to Tortonian units
(Figure 11), indicating that they were mobilized in
post-Middle Eocene to Tortonian times.
Normal faults observed within the Middle
Miocene to Tortonian units (Tç and Ttu) have the
characteristics of dominant growth faults with
thicker sediments on the downthrown side and
thinner sediments on the upthrown side. Some of
these normal faults display typical inversion
structures (McClay 1989) (Figures 12c & 13).
93
SURFACE AND SUBSURFACE CHARACTERISTICS OF THE ÇANKIRI BASIN
NNE
SSW
Time
(second)
1
2
3
a
?
4
S
b
W
E
N
W
S
E
N
c
lower part of the
Ýncik Formation
salt bodies
Kocaçay Formation
thrust and reverse faults
normal faults
Upper Miocene untis
(Süleymanlý & Bozkýr formations)
Middle Miocene to Tortonian units
(Çandýr Formation)
Lower Tertiary clastics
Güvendik Formation
Upper Cretaceous units
upper part of the Ýncik Formation
Figure 10. 3D models of the study area. (a) NNE−SSW cross-section obtained from
the 3D model. Arrow shows the interface of a seismically distinct level
within the basement. (b) E−W-trending fence diagrams of the basin that
illustrate the mainly approximately N−S- oriented structures, (c) a
complete fence diagram of the 3D model.
94
Figure 11. Time sections produced from the 3D model.
(c) 0.5 second section
(b) 2.25 second section
(a) 3.50 second section
N. KAYMAKCI ET AL.
95
SURFACE AND SUBSURFACE CHARACTERISTICS OF THE ÇANKIRI BASIN
W
S
a
N
E
BAS
EME
NT S
N T
ER US
H
R
RT TH
O
N D
AN
LD
FO
LD LT
FO BE
N ST
ER U
ST HR
EA D T
AN
W
S
N
TEP
LT
BE
c
b
E
normal faults
thrust and reverse faults
Upper Miocene untis
(Süleymanlý & Bozkýr formations)
Middle Miocene to Tortonian units
(Çandýr Formation)
Güvendik Formation
upper part of the Ýncik Formation
lower part of the Ýncik Formation
salt bodies
Kocaçay Formation
Lower Tertiary clastics
Upper Cretaceous units
Figure 12. Fence diagrams of the 3D model area. The units above the Kocaçay Formation are stripped off.
Note two thrust belts: one in the north and the other in the east. Note also the basement step,
which is a normal fault in the eastern part of the Kırşehir Block (a). Note also that the thrust
faults (b) are displaced by a number of faults with normal off-set. These faults, in the seismic
sections, appeared to be normal in nature however it does not exclude lateral movements which
are actually observed on the surface. (c) Normal and reverse faults observed in the basement.
Most of these reversed inverted growth faults. Examples are indicated with ‘i’ (see also Figures
12 & 13). (c) Blow-up image of the faults developed on the basement (look to NE).
96
N. KAYMAKCI ET AL.
from surface to the bottom of the seismic sections
and their 3-D geometry was constructed in the
volume models.
The wedge-like geometry of the lower Tertiary
units indicates an asymmetry of the basin filling
processes. On lap patterns in the sediments on the
Kırşehir Block indicate migration of the depocenter
towards the Kırşehir Block (Figure 13), which, in
combination with their regressive character, syndeformational geometries and provenance
(discussed in Kaymakcı 2000) indicates that they
were deposited during the development of the thrust
belts.
Figure 13. The original (a) and interpreted NNW−SSEoriented seismic section (b). Note that there is no
thickening in the downthrown sides of the normal
faults for the İncik Formation, while it is apparent for
Middle Miocene to Tortonian units. Note also
inverted nature of some these normal faults. Tko−
Kocaçay Formation.
Discussion and Conclusions
29 lithostratigraphical units, 3 different deformation
phases and related structures, 9 previously
unrecognized and unmapped units were recognized
and mapped in this study. In addition, the geological
map, time section maps obtained from the 3D
volume model and the images obtained from gravity
data were integrated in a GIS and the results
presented as different data layers. Overlaying the
gravity map and the time sections allowed
recognition of the vertical continuation and of the
geometries of most of the units and the structures
developed in the basin and on the Kırşehir Block. In
addition, NE−SW-oriented faults, which are the
vertical continuation of the Kızılırmak and
Yağbasan-Faraşlı fault zones, were clearly traced
In the overlay map produced from the processed
gravity data and the 3.50s time section map, the
basin in-fill and the positive gravity anomalies fit
perfectly with each other (Figure 11a). In addition,
the salt bodies, especially in the northeastern part of
the area, correspond to a gravity low. The relatively
high NE−SW-trending gravity anomaly in the
northern part of the Çankırı Basin corresponds to
the northern thrust belt. The dextrally displaced
gravity high in the southernmost part of the model
area corresponds to the Yağbasan-Faraşlı Fault Zone
(YFFZ in Figures 1c & 4), which is also recognized in
the time sections (Figure 11).
The displacement of the thrust faults by normal
faults and inversion of these normal faults indicates
that the Çankırı Basin evolved during at least three
different phases of deformation from Early Tertiary
to recent. The earliest deformation phase is
characterized by compressional thrusting from Late
Paleocene to pre-Early to Middle Miocene time (preBurdigalian). This phase corresponds to deformation
phase 2, discussed in Kaymakcı et al. (2001a, b,
2003a). The displacement of these thrust faults by
normal faults indicates that the compressional
deformation phase was followed by an extensional
deformation phase. Inversion of the normal faults
indicates a possible phase of compressional
deformation after the extensional phase. Each of
these deformation phases has been discussed in
more detail in Kaymakcı et al. (2000, 2001b, 2003a).
Finally, integration of satellite and airborne
remote sensing data, seismic sections, gravity and
97
98
Çankýrý
F
YO
c
ETB
Figure 14. Overlay maps of gravity image and the time section maps (see Figure 11). Note the coincidence of outline of the Kırşehir Block (granitoids) in the
gravity image and the 3.50s map (a). Note also, alignment and positions of the salt bodies (a, b).
b
a
SURFACE AND SUBSURFACE CHARACTERISTICS OF THE ÇANKIRI BASIN
N. KAYMAKCI ET AL.
field data facilitated construction of 3D model of the
Çankırı Basin in order to better understand its 3D
geometry and tectonosedimentary evolution and, in
turn, the collisional history of the Sakarya Continent
and the Kırşehir Block along the Izmir-AnkaraErzincan Suture Zone.
Acknowledgements
We would like to Robert Hack for his help during the
generation of 3D volumes. Dick Nieuwland critically
reviewed and improved the manuscript. Turkish
Petroleum Co. (TAPO) provided the seismic sections
and supported field studies. John A. Winchester
edited English of the final text.
References
AKYÜREK, B., BİLGİNER, E., ÇATAL, E., DAĞER, Z., SOYSAL, Y. & SUNU,
O. 1980. Eldivan-Şabanőzű (Çankırı)-Hasayaz-Çandır
(Kalecik-Ankara) dolayının Jeolojisi [Geology of EldivanŞabanőzű (Çankırı)-Hasayaz-Çandır (Kalecik-Ankara)
Region]. Mineral Research and Exploration Institute (MTA) of
Tukey Report no. 6741 [in Turkish, unpublished].
HAYDEN, R. 1982. The application of a colour transformation for the
enhancement of multispectral images and for the combination
of multispectral data. Summaries: International Symposium on
‘Remote Sensing of the Environment, Remote Sensing of Arid
and Semi-Arid Lands, 3−9 November Cairo, Egypt, p. 78.
BARKA, A.A. 1992. The North Anatolian fault zone. Annales
Tectonicae VI, 164−195,
JACKSON, J. & MCKENZIE, D. 1984. Active tectonics of the AlpineHimalayan Belt between western Turkey and Pakistan.
Geophysical Journal International 77, 185−264.
BARTLETT, W.L., FRIEDMAN, M. & LOGAN J.M. 1981. Experimental
folding and faulting of rocks under confining pressure. Part IX.
Wrench faults in limestone layers. Tectonophysics 79, 255–277.
CHAVEZ, P.S. JR. & KWARTENG, A.Y. 1989. Extracting spectral contrast
in Landsat Thematic Mapper Image data Using selective
Principal
Component
Analysis.
Photogrammetry.
Photogrammetric Engineering & Remote Sensing 55, 339−348.
KAYMAKCI, N. 2000. Tectono-stratigraphical Evolution of the Çankırı
Basin (Central Anatolia, Turkey). Ph.D Thesis, Geologica
Ultraiectina. No. 190, Utrecht University Faculty of Earth
Sciences, The Netherlands, ISBN 90-5744-047-4.
DAILY, M. 1983. Hue-saturation-intensity split-spectrum processing
of Seasat Radar imagery. Photogrammetric Engineering &
Remote Sensing 49, 349−355.
KAYMAKCI, N., WHITE, S.H. & VAN DIJK, P.M. 2000. Paleostress
inversion in a multi-phase deformed area: kinematic and
structural evolution of the Çankırı Basin (central Turkey): Part
1. In: BOZKURT, E., WINCHESTER, J.A. & PIPER, J. (eds), Tectonics
and Magnetism in Turkey and its Surroundings. Geological
Society, London, Special Publications 173, 445–473.
DELLALOĞLU, A.A., TÜYSÜZ, O., KAYA, O.H. & HARPUT, B. 1992.
Kalecik (Ankara)-Eldivan-Yapraklı (Çankırı)-İskilip (Çorum) ve
Devrez Çayı Arasındaki Alanın Jeolojisi ve Petrol Olanakları
[Geology and Petroleum Potential of the Area Between Kalecik
(Ankara)-Eldivan-Yapraklı (Çankırı)-İskilip (Çorum) and
Devrez Çayı]. Turkish Petroleum Coorporation (TPAO)
Report no. 3194 [in Turkish, unpublished].
KAYMAKCI, N., DE BRUIJN, H., WHITE, S.H., VAN DIJK, .M., SARAÇ, G.
& ÜNAY, E. 2001a. Tectonic implications of the Neogene
stratigraphy of the Çankırı basin with special reference to the
Çandir locality (North-Central Anatolia, Turkey). In: GÜLEÇ,
E, BEGUN, D.R. & GERAADS, D. (eds), Geology and Vertebrate
Paleontology of the Miocene Hominoid Locality of Çandır.
Courier Forschungsinstitut Senckenberg 240, 9−28.
DRESEN, G., 1992. Stress distribution and the orientation of Riedel
shears. Tectonophysics 188, 239–247.
KAYMAKCI, N., WHITE, S.H., VAN DIJK, P.M. & ÖZÇELİK, Y. 2001b.
Neogene tectonics of the Çankırı Basin (north Central
Turkey). Association of Turkish Petroleum Geologists Bulletin
13, 27−56.
GILLESPIE. A.R., KAHLE, A.B. & WALKER , R.E. 1986. Color
enhancement of highly correlated images. I. Decorrelation and
HIS contrast stretches. Remote Sensing of Environment 20,
209−235.
GÖRÜR, N., OKTAY, F.Y., SEYMEN, İ. & ŞENGÖR, A.M.C. 1984.
Palaeotectonic evolution of the Tuzgölü basin complex,
Central Turkey: Sedimentary record of a Neotethyan closure.
In: DIXON, J.E. & ROBERTSON, A.H.F. (eds), The Geological
Evolution of the Eastern Mediterranean. Geological Society,
London, Special Publications 17, 467–482.
GRASSO, D.N. 1993. Applications of the HIS color transformation for
1:24,000-scale Geological Mapping: a low cost SPOT
alternative. Photogrammetric Engineering & Remote Sensing
59, 73−80.
KAYMAKCI, N., WHITE, S.H. & VAN DIJK P.M. 2003a. Kinematic and
structural development of the Çankırı Basin (Central Anatolia,
Turkey). a paleostress inversion study. Tectonophysics 364,
85−113.
KAYMAKCI, N., DUERMEIJER, C.E., LANGEREIS, C., WHITE, S.H. & VAN
DIJK, P.M. 2003b. Oroclinal bending due to indentation: a
palaeomagnetic study for the early Tertiary evolution of the
Çankırı Basin (central Anatolia, Turkey). Geological Magazine
140, 343−355.
LAVREAU, J. 1992. De-Hazing Landsat Thematic mapper images.
Photogrammetric Engineering & Remote Sensing 57,
1297−1302.
99
SURFACE AND SUBSURFACE CHARACTERISTICS OF THE ÇANKIRI BASIN
MCCLAY, R. K.R. 1989. Analogue models of inversion tectonics. In:
COOPER, M.A & WILLIAMS, G.D (eds), Inversion Tectonics.
Geological Society, London, Special Publications 44, 41−62.
ROJAY, B. (1993) Tectonostratigraphy and Neotectonic Characteristics
of the Southern Margin of Merzifon-Suluova Basin (Central
Pontides, Amasya). PhD Thesis, Middle East Technical
University, Department of Geological Engineering, Ankara,
Turkey [unpublished].
O`LEARY, D.W., FRIEDMAN, J.D. & POHN, H.A. 1976. Lineament,
linear, lineation: some proposed new standards for old terms.
Geological Society of America Bulletin 87, 1463−1469.
ROJAY, B.F. 1995. Post-Triassic evolution of central Pontides:
evidence from Amasya region, Northern Anatolia. Geologica
Romana 31, 329−350.
OKAY, A.I., HARRIS, N.B.W. & KELLEY, S.P. 1998. Exhumation of
blueschists along a Tethyan suture in northwest Turkey.
Tectonophysics 284, 275−299.
ŞENGÖR, A.M.C. & YILMAZ, Y. 1981. Tethyan evolution of Turkey: a
plate tectonic approach. Tectonophysics 75, 181−241.
LYNX
GEOSYSTEMS INCORPORATION
/>
1997.
Users
Guide.
ÖZÇELİK, Y. 1994. Tectono-stratigraphy of the Laçin Area (ÇorumTurkey). MSc. Thesis, Middle East Technical University,
Department of Geological Engineering, Ankara, Turkey
[unpublished].
ÖZÇELİK, Y. & SAVUN, C. 1993. İskilip-Osmancık-Çorum-Sungurlu
Arasındaki Alanın Jeolojisi ve Petrol Olanakları [Geology and
Petroleum Patential of İskilip-Osmancık-Çorum-Sungurlu
Area]. Turkish Petroleum Coorporation (TPAO) Report no.
3290 [in Turkish, unpublished].
PARK, R.G. & JAROSZWSKI, W. 1994. Craton tectonics, stress and
seismicity. In: HANCOCK, P.L. (ed), Continental Deformation.
Pergamon Press, 200−223.
RICHARD, J.A. 1993. Remote Sensing Digital Image Analysis, An
Introduction. Springer Verlag, New York. 2nd Edition.
ROBERTSON, A.H.F. & DIXON, J.E. (1984) Introduction: aspects of the
geological evolution of the Eastern Mediterranean. In: DIXON,
J.E. & ROBERTSON, A.H.F. (eds), The Geological Evolution of the
Eastern Mediterranean. Geological Society, London, Special
Publications 17, 1−74.
ROBERTSON, A.H.F., DIXON, J.E., BROWN, S., COLLINS, A., MORRIS, A.,
PICKETT, E, SHARP, I. & USTAÖMER, T. 1996. Alternative tectonic
models for the Late Palaeozoic−Early Tertiary development of
the Tethys in the Eastern Mediterranean region. In: MORRIS, A.
& TARLING, D.H. (eds), Paleomagnetism of the Eastern
Mediterranean Regions. Geological Society, London, Special
Publications 105, 239−263.
100
ŞENGÖR, A.M.C., YILMAZ, Y. & SUNGURLU, O. 1984. Tectonics of the
Mediterranean Cimmerides: nature and evolution of the
western termination of palaeo-Tethys. In: DIXON, J.E. &
ROBERTSON, A.H.F. (eds), The Geological Evolution of the
Eastern Mediterranean. Geological Society, London, Special
Publications 17, 77−112.
ŞENGÖR , A.M.C., ŞAROĞLU, F. & GÖRÜR , N. 1985. Strike-slip
deformation and related basin formation in zones of tectonic
escape: Turkey as a case study. In: BIDDLE, K.T. & CHRISTIEBLICK, N. (eds), Strike-Slip Deformation Basin Formation and
Sedimentation. Society of Economic Palaeontologists and
Mineralogists, Special Publications 37, 227−264.
SOHA, J.M. & SCHWARTZ, A.A. 1978. Multispectral histogram
normalization contrast enhancement. Proceedings, 5th
Canadian Symposium on Remote Sensing. Victoria, BC
Canada, 86−93.
SYLVESTER, A.G. 1988. Strike-slip faults. Bulletin of the Geological
Society of America 100, 1666−1703.
TAYLOR, M.M. 1974. Principal components color display of ERTS
imagery. Third Earth Resources Technology Satellite-1
Symposium, National Aeronautics and Space Administration
Special Publication no. 351, 1877−1897.
TÜYSÜZ, O. & DELLALOĞLU, A.A. 1992. Çankırı Havzasının Ttektonik
birlikleri ve Jeolojik evrimi [Tectonic units and geological
evolution of the Çankırı Basin]. Türkiye 9. Petrol Kongresi
Kitabı, 333−349.