Ebook ECG short rapid review for non-Cardiologists (edition 2.1): Part 1
Bạn đang xem bản rút gọn của tài liệu. Xem và tải ngay bản đầy đủ của tài liệu tại đây (1.5 MB, 60 trang )
ECG
Short Rapid Review
For Non-Cardiologists
Edition 2.1
(PocketBook)
Review Medicine with us at :
www.twitter.com/MedRx22
Dr. CHIRAG NAVADIA
2013
1
**ABOUT BOOK **
Hello Dear Friends ,
I am Dr. Chirag Navadia & Its my pleasure to present this
ECG book as a compact version of other detailed ECG books.
This book is meant to be for all the Doctors , Nurses and
Students around the world. If you are curious to learn ECG
Basics, then this is the book for you which is prepared after
reviewing many other books out there. These are some 50+
must know basic ECG with Interpretations, Clinical
Presentation, Etiologies & Managements.
As this is a Review Book , It does not contain All Treatments
in Detail. Emphasize has been made to include all clinically
relevant important points. Please See the index for more
details about the topics in this book.
I hope you will enjoy this book and will not regret your
purchase.
Best Wishes For Your Brilliant Future.
Sincerely
Dr. Chirag Navadia
2|Page
“Book is dedicated to my Parents , Friends, All College
professors and Tutors of Kaplan Medical , USMLE First
Aid , Dr Edward Goljan , Dr Hussain Sattar , Dr Najeeb.
Thanks for giving me most valuable knowledge of my
life “
Copyrights© 2013 Chirag Navadia
Certain ECG images were freely available on Internet &
belongs to their Owner . No part of this book may be
reproduced in any form , by Photostat , microfilm ,
xerography or any other mean , or incorporated into any
information retrieval system , electronic or mechanical ,
without the written permission of Chirag Navadia.
3|Page
TABLE OF CONTENTS
CHAPTER 1 : ECG BASICS……………………………………………………8
1.1 SHORT INTRODUCTION ......................................................................... 8
1.2 CONDUCTION PATHWAY.................................................................... 11
1.3 BLOOD SUPPLY TO HEART ................................................................ 12
1.4 ACTION POTENTIALS ........................................................................... 14
1.5 PHASES OF CARDIAC CYCLE ............................................................. 17
GENERAL PHYSIOLOGICAL TERMS ....................................................... 20
1.6 ECG RECORDING ..................................................................................... 22
1.8 BEST METHOD TO DETERMINE HEART RATE ........................ 29
1.9 TYPES OF ECG ........................................................................................... 30
1.10 STANDARD CHEST LEAD PLACEMENT OF ELECTRODES 33
1.11 CORONARY TERRITORY ON 12 LEAD ECG .............................. 35
1.12 ANALYSING THE RHYTHM .............................................................. 36
CHAPTER 2 : SINUS RHYTHMS……………………………………………38
Normal ECG ....................................................................................................... 38
Normal 12-Lead ECG ..................................................................................... 39
SINUS ARRYTHMIAS ..................................................................................... 40
SINUS BRADYCARDIA................................................................................... 41
SINUS TACHYCARDIA ................................................................................... 43
SINUS PAUSE..................................................................................................... 45
4|Page
CHAPTER 3 : ATRIO-VENTRICULAR ARRYTHMIAS …………………………47
ATRIAL TACHYCARDIA ............................................................................... 47
MULTIFOCAL ATRIAL TACHYCARDIA ................................................. 49
ATRIAL FLUTTER ........................................................................................... 50
ATRIAL FIBRILLATION ................................................................................ 52
PREMATURE ATRIAL CONTRACTION .................................................. 54
SUPRAVENTRICULAR TACHYCARDIA ................................................. 56
PAROXYSMAL SUPRAVENTRICULAR TACHYCARDIA .................. 57
WANDERING ATRIAL PACEMAKER ...................................................... 60
CHAPTER 4 : VENTRICULAR ARRYTHMIAS……………………………..61
IDIOVENTRICULAR RHYTHM ................................................................... 61
ACCELETATED IDIOVENTRICULAR RHYTHM ................................ 62
VENTRICULAR TACHYCARDIA (MONOMORPHIC) ........................ 63
VENTRICULAR TACHYCARDIA (POLYMORPHIC) .......................... 65
VENTRICULAR FIBRILLATION................................................................. 66
TORSADE DE POINTES ................................................................................ 68
PULSELESS ELECTRICAL ACTIVITY ...................................................... 69
ASYSTOLE ........................................................................................................... 71
CHAPTER 4 : HEART BLOCKS……………………………….…………….72
ATRIOVENTRICULAR BLOCKS (FIRST DEGREE BLOCK) ............ 72
2ND DEGREE AV BLOCK : MOBITZ TYPE I ........................................... 74
2ND DEGREE AV BLOCK : MOBITZ TYPE II.......................................... 75
5|Page
3RD DEGREE AV BLOCK ................................................................................ 77
SINOATRIAL BLOCK (SA BLOCK) ........................................................... 78
RIGHT & lEFT BUNDLE BRANCH BLOCKS ......................................... 79
CHAPTER 5 : MYOCARDIAL INFARCTION………………………………82
ECG CHANGE FROM DAY 1 TO YEAR LATER .................................... 86
ST SEGMENT CHANGES FROM ISCHEMIA TO MI ........................... 87
ST SEGMENT ELEVATION & DEPRESSION ........................................ 88
INFERIOR WALL MI ....................................................................................... 91
ANTERIOR WALL MI ..................................................................................... 92
LATERAL WALL MI ........................................................................................ 93
CHAPTER 6 : JUNCTIONAL ARRYTHMIAS……………………………….94
JUNCTIONAL RHYTHM ................................................................................ 94
ACCELERATED JUNCTIONAL RHYTHM ............................................... 95
JUNCTIONAL ESCAPE BEATS .................................................................... 96
WOLF-PARKINSON WHITE SYNDROME ............................................. 97
PREMATURE JUCTIONAL CONTRACTIONS ....................................... 98
SINGLE CHAMBER PACEMAKER RHYTHM - VENTRICULAR .... 99
SINGLE CHAMBER PACEMAKER RHYTHM - ATRIAL ................ 100
DUAL CHAMBER PACEMAKER RHYTHM – ATRIAL &
VENTRICULAR .............................................................................................. 100
CHAPTER 7 : PREMATURE VENTRICULAR CONTRACTIONS…………101
PVC : UNIFORM VS MULTIFORM ......................................................... 102
6|Page
PVC : VENTRICULAR BIGEMINY VS TRIGEMINY ......................... 103
PVC : VENTRICULAR QUADRIGEMINY VS COUPLETS ............... 104
CHAPTER 8 : MISCELLANEOUS…………………………………………..106
HYPERKALEMIA VS HYPOKALEMIA .................................................. 106
HYPERCALCEMIA VS HYPOCALCEMIA ............................................. 109
CHAPTER 9 : P & Q WAVE RELATIONSHIPS……………………………112
P MITRALE/P SINISTROCARDIALE (MITRAL STENOSIS) ....... 113
P PULMONALE (COR PULMONALE) ................................................... 114
RIGHT ATRIAL ENLARGEMENT ........................................................... 114
LEFT ATRIAL ENLARGEMENT. ............................................................. 115
MECHANISM OF Q WAVE ........................................................................ 116
ACUTE PERICARDITIS ............................................................................... 117
CARDIAC PHARMACOLOGY……………………………………………….118
ANTI-ARRYTHMIC DRUGS ...................................................................... 118
ANTIHYPERTENSIVE DRUGS................................................................. 125
ANTIHYPERLIPIDEMIC DRUGS ............................................................ 128
NON PHARMACOLOGICAL TREATMENTS ...................................... 130
References ....................................................................................................... 132
7|Page
CHAPTER 1 : ECG BASI CS
1.1 SHORT INTRODUCTION
Electrocardiogram (ECG)
The electrocardiogram is commonly used to detect
abnormal heart rhythms and to investigate the cause of
chest pains.
What is an electrocardiogram?
An electrocardiogram (ECG) records the electrical
activity of the heart. The heart produces tiny electrical
impulses which spread through the heart muscle to
make the heart contract. These impulses can be detected
by the ECG machine. You may have an ECG to help find
the cause of symptoms such as palpitations or chest pain.
Sometimes it is done as part of routine tests - for
example, before you have an operation.
The ECG test is painless and harmless. (The ECG machine
records electrical impulses coming from your body - it
does not put any electricity into your body.)
How is it done?
Small metal electrodes are stuck on to your arms, legs
and chest. Wires from the electrodes are connected to
the ECG machine. The machine detects and amplifies the
electrical impulses that occur at each heartbeat and
records them on to a paper or computer. A few
heartbeats are recorded from different sets of electrodes.
The test takes about five minutes to do.
Usually, more than two electrodes are used, and they can
be combined into a number of pairs (For example: left
arm (LA), right arm (RA) and left leg (LL) electrodes
form the three pairs LA+RA, LA+LL, and RA+LL). The
output from each pair is known as a lead. Each lead
8|Page
looks at the heart from a different angle. Different types
of ECGs can be referred to by the number of leads that
are recorded, for example 3-lead, 5-lead or 12-lead ECGs
(sometimes simply "a 12-lead").
A 12-lead ECG is one in which 12 different electrical
signals are recorded at approximately the same time and
will often be used as a one-off recording of an ECG,
traditionally printed out as a paper copy. Three- and 5lead ECGs tend to be monitored continuously and viewed
only on the screen of an appropriate monitoring device,
for example during an operation or while being
transported in an ambulance. There may or may not be
any permanent record of a 3- or 5-lead ECG, depending
on the equipment used.
What does an electrocardiogram show?
The electrodes on the different parts of the body detect
electrical impulses coming from different directions
within the heart. There are normal patterns for each
electrode. Various heart disorders produce abnormal
patterns. The heart disorders that can be detected
include :
-Abnormal heart rhythms. If the heart rate is very
fast, very slow, or irregular. There are various
types of irregular heart rhythm with
characteristic ECG patterns.
-A heart attack (myocardial infarction), Whether it
was recent or some time ago. A heart attack
causes damage to heart muscle, and heals with
scar tissue. These can be detected by abnormal
ECG patterns.
-An enlarged heart. Basically, this causes bigger
impulses than normal.
All Other ECG are discussed in detail from Chapter 2
onwards.
9|Page
Limitations of the electrocardiogram
An ECG is a simple and valuable test. Sometimes it can
definitely diagnose a heart problem. However, a normal
ECG does not rule out serious heart disease. For example,
you may have an irregular heart rhythm that 'comes and
goes', and the recording can be normal between
episodes. Also, not all heart attacks can be detected by
ECG. Angina, a common heart disorder, cannot usually be
detected by a routine ECG.
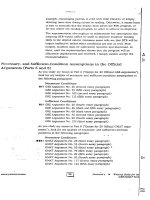
Specialised ECG recordings sometimes help to
overcome some limitations. For example:
Exercise ECG This is where the tracing is done when you
exercise (on a treadmill or exercise bike). This helps to
assess the severity of the narrowing of the coronary
arteries which causes angina.
Ambulatory ECG. This is where you wear a small
monitor which constantly records your heart rhythm.
This test records the electrical activity of your heart
when you are walking about (ambulatory) and doing
your normal activities. It aims to detect abnormal heart
rhythms that may 'come and go'. The electrical activity is
usually recorded for 24-48 hours.
10 | P a g e
1.2 CONDUCTION PATHWAY
Image courtesy : Hole’s human anatomy and physiology , 7 th edition by
Shier
An electrical stimulus is generated by the sinus node.
Sinus Node is also called the Sinoatrial node or SA node,
It Consist of a small mass of specialized tissue located in
the right atrium (right upper chamber) of the heart.
The sinus node generates a regular electrical stimulus,
which for adults, is usually 60 to 100 times per minute
under normal conditions. This electrical stimulus travels
down through the conduction pathways and causes the
heart's lower chambers to contract and pump out blood.
The right and left atria (the two upper chambers of the
heart) are stimulated first and contract for a short period
of time before the right and left ventricles (the two lower
chambers of the heart).
11 | P a g e
The electrical impulse travels from the sinus node to the
atrioventricular node (also called AV node), where
impulses are slowed down for a very short period & then
allowed to continue down the conduction pathway via an
electrical channel called as bundle of His into the
ventricles. The bundle of His divides into right and left
pathways to provide electrical stimulation to the right
and left ventricles. Each contraction of the ventricles
represents one heartbeat
1.3 BLOOD SUPPLY TO HEART
Image Courtesy : Principles of anatomy and physiology , 11e John Wiley &
Sons
The Heart is supplied by the Coronary arteries which
arises Behind the Aortic Valves. 1) Left Coronary Artery
& 2) Right coronary artery.
The left coronary artery is Further Devided into Left
circumflex artery and Left Anterior descending artery
12 | P a g e
aka Anterior Interventricular Branch.
The Right Coronary Artery is Further Divided into
Marginal Arteries, Nodal Arteries & Posterior
Interventricular Branch.
Various Anastomoses & Collaterals are formed between
branches of Left & Right Coronary Artery. No Symptoms
of Ischemic Heart Disease are noticeable until more than
70% of Coronary Artery Lumen is occluded.
Risk of Infarction Increases when more than 90% of
Arterial Lumen is occluded.
SA & AV Node are Supplied by Nodal branches of Right
Coronary Artery in 90% Population called as Right
Dominant Heart.
SA & AV Node Are Supplied by Branches of Left Coronary
Artery in 10% Population called as Left Dominant Heart.
Blood Vessel
Right Coronary Artery
Posterior Interventricular
Artery
Area Supplied
To the Right atrium, Right
ventricle and part of the left
ventricle
Posterior Third of
Interventricular Septum
Left Coronary Artery
Left anterior descending
artery
To the Anterior wall of the
left ventricle, Anterior 2/3rd
Interventricular septum,
Bundle of His, Right bundle
branch, and Left anterior
fasciculus of the left bundle
branch
13 | P a g e
Left Circumflex artery
To the lateral walls of the
left ventricle, left atrium,
and left posterior fasciculus
of the left bundle branch
Cardiac veins
Collect blood from the
capillaries of the
myocardium
Returns blood to the right
atrium.
Coronary sinus
1.4 ACTION POTENTIALS
Action potentials are generated by special types of
voltage-gated ion channels embedded in a cell's plasma
membrane. They are responsible for the generation of
electrical impulses in the Heart.
ACTION POTENTIAL IN FAST RESPONSE FIBRES
Fast Response Fibres : Cardiac Muscle , His-Purkinje System
Phase 0 : Phase of Depolarization : Depends on
number of Sodium Channels (Na+ coming into the cell)
which in turn depends on Resting membrane potential of
cell. Contraction occur during this phase (Atrial
14 | P a g e
depolarisation – P wave , Ventricular depolarization –
first half of QRS complex). Class I antiarrythmics
(Procainamide, Quinidine, Disopyrimide) Blocks Phase 0
in fast response fibres.
Phase I : Na+ channels are inactivated. Overshoot
develops because of Potassium (K+) going out of cell &
inward Chlorine current.
Phase II : Plateau Phase : Balanced by slow Calcium
current going into the cell and Slow K+ going out of cell.
Phase III : Repolarisation Phase : Delayed K+ rectifier
current rapidly increases and calcium channels get
inactivated. Atrial repolarization is not seen on ECG, It is
believed to be hidden behind QRS complex , T wave
indicates Ventricular repolarization. Class III
antiarrythmics (Amiodarone , sotalol )slow down this
phase.
Phase IV : Return of membrane to resting potential .
Maintained by Na+/K+ ATPase pump which send Sodium
out of cell in exchange of Potassium. Phase IV is flat in
Fast fibres.
15 | P a g e
ACTION POTENTIAL IN SLOW RESPONSE FIBRES
Slow Response Fibres : SA Node & AV Node
Phase 0 : Dependent on Calcium Channels (Not on
Sodium Channels . With each depolarization SA node
sends signal to contract the heart . Class IV
antiarrythmics (Verapamil , Diltiazem) can slow or block
this phase .
Phase I & II is not present in SA & AV node
Phase III : Repolarisation phase , due to Potassium going
out of cell.
Phase IV : Rising Slope (Not flat as in fast fibres) ,
referred to as Pacemaker current . it’s due to inward Na+
& Ca++ current and outward K+ current (not well
understood yet). Class II (B blockers) & Class IV (Ca+
channel blockers) act on this phase and decreases heart
rate.
16 | P a g e
1.5 PHASES OF CARDIAC CYCLE
Image Courtesy : Hypocaffeinic.pbworks.com
5 Phases of Cardiac cycle are as follow :
Isovolumetric ventricular contraction : Volume in the
ventricles does not change during this phase .
In response to ventricular depolarization, tension in the
ventricles increases. This increase in pressure within the
ventricles leads to closure of the mitral and tricuspid
17 | P a g e
valves which give rise to the S1 heart sound. The
pulmonic and aortic valves stay closed during the entire
phase. Ventricular Contraction is reflected by QRS
complex on the ECG .
The pressure during this phase gradually increases &
when the pressure exceeds aortic and pulmonary
arterial pressure (ie at 80 mmHg), the aortic and
pulmonic valves open and the ventricles eject blood. This
phase is called as Ejection Phase.
Opening of Aortic & Pulmonary valves does not cause
any heart sound.
After an ejection phase the pressure inside ventricles
start falling due to relaxation of ventricles. When
ventricular pressure falls below the pressure in aorta
and pulmonary artery, the Aortic and Pulmonic valves
closes. This phase is called as isovolumetric relaxation.
The closure of Pulmonary & Aortic valves give rise to S2
sound. All valves are closed during this phase. Atrial
diastole occurs during this time and the blood fills the
atria. On the ECG it will be reflected by T Wave .
Just on the side note remember that the pulmonic valve
closes before the aortic valves which give rise to Split in
2nd heart sound which can be heard during inspiration
on auscultation. Anything which delays Pulmonary valve
closure will increase Splitting. All Cardiac Sounds are
discussed in more detail in our last section of Murmers .
The phase of Rapid Ventricular filling : As the blood
continue to fill Atrium, The Atrial pressure exceeds
ventricular pressure, which causes the mitral and
tricuspid valves to open, it will lead the Blood to flows
passively from the atria into the ventricles.
18 | P a g e
About 70% of ventricular filling takes place during this
phase. Sometimes S3 heart sound Is heard during this
phase due to the rapid filling of ventricles example
(Normal in Youngs). Pathologically associated with
Dilated cardiomyopathy and some other pathologies
which will be discussed in Pathology section.
After Rapid filling , Atrial systole will occur : Known as
the atrial kick, atrial systole (coinciding with late
ventricular diastole) It supplies the ventricles with the
remaining 30% of the blood for each heartbeat & the
new cycle keeps going .
Heart is Innervated mainly by Parasympathetic
(Vagus) Fibres & Sympathetic Fibres.
Sympathetic Stimulation Increases Heart Rate. The
Pain which arises during Angina travels through
Sympathetic Fibres to Spinal Cord segment T1-T5.
Parasympathetic Stimulation Decreases Heart Rate.
Sensory Fibres that Carry Afferent Limb of Cardiac Reflex
Travel with Vagus Nerve.
19 | P a g e
GENERAL PHYSIOLOGICAL TERMS
Preload is the load on Ventricular Muscles at the end of
Diastole. It is determined mainly by Left Ventricular End
Diastolic Volume & Left Ventricular End Diastolic
Pressure ie by Venous Return.
Increase in Preload results in increase in Contractility
which in turn increases Stroke Volume & thus increase in
Ejection Fraction
A Rise in Pulmonary Capillary Wedge Pressure is
evidence of increased Preload on the Left Ventricle. In
Some Cases like Mitral Stenosis or Mitral Valve Prolapse
it is not a good index of Left Ventricular Preload..
Stroke Volume is the amount of blood that heart pump
out with each beat . It is affected by Contractility,
Afterload & Preload.
Stroke Volume is Calculated as : SV = EDV (End Diastolic
Volume) – ESV (End Systolic Volume)
EDV – Volume that is in the Left Ventricle after Diastole.
ESV – Volume That Remains in the Left Ventricle After
Systole
Ejection fraction is the fraction of blood which heart
pumps out during 1 contraction which is usually 60% in
healthy normal adult
Ejection Fraction = SV/End diastolic volume = EDVESV/EDV.
Normal SV is 70 ml and EDV is 120 ml in 70kg man . So if
you calculate , it will come out to be 60% .
Cardiac output = Heart Rate * Stroke Volume .
So if the heart rate is 72 per minute , and stroke volume
20 | P a g e
is 70 ml , then Cardiac output in 1 minute = 5000ml or 5
Litres per minutes . Chronic increase in preload is
Responsible for Dilated Cardiomyopathy
Ficks Principle says that : CO = Rate of O2 Consumption /
Arterial O2 Content – Venous O2 Content
Mean Arterial Pressure is defined as Average arterial
pressure during since cardiac cycle. It is calculated as :
(i) MAP = Cardiac Output * Total Peripheral Resistance.
(ii) MAP = 2/3rd Diastolic Pressure + 1/3rd Systolic
Pressure.
Ex : If Mr. John has Blood Pressure of 120/80 mmHg ,
His MAP will be – 2/3rd (80) + 1/3rd (120) = 92 mmHg
Pulse Pressure is merely the Difference between
Systolic Pressure and Diastolic Pressure, It is Calculated
as – PP = Systolic Pressure – Diastolic Pressure. In Above
Case, Mr. John will have Pulse Pressure of 40mmHg.
Afterload : The pressure AGAINST which heart will
work – determined by Peripheral Arterial resistance –
Chronic increase in Afterload (eg Hypertension) will lead
to Left ventricular hypertrophy
From physiological formula : Blood flow = Pressure /
Resistance (Q=P/R) .
So if the resistance will increase, the blood flow will
decrease and the heart will have to pump more amount
of blood against more resistance. Chronically it will lead
to ventricular muscle hypertrophy.
21 | P a g e
1.6 ECG RECORDING
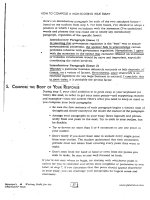
The horizontal axis of the ECG strip represents time.
Each small block equals 0.04 second, and five small
blocks form a large block, which equals 0.20 second.
This time increment is determined by multiplying 0.04
second (for one small block) by 5, the number of small
blocks that compose a large block.
Five large blocks equal 1 second (5 ✕ 0.2). When
measuring or calculating a patient’s heart rate, a 6second strip consisting of 30 large blocks is usually used.
The ECG strip’s vertical axis measures amplitude in
millimeters (mm) or electrical voltage in millivolts (mV)
Each small block represents 1 mm or 0.1 mV; each large
block, 5 mm or 0.5 mV.
To determine the amplitude of a wave, segment, or
interval, count the number of small blocks from the
baseline to the highest or lowest point of the wave,
segment, or interval.
22 | P a g e
1.7 INTERVALS AND SEGMENTS
RR
It is the interval between a R wave 0.6s to
interval and the next R wave, Normal resting 1.2sec
heart rate is between 60 and 100
bpm.
During Normal Atrial depolarization, < 0.08s
the main electrical vector is directed
Height <
from the SA node towards the AV
2.5mm
node and spreads from the right
P wave
atrium to the left atrium . This turns
into the P wave on the ECG.
For abnormal P waves see Right
Atrial Hypertrophy, Left Atrial
Hypertrophy, Atrial Premature
Beat, Hyperkalaemia
23 | P a g e
The PR interval is measured from
the beginning of the P wave to the
beginning of the QRS complex. The
PR interval reflects the time the
electrical impulse takes to travel
from the sinus node through the AV
PR
interval node and entering the ventricles.
The PR interval is therefore a good
estimate of AV node function.
0.12 to
0.20s(35 Small
squares
)
For Short PR segment consider
Wolf-Parkinson-White syndrome or
Lown-Ganong-Levine syndrome
(other causes - Duchenne muscular
dystrophy, type II glycogen storage
disease (Pompe's), Hypertrophic
Obstructive CardioMyopathy).
For long PR interval see first degree
heart block and 'trifasicular' block
The PR segment connects the P wave 0.05 to
and the QRS complex.
0.12s
The impulse vector is from the AV
PR
node to the bundle of His to the
segment bundle branches and then to the
Purkinje fibers. This electrical
activity does not produce a
contraction directly and is merely
traveling down towards the
ventricles, and this shows up flat on
24 | P a g e
the ECG. The PR interval is more
clinically relevant.
The QRS complex reflects the rapid
depolarization of the right and left
ventricles. The ventricles have a
large muscle mass compared to the
QRS
atria, so the QRS complex usually has
complex
a much larger amplitude than the Pwave.
0.08 to
0.12s (23 small
squares)
For Abnormally wide QRS consider
right or left bundle branch block,
ventricular rhythm, hyperkalaemia,
etc.
J-point
The point at which the QRS complex N/A
finishes and the ST segment begins.
It is used to measure the degree of
ST elevation or depression.
The ST segment connects the QRS
0.08 to
complex and the T wave. The ST
0.12s
segment represents the period when
the ventricles are depolarized. It is
ST
isoelectric. No elevation or
segment
depression is normally seen.
Causes of elevation include
Acute MI (e.g. anterior,
inferior), left bundle branch
block, normal variants (e.g.
athletic heart, Edeiken
25 | P a g e