Ebook A concise guide to intraoperative monitoring: Part 2
Bạn đang xem bản rút gọn của tài liệu. Xem và tải ngay bản đầy đủ của tài liệu tại đây (3.34 MB, 115 trang )
chapter 7
Evoked Activity
7.1
Introduction
A clinically important tool in assessing the integrity of cortical and subcortical neuronal relays is the study of evoked responses (ERs) which result from external stimulation of a neural pathway.
The rationale for using ERs intraoperatively is very simple: all naturally occurring
external stimuli detected by the sense organs, such as sounds and lights, are transmitted
to the brain in the form of electrical signals through various sensory neural pathways.
If these pathways are structurally and functionally intact, the signals reaching the brain
give rise to certain patterns of activity. Thus, like the natural stimuli, the delivery
of experimental stimuli, such as tones or electrical pulses, and the simultaneous
observation of the resulting patterns of activity provide an instantaneous display of
the status of the sensory neural structures intervening between the stimulation and
recording sites.
ERs can be subdivided further into averaged and nonaveraged responses, examples
of which are the familiar evoked potentials (EPs) and the electrically triggered EMG,
respectively. In this chapter we present details on the use, features, stimulation, and
recording procedures, as well as interpretation criteria of the various kinds of averaged
and nonaveraged ERs.
7.2
Evoked Potentials
An EP is the electrical response of the nervous system to external stimulation. There
are two major types of EPs, sensory and motor. In the former category, a stimulus
is delivered peripherally (e.g., at a leg nerve) and the resulting response is recorded
centrally (e.g., the cortex). In the latter category, a stimulus is delivered centrally
(e.g., at the cortex) and the resulting response is recorded peripherally (e.g., at a leg
nerve or muscle).
Depending on the stimulus modality, sensory EPs are divided into somatosensory,
auditory, and visual, indicated as SEPs, AEPs, and VEPs, respectively. Early AEPs
are referred to as brainstem auditory evoked responses (BAERs). Motor EPs can be
89
90
chapter 7: Evoked Activity
further divided into neurogenic and myogenic, depending on whether the response is
recorded at a nerve or at a muscle.
Single-trial evoked responses are not readily apparent in the background activity
and, to detect them, averaging of several trials is necessary (see Section 4.4.10). The
averaged EPs consist of an ordered series of negative or positive components (waves or
peaks) of particular morphology, amplitude, and latency. These three characteristics
are the variables to be monitored intraoperatively.
For averaged responses, regardless of the stimulus modality, the stimulation rate
should be relatively high, so that data are collected fast enough and average responses
are updated sufficiently often to allow early detection of possible response changes.
However, this rate should not exceed a certain critical value, to avoid degradation
of response amplitude and morphology. Moreover, the interval between successive
stimuli should not match the period of any oscillatory signals, such as the well-known
60 Hz power-line cycle, otherwise the averaged responses will contain a periodic
artifact. To avoid this synchronization problem, a noninteger stimulation rate should
be used, such as, for instance, 4.7 Hz.
Also, in all modalities the analysis time or time base, that is, the length (in msec) of
the segment of signal collected following each stimulus, is another factor to consider
in selecting the stimulation rate. If the interval between successive stimuli is shorter
than the analysis time, a stimulus artifact will be present in the averaged response. The
analysis time is selected so that all peaks of interest fall within the analysis window.
During the course of surgery, ongoing responses (the last set of EPs) are compared
against a set of baselines which are obtained after induction of anesthesia and final
positioning of the patient and before any surgical manipulation. However, if after
the incision and before any surgical maneuvering, the responses have changed excessively due, for example, to drastic changes in anesthesia regime, such as use of
different anesthetic agents or induction of hypotension, then the baselines should be
reestablished.
Baseline recordings should be of familiar morphology, should contain clear and
reliable components, and should also be consistent with the clinical picture of the
patient. However, one should keep in mind that the purpose of intraoperative monitoring is to detect response changes due to surgery, not to make a clinical diagnosis.
Baselines should remain on the screen for comparison with the current responses
throughout the case.
Like the ongoing activity presented in Chapter 6, evoked responses are affected
by anesthetic agents, blood pressure, and body temperature, since all these factors
can alter blood perfusion and metabolic rate in neural cells. In the following sections we concentrate on different types of evoked activity typically recorded during
the course of neurological, orthopedic, or vascular surgery and we give details regarding the generation, information content, recommended electrode locations, and
typical acquisition parameters. A quick summary of the various factors that affect
the recorded neurophysiological signals, such as pharmacological agents and induced
neuroprotective conditions, is also presented, along with information to assist with
the interpretation of the results.
7.3
Somatosensory Evoked Potentials
7.3
7.3.1
91
Somatosensory Evoked Potentials
Generation
Somatosensory evoked potentials (SEPs) can be elicited by electrical stimulation of
a peripheral nerve, such as the median nerve at the wrist or the posterior tibial nerve
at the ankle. The location of these nerves is schematically shown in Figure 7.1.
Radial
nerve
Common
Peronial
nerve
Ulnar
nerve
Median
nerve
Tibial
nerve
(a)
(b)
Figure 7.1 Schematic diagram of (a) the median nerve at the wrist and (b) the posterior tibial
nerve at the ankle.
These nerves are part of the somatosensory system, a schematic diagram of which
is shown in Figure 7.2. Evoked activity travels along the stimulated nerve and enters
the spinal cord through the dorsal roots. From there, ascending pathways take the
impulses first to the brainstem, then to the thalamus and, finally, to the primary sensory
cortex. Ascending volleys of SEPs can be recorded at any point along this pathway.
More specifically, activity within the spinal cord is conveyed by the dorsomedial
tracts, and remains ipsilateral to its side of entry. A first synapse is formed in the
medulla, the inferior portion of the brainstem, in the nucleus gracilis for fibers from the
lower portion of the body and in the nucleus cuneatus for fibers from the upper portion
of the body. Fibers leaving the medulla decussate to form the contralateral medial
lemniscus and terminate in the thalamus, where a second synapse is formed. Fibers
leaving the thalamus terminate in the sensory cortex in a somatotopic arrangement.
Legs are represented close to the midline, whereas arms and hands are represented
more laterally. A diagram of the somatotopic arrangement of the primary sensory
cortex is shown in Figure 7.3.
chapter 7: Evoked Activity
92
Cerebral
Cortex
Thalamus
Medulla
C7
Brachial
Plexus
Median
Nerve
S1
Sacral
Plexus
Posterior
Tibial
Figure 7.2 Schematic diagram of the somatosensory system.
7.3.2
Use
Somatosensory evoked potentials are used intraoperatively to:
• Monitor blood perfusion of the cortex or the spinal cord (e.g., during an
aneurysm clipping).
• Monitor the structural and functional integrity of the spinal cord during orthopedic or neurological surgery (e.g., for scoliosis or a spinal tumor).
• Monitor structural and functional integrity of peripheral nerves (e.g., sciatic
nerve during ascetabular fixation), spinal nerve roots (e.g., during decompression in radiculopathy), and peripheral nerve structures (e.g., the brachial
plexus).
7.3.3
SEP Features
Figure 7.3
lus.”
93
Somatotopic arrangement of the primary sensory cortex showing the “homuncu-
• Determine functional identity of cortical tissue (e.g., one can separate the sensory from motor cortex by identifying the central sulcus).
7.3.3
SEP Features
In general, monitoring protocols require stimulation of the left and right sides of the
body independently, resulting in two sets of responses, one from each side. Typical
recordings include a peripheral, a subcortical, and a cortical response. The peripheral
response is typically recorded from the Erb’s point for arm stimulation, or the popliteal
fossa for leg stimulation. The two central responses are obtained from a cervical
and a cortical location, respectively. The locations of the stimulating and recording
electrodes are schematically shown in Figures 7.4 and 7.5 for arm and leg stimulation,
respectively.
Normal SEPs consist of clear, reliable, and bilaterally symmetric components.
That is, the waveforms obtained have standard, known morphology, and the individual peaks are clearly identifiable against the background (noise-free recordings).
Additionally, repeated recordings from the same limb result in similar (within 10%)
amplitudes and latencies. Similarly, the difference in amplitude and latency between
the two limbs is minimal (typically, less than 10%).
7.3.4
Recording Procedure
The choice for the peripheral nerve to stimulate depends on the site of surgery [54].
Typically, if the site of surgery is (1) above the level of the seventh cervical vertebra
(Cvii), one should stimulate the median nerve; (2) above and including the level of
chapter 7: Evoked Activity
94
C4'
Fpz
Erb's point
Cii
Ground
Stimulation
Figure 7.4 Location of the stimulating and recording electrodes to record median nerve
SEPs.
Cvii, the ulnar nerve; and (3) below Cvii, the posterior tibial nerve. It is recommended,
however, to always monitor brachial plexus function, through ulnar nerve stimulation,
to avoid a possible plexopathy from improper positioning of a patient’s shoulders.
Stimulation Parameters
Electrical stimulation of a peripheral nerve is commonly used to elicit somatosensory
responses which can be recorded from the spinal cord or the brain. The number
of fibers excited by an electrical stimulus is determined by the amount of current
delivered. Constant current stimulation results in more stable responses, because the
number of fibers excited with each stimulus remains the same.
The intensity and duration of the stimuli are adjusted so that the stimulation
achieved is supramaximal [54, 66], that is, all neuronal axons are forced to fire.
However, care should be taken to avoid skin damage and local burns from stimuli
of excessively high intensity or long duration. Typical intensity values are 25 mA
for arm stimulation and 50 mA for leg stimulation. The stimulus duration is set at
0.3 msec in both cases [57].
As explained in Section 7.2, a noninteger stimulation rate, such as 4.7 Hz, is used
to avoid synchronization with power line interference. A time base of 100 msec
is sufficient to produce reliable responses with all peaks falling within the analysis
window [20].
Recording Parameters
When recording cortical responses, which represent mostly activity on neuronal dendrites, a bandwidth between 10 and 300 Hz is required, whereas for subcortical
activity, which is primarily due to axonal sources, a frequency range between 10
7.3.4
Recording Procedure
95
Cz'
Fpz
Cii
Ground
Popliteal
Fossa
Stimulation
Figure 7.5 Location of the stimulating and recording electrodes to record posterior tibial
nerve SEPs.
and 3000 Hz is necessary. Reliable SEPs can be obtained with 300 trials for arm
stimulation and 500 trials for leg stimulation [54].
Recording Sites
The somatotopic arrangement of the sensory cortex should be kept in mind when
recording SEPs. The electrodes are placed on the scalp on specific locations in order
to obtain maximum responses to sensory stimuli, according to the 10–20 international
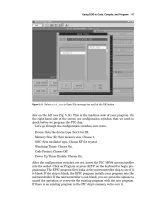
placement system used in clinical applications. The typical electrode locations for
recording median nerve SEPs are shown in Figure 7.6(a), where arrows indicate the
recording montage. For simplicity, only the channels corresponding to right-hand
stimulation are shown.
Similarly, typical electrode locations for recording posterior tibial nerve SEPs are
shown in Figure 7.6(b). In this case, an additional channel, not shown in Figure 7.6(b),
is used for the recording from the popliteal fossa. Electrode C3 , C4 , and Cz are placed
2 cm behind C3 , C4 , and Cz , respectively. Table 7.1 summarizes the acquisition
parameters recommended for intraoperative monitoring of median and posterior tibial
nerve SEPs, respectively.
chapter 7: Evoked Activity
96
3
2
Ground
EPL
1
EPR
1
2
Ground
(a)
(b)
Figure 7.6 Typical electrode locations for intraoperative recordings of (a) median nerve and
(b) posterior tibial nerve SEPs.
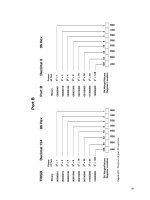
Table 7.1 Recommended Parameter Settings for Recording Median and Posterior
Tibial Nerve SEPs
Side
(stim)
Recording
Channel Bandwidth
Fpz –C4
Left
Right
Fpz –Cii
Fpz –EPL
Stimulation
Intensity
Rate
Duration
Median Nerve
Time Base
Sensitivity
100 msec
10 µV
100 msec
10 µV
10–300 Hz
Fpz –C3
20–2000 Hz
10–300 Hz
Fpz –Cii
Fpz –EPR
10–2000 Hz
25 mA
4.7 Hz
0.3 msec
Posterior Tibial Nerve
Left
Right
7.3.5
Fpz –Cz
Fpz –Cii
P FL
Fpz –Cz
Fpz –Cii
P FR
10–300 Hz
10–2000 Hz
10–300 Hz
50 mA
4.7 Hz
0.3 msec
10–2000 Hz
SEPs to Arm Stimulation
A common technique is to stimulate the median nerve at the wrist1 while recording
along the nerve pathway, initially from Erb’s point, a clavicular location shown in
Figure 7.7, then from a cervical point at the level of the second vertebra (Cii ), and
finally from the contralateral parietal cortex (C3 or C4 ).
1 As explained in Section 3.5.2, the negative stimulating electrode is always placed closer to the recording
side.
7.3.5
SEPs to Arm Stimulation
97
Figure 7.7 Anatomic location of Erb’s point.
When the wrist is not accessible, as when, for example, the patient’s arm is in a
cast, the median nerve can be stimulated at alternate sites, namely at the elbow or
the axilla. The correct locations for placing the stimulating electrodes at the wrist,
elbow, and axilla are shown in Figure 7.8.
Figure 7.8 Placement of stimulating electrodes along the median nerve pathway.
Similar responses are detected from ulnar or radial nerve stimulation, although the
amplitude of individual peaks is lower, apparently due to a smaller number of fibers
being activated [66]. Figure 7.9 shows the correct sites for placing the stimulation
electrodes along the pathway of the ulnar nerve at the wrist and at the elbow.
To record SEPs, the active (negative) electrodes are placed over the Erb’s point,
the cervical Cii vertebra, and the C3 and C4 locations on the scalp. Electrode C3 and
C4 are placed 2 cm behind C3 and C4 , respectively. The inactive (positive) electrode
is placed on the forehead (Fpz ) [20] with a ground on a shoulder.
Approximately 9 msec after stimulation of the median nerve at the wrist the Erb’s
point electrode detects a negative component (N9), which represents action potentials
generated by the peripheral nerve fibers contained in the brachial plexus [9]. About
chapter 7: Evoked Activity
98
Figure 7.9 Placement of stimulating electrodes along the ulnar nerve pathway.
13 msec following stimulation the cervical electrode detects a major negative component (N13), which is generated probably by several sources in the dorsal column of
the spinal cord. This component is presumably made up of both excitatory postsynaptic potentials and action potentials. The most important scalp-recorded component
has a negative peak at about 20 msec which is followed by a positive peak at about
25 msec, forming the N20–P25 complex. The N20 probably originates from the
parietal sensory cortical area contralateral to the side of stimulation [66].
An example of typical components obtained along the sensory pathway after stimulation of the median nerve at the wrist is shown in Figure 7.10. Notice the symmetry
of the responses obtained on the left and right sides.
7.3.6
SEPs to Leg Stimulation
SEPs to leg stimulation can be obtained by stimulating the posterior tibial nerve at
the ankle while recording peripherally from the popliteal fossa, and from cervical and
scalp electrodes.
When the ankle is not accessible, as when, for example, the patient’s leg is in a
cast, the posterior tibial nerve can be stimulated at the popliteal fossa. The correct
placement of the stimulating electrodes along the pathway of the posterior tibial nerve
is shown in Figure 7.11.
Similar responses are detected from peroneal nerve stimulation, although the amplitude of individual peaks is lower. Figure 7.12 shows the correct sites for placing
the stimulation electrodes along the pathway of the peroneal nerve.
To record SEPs, the active (negative) electrode for the peripheral response is placed
above the popliteal crease, whereas the inactive (positive) electrode is placed on the
medial surface of the knee. The cervical and cortical responses can be obtained by
placing the active (negative) electrode over Cii and Cz , respectively, whereas the
inactive (positive) electrode for both responses is placed on the forehead (Fpz ).
The popliteal fossa response consists of a negative component (N9) with latency
approximately 9 msec, and it is generated by the peripheral nerve fibers [9, 66]. The
cervical component (N30) has a latency of approximately 30 msec and probably
reflects activity of nuclei in the dorsal column of the spinal cord. The most prominent
cortical component has a positive peak at about 37 msec and is followed by a negative
7.3.7
Affecting Factors
99
10 ms
1 uV
10 ms
1 uV
10 ms
1 uV
10 ms
1 uV
10 ms
1 uV
10 ms
1 uV
Figure 7.10 Typical components obtained after stimulation of the median nerve at the (a) left
and (b) right wrist.
peak at about 45 msec, forming the P37–N45 complex. The actual normal latency
values vary considerably with patient height and other factors [66].
An example of typical components obtained along the sensory pathway after stimulation of the posterior tibial nerve at the ankle is shown in Figure 7.13. Similar
peaks are detected from common peroneal nerve stimulation at the knee but, since the
total length of the neural pathway is shorter, the latencies of the cervical and cortical
components are shorter by about 10 msec.
7.3.7
Affecting Factors
Inhaled Anesthetic Agents
Nitrous oxide (N2 O) reduces the amplitude and increases the latency of cortical components in a dose-dependent fashion [43].
Inhalational anesthetics, such as Isoflurane, Halothane, and Enflurane, all decrease
the amplitude and increase the latency of the cortical responses in a dose-dependent
fashion, especially when they are administered with N2 O [43].
chapter 7: Evoked Activity
100
Figure 7.11 Placement of stimulating electrodes along the posterior tibial nerve pathway.
Figure 7.12 Placement of stimulating electrodes along the peroneal nerve pathway.
Intravenous Agents
Propofol does not affect the subcortical N13 component, but it increases the latency by
approximately 10% of the early cortical components without affecting their amplitude.
Later cortical components usually disappear [43].
Benzodiazepines (e.g., Diazepam, Midazolam) reduce the amplitude of cortical
SEP waves [42].
Barbiturates (e.g., Thiopental, Methohexital) increase SEP latency in a dosedependent fashion, with a slight amplitude decrease [43].
Etomidate has a surprising effect on the cortical SEP amplitude, which can be
augmented by as much as 200–600% [43]. However, it also increases SEP latencies.
Ketamine also increases SEP amplitude and latency [43, 21].
Opiates, such as Morphine, and synthetic narcotics, such as Fentanyl, Alfentanil,
and Sufentanil, cause a slight increase in SEP latency without affecting the amplitude [42].
7.3.7
Affecting Factors
101
10 ms
0.5 uV
10 ms
0.2 uV
10 ms
1 uV
10 ms
0.5 uV
10 ms
0.2 uV
10 ms
1 uV
Figure 7.13 Typical components obtained after stimulation of the posterior tibial nerve at
the (a) left and (b) right ankle.
Muscle relaxants, such as Saccinycholine, Pancuronium, and Vecuronium, do not
affect SEPs directly. However, they may improve SEP amplitude by reducing background muscle activity.
In general, narcotics can be administered either as bolus injection or drip infusion.
The former method will typically result in a drastic reduction of the cortical SEP
amplitude for about 15 min following the injection. On the other hand, drip infusion
of the same agent has minimal effects on SEPs. Therefore, for proper intraoperative
monitoring the latter method is preferred. Table 7.2 summarizes the effects of various
drugs most commonly used in anesthesia on the cortical SEPs.
Induced Conditions
Hypotension, induced by Nitroprusside in typical doses, has a minimal direct effect
on SEPs. However, severe hypotension (mean arterial pressure 50 mmHg or less)
results in a drastic decrease or even total loss of the cervical and cortical responses.
Hypothermia increases the latency and may slightly decrease the amplitude of
SEPs. Hyperthermia will decrease the latency of the responses by about 5% per 1◦ C,
and may also decrease their amplitude slightly.
chapter 7: Evoked Activity
102
Table 7.2 Effects of Anesthetic Agents on Cortical SEP Amplitude
and Latency
Agent
Amplitude
Latency
Nitrous Oxide (N2 O)
⇓
⇒
Inhalational Anesthetics
Isoflurane, Halothane,
Enflurane, Desflurane
⇓
⇒
Propofol
—
Barbiturates
Thiopental, Methohexital
↓
→
⇒
Etomidate
⇓
⇓
→
→
—
→
⇓
⇒
—
—
↓
→
Ketamine
Opiates
Morphine, Fentanyl,
Alfentanil, Sufentanil
Benzodiazepines
Diazepam, Midazolam
Muscle Relaxants
Saccinycholine,
Pancuronium,
Vecuronium
Hypotensive Agents
Nitroprusside,
Nitroglycerine
Note: Modest ( ↓) or significant (⇑ or ⇓) amplitude change; —: no change.
Modest (→) or significant (⇒) latency increase.
Age
Newborn babies often show a cortical N30 component after stimulation of arm nerves
and a P50 after stimulation of leg nerves [66]. SEPs gradually reach adult form and
latencies at an age between 3 and 10 years. In older adults (>60 years), the amplitude
of SEPs decreases slightly, whereas the latency increases progressively with age,
especially in the cortical components, due to decreased peripheral conduction velocity
with age [66].
Limb Length
Since absolute latencies depend on the distance between the stimulating and the
recording electrodes, it is expected that longer limbs will introduce a slight latency
increase [66].
7.3.8
7.3.8
SEP Intraoperative Interpretation
103
SEP Intraoperative Interpretation
Typical amplitude and latency values for normal SEP components are reported in
Table 7.3.
Table 7.3 Typical SEP Amplitude and Latency Values
Obtained After Median or Posterior Tibial Nerve Stimulation
Nerve
Site
Peak
Amplitude µV
Latency msec
Median
Erb’s Point
Cervical
Cortical
N9
N13
N20
P25
1.6
1.5
0.9
9
13
21
27
Popliteal Fossa
Cervical
Cortical
N9
N30
P37
N45
1.5
0.3
0.7
10
32
43
52
Posterior
Tibial
After induction and final positioning of the patient, a set of baselines is obtained
which remains on the screen for comparison throughout the case. Baseline responses
should be of familiar morphology and contain clear and reliable components. The
baselines should also be consistent with the clinical picture of the patient.
During surgery, interpretation criteria are based on detection of reliable and significant changes compared to the baselines established at the beginning of the case.
Changes mainly involve the amplitude and latency of the SEP components recorded
at different levels. A change is reliable if it is repeatable at least twice in a row;
and it is significant if the amplitude has decreased by at least 50% or the latency has
increased by at least 10% [35, 54].
As explained earlier, changes in amplitude and/or latency can result also from
perisurgical factors. Hence, successful differentiation of SEP changes due to iatrogenic factors is based on (1) evaluation of the change pattern (e.g., a sudden change
vs. a gradual change, or a change that affected the cortical component only vs. a
change that affected also the peripheral response); and (2) correlation of the change
pattern with surgical maneuvers, blood pressure, oxygen saturation, administration
of drugs, and body temperature.
In general, SEP changes due to surgical maneuvers (e.g., spinal distraction) or
ischemia (e.g., after placement of an artery clamp) are abrupt and localized (i.e.,
only one side of the body may be affected), whereas changes due to anesthesia or
body temperature changes and bolus injection of drugs are relatively slower and
generalized.
Table 7.4 summarizes the SEP changes that can be observed at various recording
levels, a plausible interpretation, and the recommended action to take.
chapter 7: Evoked Activity
104
Table 7.4 Summary of Possible SEP Changes During Intraoperative
Monitoring, Interpretation, and Possible Actions
Peripheral
Cervical
Cortical
OK
OK
OK
OK
OK
⇓
⇒Ø
OK
⇓Ø
OK
OK
⇓ ⇒Ø
⇓ ⇒Ø
⇓Ø
OK
OK
⇓
OK
⇓ ⇒Ø
⇓
⇓
OK
⇓ ⇒
⇓ ⇒
⇓ ⇒
⇓Ø
⇓Ø
⇓Ø
Interpretation
Action
Normal
None
Anesthesia change
Contact anesthesiologist
Anesthesia change or
cortical ischemia
Contact anesthesiologist
Contact surgeon
Muscle activity artifact or
faulty recording electrode or
amplifier turned off
Contact anesthesiologist
Check/change electrode
Check amplifier
Mechanical insult or
spinal cord ischemia
Contact surgeon
Contact anesthesiologist
Faulty recording electrode or
amplifier turned off
Check/change electrode
Check amplifier
Check/change electrode
Check amplifier
Muscle activity artifact
Contact anesthesiologist
Systemic change or
peripheral nerve ischemia
Contact surgeon
Contact anesthesiologist
Faulty stimulating electrode or
faulty stimulating device
Check/change electrode
Check stimulating device
Note: OK: no change; ⇓: amplitude decrease; ⇒ latency increase;
Ø: no response present.
7.4
7.4.1
DSEPs
Generation
Dermatomes are areas of skin supplied by cutaneous branches of spinal nerves. Dermatomal somatosensory evoked potentials (DSEPs) are elicited by stimulation of specific dermatomal fields. Elicited activity travels along the same pathways described
in the SEP section. Since the exact cutaneous distribution of dermatomes is still
debated, the stimulation sites used are those most commonly accepted. Figure 7.14
shows a diagram with the distribution of dermatomes over the arm and leg.
7.4.2
Use
DSEPs are used intraoperatively during procedures in which nerve root rather than
spinal cord function is at risk, for example, during lumbar spine surgery for root
decompression. Since the input of peripheral nerves into the spinal cord is spread
over several levels (spinal roots), SEPs do not provide information about the integrity
of single nerve roots. Thus, an abnormality at one level may result in a small (within
normal limits) variation of activity and be obscured by an overall apparent upkeep of
normal activity. On the contrary, DSEPs provide information that is root-specific [55,
71].
7.4.3
DSEP Features
105
Figure 7.14 Distribution of dermatomes over the arm and the leg.
7.4.3
DSEP Features
DSEPs have the same amplitude and latency features as SEPs. However, dermatomal
stimulation yields components of smaller amplitude and increased latency, since the
excited nerve fibers are smaller and fewer in number [18, 54, 71]. For the same
reason DSEPs are more difficult to record than SEPs, especially from noncephalic
electrodes.
7.4.4
Recording Procedure
Stimulation Parameters
The electrodes for cutaneous stimulation are placed a few centimeters apart within
the same dermatome. The stimulus intensity is submaximal, i.e., about 2 to 3 times
that of the sensory threshold, to avoid stimulation of the underlying tissue [18, 55].
A stimulation rate of 4.7 Hz, with a stimulus duration of 0.3 msec, is used. The low
and high filters are set at 10 and 300 Hz, respectively. Clear and reliable responses
can be obtained with approximately 500 single trials. Each side should be stimulated
independently. The most common stimulation sites are dermatomes L3 , L4 , L5 , and
S1 .
chapter 7: Evoked Activity
106
Recording Sites
When recording DSEPs, the somatotopic arrangement of the sensory cortex should
be kept in mind. The active (negative) electrodes are placed over the somatosensory
cortex at the standard C3 , C4 , and Cz locations, whereas the inactive (positive) electrode is placed on the forehead (Fpz ). The ground electrode is placed on the patient’s
shoulder. The peripheral and cervical responses are usually unclear and typically not
recorded.
7.4.5
Affecting Factors
DSEPs are affected by the same factors affecting SEPs.
7.4.6
DSEP Intraoperative Interpretation
Soon after induction and final positioning of the patient, a set of baselines is obtained
which remains on the screen for comparison throughout the case. Baseline responses
should be of familiar morphology and contain clear and reliable components. The
baselines should also be consistent with the clinical picture of the patient.
Normal DSEPs from the same limb should show about 3 msec of latency difference
from one level to the next. Additionally, the maximum latency difference between
the two limbs should be less than about 6 msec [54].
Interpretation of DSEPs follows the same guidelines as SEPs. However, the most
significant DSEP feature is latency, not amplitude. Small latency shifts, as low as
4%, may be significant and may indicate a potential root injury [18].
Also, since DSEPs show abnormalities before surgery, responses usually improve
during surgery. However, although the amount of improvement and adequacy of
decompression are correlated, the former does not necessarily constitute an absolute
indicator of the latter.
7.5
7.5.1
Brainstem Auditory Evoked Responses
Generation
Brainstem auditory evoked responses (BAERs) are elicited by auditory stimulation
and represent activity generated in the VIII cranial nerve and brainstem structures in
the rostral medulla, pons and caudal midbrain [46]. Typically, BAERs consist of five
clear waves or peaks (indicated as peak I, II, III, IV, and V), all occurring within the
first 10 msec after stimulus onset. Often, peak VI and VII are also well defined. Each
peak presumably has a specific origin along the auditory pathway, mainly ipsilateral
to the stimulated ear. Figure 7.15 shows the first five peaks seen in a typical BAER
waveform.
The putative sites of origin for wave I and II are the extracranial and intracranial
portions of the cochlear nerve, respectively [46]. Wave III is most likely generated
in the ipsilateral cochlear nucleus, whereas wave IV and V are generated in multiple
brainstem sites and do not bear a one-to-one relationship to any particular struc-
7.5.2
Use
107
1.5 ms
0.2 uV
1.5 ms
0.2 uV
Figure 7.15 Typical BAER waveform obtained after ipsilateral stimulation of the (a) left and
(b) right ear, showing peaks I through V.
tures [48]. Most likely, peaks VI and VII are of cortical origin. Figure 7.16 depicts
the commonly accepted generators along the primary auditory pathway.
Figure 7.16 Putative sites of origin of the first few BAER wave.
7.5.2
Use
BAERs are used intraoperatively to assess the functional integrity of acoustic pathway
structures, particularly those located in the brainstem. Typical situations requiring
chapter 7: Evoked Activity
108
BAER monitoring include surgery for acoustic tumors, and procedures involving the
cerebello-pontine angle and the posterior fossa.
7.5.3
BAER Features
The basic BAER features used for intraoperative analysis include measurement of
peak amplitudes, as well as peak and interpeak latencies [46, 20]. Occasionally,
normal recordings may not contain all of the peaks. Wave V is the most reliable one
and is present most of the times, along with wave I and III. Wave II is often missing,
whereas wave IV may partially or completely merge with wave V [66].
If peak I is unclear, its amplitude may be increased by increasing the stimulus
intensity and possibly decreasing the stimulation rate. The main difference between
ipsilateral and contralateral BAER is in peak I, which is unclear or absent in the contralateral recording [66]. Typical amplitude and latency values for peaks I through V
are reported in Table 7.5.
Table 7.5 Typical BAER Amplitude and Latency
Values and Interpeak Latency Differences for
Peaks I Through V
Wave
Amplitude
Latency
I
0.2
1.7
I–III
2.1
2.8
III–V
1.9
III
3.9
I–V
4.0
IV
5.1
II
V
7.5.4
0.5
Interpeak Latency
5.7
Recording Procedure
Recording Sites
Proper intraoperative monitoring for evaluation of acoustic nerve and brainstem function requires that each ear be stimulated independently. Therefore, it is necessary to
use two recording channels, one for each ear. The active (negative) electrode is placed
on the earlobe ipsilateral to the side of stimulation (A1 or A2 ), whereas the reference
(positive) electrode is placed on the vertex (Cz ). The ground electrode is located
on the forehead (Fpz ) [66, 75]. An example of such an arrangement is shown in
Figure 7.17.
This montage allows to compare activity on the affected site with activity on the
homotopic unaffected site as it propagates along the auditory pathway. However,
it is possible to make use of bilateral stimulation, when both ears are stimulated
simultaneously, if the peaks to unilateral stimulation are not clear or reliable.
7.5.4
Recording Procedure
109
Figure 7.17 BAER recording protocol.
Stimulation Approach
Auditory stimulation, commonly consists of series of clicks, which are usually delivered through foam ear inserts attached to air tube. The latter are connected to
sound generators located away from the patient’s head. The tubes introduce a latency
delay in all peaks (typical value 1 msec) which, depending on the recording system,
may or may not be accounted for automatically by the software. Reliable BAERs
are obtained after delivery of rarefaction rather than condensation click stimuli, in
which case the tympanic membrane moves away from the ear. These stimuli produce
sudden excitation and result in well-defined peaks [44, 46, 75].
A stimulus intensity of approximately 80 dB nHL2 delivered at a noninteger rate,
e.g., 11.1 Hz, is sufficient to elicit reliable BAERs and avoid synchronization with
interfering electrical noise. Each stimulus should have a duration between 0.03 and
0.1 msec. When the stimulus is applied to one ear, the sound is conducted through
the skull and may reach the opposite ear. This effect can be avoided by applying a
constant masking stimulus (typically white noise) to the contralateral ear. The noise
intensity should be about 40 dB below the stimulus intensity [20, 66].
Approximately 1200 to 1500 single trials are sufficient for reliable averaged responses, although in certain cases this number must be increased. An analysis time of
10 msec allows for all peaks of interest to fall within the observation window. Filter
settings should allow all frequencies between 30 and 3000 Hz to be recorded [46, 66].
Table 7.6 summarizes the recommended acquisition parameters for BAERs.
Table 7.6 Recommended Parameter Settings for Recording BAERs
Ear
Left
Right
Channel
Cz –A1
Cz –A2
Cz –A1
Cz –A2
Recording
Bandwidth
Sensitivity
30–3000 Hz
1 µV
Type
Click
Noise
Noise
Click
Stimulus
Intensity
Polarity
80 dB
40 dB
Rarefaction
40 dB
80 dB
Time
Base
10 msec
2 Normal hearing level (nHL) is the average threshold intensity of normal hearing young adults for a
specific type of stimuli, such as clicks, and it is measured in decibels (dB).
chapter 7: Evoked Activity
110
7.5.5
Affecting Factors
Inhalational Anesthetic Agents
Nitrous oxide (N2 O) results in a linear decrease of BAER amplitude with no change
in latency [42].
Isoflurane, Halothane, and Enflurane mildly increase BAER latencies [42].
Intravenous Agents
Propofol increases the latency of peaks I, II, and V, but it does not affect their amplitude [42].
Barbiturates (e.g., Thiopental, Methohexital) and Ketamine increase BAER interpeak latency [21].
Fentanyl and other narcotics even in large doses have minimal effect in BAERs [42].
Benzodiazepines (e.g., Diazepam, Midazolam) have minimal effect in BAERs [21].
Induced Conditions
Hypothermia increases the latency and decreases the amplitude BAERs [21, 66],
whereas hyperthermia decreases the amplitude [42] and the latency [21] of the responses. In general, BAER latencies are inversely related to temperature at a rate of
about 0.2 msec/◦ C.
Muscle relaxants, such as Saccinycholine, Pancuronium and Vecuronium, have no
effect on BAERs.
In general, most anesthetic agents in typical doses will have only minimal effects
on BAERs [20], as shown in Table 7.7.
7.5.6
BAER Intraoperative Interpretation
Typically, after induction and final positioning of the patient, a set of baselines is
obtained which remains on the screen for comparison throughout the case. Baseline
responses should contain clear and reliable components, and should also be correlated
with the clinical picture of the patient. For example, peripheral hearing loss may result
in unclear or absent peaks.
During surgery, BAER interpretation criteria are based on the detection of significant changes, compared to the baselines, mainly in the amplitude and latency of
peaks I and V, as well as the interpeak latencies from peak I to III and from III to
V. These interpeak latencies represent the peripheral and central conduction time,
respectively. BAERs are subcortical in origin and, thus, little affected by anesthetics
or small changes in the anesthesia regime [20]. Therefore, even small changes may
be significant. Traditionally, the most important criterion involves the latency and the
amplitude of peak V [48]. A change repeated twice in a row must be reported even if
the latency has increased by only 0.5 msec. A shift of 1–1.5 msec usually indicates
that some action must be taken [48].
7.6
Visual Evoked Potentials
111
Table 7.7 Effects of Anesthetic Agents on BAER
Amplitude and Latency
Agent
Amplitude
Latency
Nitrous Oxide (N2 O)
↓
—
Inhalational Anesthetics
Isoflurane, Halothane,
Enflurane, Desflurane
—
→
Propofol
—
Barbiturates
Thiopental, Methohexital
—
→
→
Ketamine
—
→
Opiates
Morphine, Fentanyl,
Alfentanil, Sufentanil
—
—
—
—
—
—
Benzodiazepines
Diazepam, Midazolam
Muscle Relaxants
Saccinycholine,
Pancuronium,
Vecuronium
Note: Modest ( ↓) amplitude change; —: no change.
Modest (→) latency increase.
7.6
7.6.1
Visual Evoked Potentials
Generation
Visual evoked potentials (VEPs) result from stimulation of the visual pathway. Activity generated in the retina leaves the eye through the optic nerve. The two optic
nerves, one from each eye, join at the optic chiasm where fibers from the nasal half of
each retina cross to the opposite side, while fibers from the temporal half do not cross.
This fiber segregation results into two optic tracts, each containing a complete representation of the contralateral hemifield of vision. The optic tracts terminate in the
thalamus and other subcortical structures. From there, through the optic radiations,
activity reaches the primary visual cortex in the occipital lobes. The gross anatomy
of the visual system is depicted in Figure 7.18.
7.6.2
Use
VEPs are used intraoperatively to assess the functional integrity of the visual pathway
during surgery for tumors or trauma involving the optic nerves, chiasm, optic tracts,
and the occipital visual cortex. VEPs are most useful in cases involving the retroorbital and parasellar regions [20, 48, 69] (see also Figure 9.4).
chapter 7: Evoked Activity
112
eyeball
optic nerve
optic tract
optic radiation
Figure 7.18 Gross anatomy of the visual system.
7.6.3
VEP Features
Intraoperative analysis of VEP features involves measurement of peak amplitudes, as
well as peak and interpeak latencies. Typical flash VEPs contain two major positive
components, P1 and P2 , found at about 100 and 170 msec after stimulus onset,
respectively. Each of the components is preceded by a negative one, N1 and N2 , at
about 70 and 140 msec, respectively. The latter components however are less clear
and stable. All components are generated by the visual cortex [20]. Figure 7.19
shows a typical VEP waveform.
7.6.4
Recording Procedure
Recording Sites
A typical montage for intraoperative monitoring includes two recording channels,
each involving one hemisphere. The active (positive) electrodes are placed on the O1
an O2 standard EEG locations, whereas the inactive (negative) electrodes are placed
on the contralateral earlobe (A2 and A1 , respectively). Alternatively, a vertex (Cz )
7.6.5
Affecting Factors
113
Figure 7.19 Typical VEPs obtained from flash stimulation.
Ground
Figure 7.20 Two alternative montages for recording VEPs.
electrode can be used as a reference for both channels. The ground is placed on the
forehead (Fpz ). An example of such an arrangement is shown in Figure 7.20.
Stimulation Approach
Flash stimuli are usually delivered through red light-emitting diodes attached on
goggles which are placed over the patient’s closed eyelids [20]. Alternatively, scleral
contact lenses may be used [44]. The more typical pattern-reversal stimuli used
in clinical settings cannot be used intraoperatively, as they require fixation from an
awake patient. Low and high frequency filters are set at 1 and 100 Hz, respectively.
The stimulus has a duration of 5 msec and is delivered at rate between 1 and 5 Hz.
The analysis time (time base) is set to 300 msec. Approximately 100 single trials are
needed for reliable VEP recordings.
7.6.5
Affecting Factors
All VEP components are strongly influenced by metabolic factors and changes in
anesthesia regime [20].
Nitrous oxide (N2 O) reduces significantly the amplitude of all components but has
a small effect on their latency [69].