Muscle fitness and its association with body mass index in children and adolescents aged 7–18 years in China: A cross-sectional study
Bạn đang xem bản rút gọn của tài liệu. Xem và tải ngay bản đầy đủ của tài liệu tại đây (1.64 MB, 10 trang )
He et al. BMC Pediatrics
(2019) 19:101
/>
RESEARCH ARTICLE
Open Access
Muscle fitness and its association with
body mass index in children and
adolescents aged 7–18 years in China: a
cross-sectional study
Huijing He1,2, Li Pan1,2, Jianwei Du3, Feng Liu4, Yuming Jin3, Jingang Ma4, Li Wang1,2, Pengben Jia3,
Zhiping Hu4 and Guangliang Shan1,2*
Abstract
Background: The present study was the first one aimed to investigate the current muscle fitness and its associated
factors among children and adolescents in mainland China.
Methods: From Nov 2013 to Jul 2014, 2283 children and adolescents aged 7–18 were recruited in Hainan and
Shaanxi Provinces in China by cross-sectional design. Information on anthropometry and muscle fitness, measured
by hand grip strength (GS), vertical jump (VJ) and sit-and-reach (SR), were collected. Analysis of covariance was
performed by using general linear regression models to identify the association between BMI and muscle fitness.
Results: The means of GS, VJ and SR in boys were 22.30 ± 11.55 kg, 22.93 ± 6.80 cm and 3.58 ± 7.31 cm, respectively,
and in girls were 16.61 ± 6.87 kg, 18.11 ± 4.08 cm and 7.18 ± 5.72 cm, respectively. GS (from 8.26 kg in the 7–8-yearold group to 27.91 kg in the 17–18 group) and SR (from 1.75 cm in the-8-year-old group to 10.12 cm in the 17–18
group) increased with age (both p for trend < 0.001). Boys had higher GS and VJ, but significantly lower SR than
girls in each age group (p < 0.001). After adjusting for age, sex, residential areas and study regions, GS increased
with elevated BMI (compared with normal weight group, the regression coefficient for thinness and overweight/
obesity were − 2.997(95%CI: −3.693 to − 2.301) and 1.220 (95%CI: 0.285 to 2.155), respectively. With the p values less
than 0.001 and 0.011, respectively). For VJ, there was no difference found between normal weight group and
overweight/obesity group (p = 0.550), but the thinness group had the lowest performance (regression coefficient =
− 2.681, 95%CI from − 3.965 to − 1.397, p < 0.001). For SR, compared with normal weight group, the regression
coefficients for thinness and overweight/obesity were − 1.313(95%CI: −2.228 to − 0.399) and − 1.623(95%CI: −3.216
to − 0.030) respectively, both p < 0.05.
Conclusions: Increased body weight may have a positive association with isometric muscle strength measured by
grip strength, but a negative one with strength of lifting the body. Sex difference was also found in the
performance of flexibility.
Keywords: Muscle fitness, Body mass index, Children, Adolescents, Health, China
* Correspondence:
1
Department of Epidemiology and Statistics, Institute of Basic Medical
Sciences, Chinese Academy of Medical Sciences, 5 Dongdansantiao,
Dongcheng District, Beijing 100005, China
2
Department of Epidemiology and Statistics, School of Basic Medicine,
Peking Union Medical College, 5 Dongdansantiao, Dongcheng District,
Beijing 100005, China
Full list of author information is available at the end of the article
© The Author(s). 2019 Open Access This article is distributed under the terms of the Creative Commons Attribution 4.0
International License ( which permits unrestricted use, distribution, and
reproduction in any medium, provided you give appropriate credit to the original author(s) and the source, provide a link to
the Creative Commons license, and indicate if changes were made. The Creative Commons Public Domain Dedication waiver
( applies to the data made available in this article, unless otherwise stated.
He et al. BMC Pediatrics
(2019) 19:101
Background
Muscle fitness is an important aspect of physical fitness
and health status [1]. It can be defined as the maximal
force or tension that a muscle or a group of muscles
could generate at a specified velocity [2]. A decrease of
muscle fitness may result in functional limitations [3]
and musculoskeletal components were found inversely
associated with metabolic risk [4, 5]. There was substantial evidence that indicated that youth muscle fitness
(MF) was an important marker of cardiovascular disease
(CVD) risk factors [6–8], as well as CVD events in children and adolescents [9]. Therefore, MF in juveniles
may be a valuable assessor of health risk factors.
Vertical jump (VJ) has been commonly used to assess
muscular power in the lower limbs and can often provide information regarding functional capacity [10].
There were previous studies that investigated the relationship between vertical jump and anthropometric
characteristics or established normative data [2, 11–13].
However, because all of these studies were not conducted in Asian children or adolescents, data on youths
in mainland China is sparse.
The sit-and-reach (SR) test is a field test used to measure hamstring and lower back flexibility [14]. Hand grip
strength (GS) is a measurement for upper body muscle
strength [15]. GS can be used as an indicator for an individual’s general muscle strength [1]. Vertical jump, hand
grip strength and sit-and-reach were considered indexes
for muscle fitness in the present study. Since the ability
to perform short-term maximal exercise varies between
populations, it is important to investigate population
specific data on MF.
Age, gender, morphological and metabolic factors have
been found as determinants in anaerobic performance
[16]. Moreover, there were previous studies that suggested that body mass index (BMI) was associated with
muscle fitness [17, 18], and that increasing weight may
be related to greater performance on muscle fitness
tests. Geographical, socioeconomic and sexual disparities
in health-related physical fitness and BMI were also observed [19, 20]. Child overweight and obesity has risen
in middle- and low- income countries [21]. Accompanied with rapid socioeconomic progress in China in the
past decades, the prevalence of overweight and obesity
in children and adolescents also increased and was believed to be associated with urbanization [22]. However,
data on MF and its relationship with BMI in Chinese
children and adolescents is sparse.
Therefore, the objective of this study was to use the
data derived from a community-based cross-sectional
study to provide information on the status of MF, as well
as its relationship with body weight, measured by BMI,
among children and adolescents aged 7–18 by gender
and age groups. To the best of our knowledge, this was
Page 2 of 10
the first study in mainland China to explore the current
situation of MF performance and its relationship with
BMI in children and adolescents.
Methods
Study design
Cross-sectional design was used in the present study.
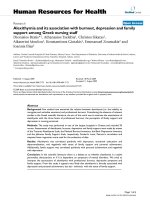
From Nov 2013 to Jul 2014, a multi-stage stratified cluster
sampling method was used to select subjects (see Fig. 1:
The flow-chart of the sampling method). In the first stage,
Shaanxi Province in Northwest China and Hainan Province in South China were selected. In the second stage,
two cities and two counties were selected from each province based on their economic status measured by local
gross domestic product (GDP). In the third stage, districts
were selected from cities, and rural townships were selected from counties. In the final stage, communities were
selected from districts in urban areas, whereas villages
were selected from townships in rural areas. All children
and adolescents lived in the selected districts and villages
were all invited to participant in the study. To guarantee a
representative sample, after each day’s field work, the age-,
sex- and urbanization-stratified participants proportion
would be calculated and compared with the local population proportion. The enrollment proportion for the next
day’s participants would be correspondingly modified if
there was a slight deviation.
Subjects
A total of 2283 children and adolescents living in Hainan (South China) and Shaanxi (Northwest China) Province participated in the study. Children and adolescents
aged 7–18 who were residents in the selected areas and
who had lived in the current residence for at least 1 year
were eligible to participate. Ethical approval was obtained from the Bioethical Committee of Institute of
Basic Medical Sciences, Chinese Academy of Medical
Sciences. All parents of the participants provided written
informed consent before the survey.
Procedures
A standard questionnaire was developed to conduct
face-to-face interview. Demographic information, such
as sex, age and residential areas, was obtained through
the parents of the subjects. Physical examinations were
conducted and collected information on anthropometry
and MF. Anthropometry included stature and weight.
Measurements on MF consisted of hand grip strength,
vertical jump and sit-and-reach. Before the survey, all interviewers and technicians completed a training program
that guaranteed their ability for using specific tools and
methods.
Stature was measured to nearest 0.1 cm using a fixed
stadiometer. Weight was measured by body composition
He et al. BMC Pediatrics
(2019) 19:101
Page 3 of 10
Fig. 1 Flow chart of the sampling method for selecting children and adolescents aged 7–18 from Nov 2013 to July 2014 in Northwest and
South China
analyzer (TANITA BC-420, Japan), with the accuracy to
the decimal level. During the anthropometric measurements, participants wore light clothing and were barefoot. BMI was calculated as weight in kilograms divided
by the square of stature in meters (kg/m2).
Vertical jump was evaluated by the Squat Jump (SJ).
During the SJ, participants were instructed to sink and
to hold a squat position for 3 s. On the count of three,
subjects were asked to jump as high as possible. Jump
with no sinking or countermovement prior to the execution was considered as a successful try. Hand grip
strength of the predominant hand of each participant
was measured two times using Jamar Hydraulic Hand
Evaluation Kit (JAMAR, UK) in a standing position. In
the sit-and-reach test, subjects were examined wearing
light clothes and no shoes. The test was performed twice
consecutively, with 30 s rest between tests. Subjects assumed a long-sitting position on the board, kept the
knees fully extended and feet dorsiflexed and positioned
flat against the foot platform. The fingertips were placed
together and adjacent to the block that laid along the
scale. The subject’s hands pushed the block forward the
scale as far as possible and the scale measurement was
recorded. Vertical jump, hand grip strength and
sit-and-reach tests were all requested to perform twice
and the larger one of each item was analyzed.
Thinness, normal weight, overweight and obesity were
defined according to World Health Organization
(WHO) ‘s criteria for children and adolescents 5–19
years old: thinness was BMI-for-age lower than 2 standard deviations below the WHO Growth Reference median; overweight was BMI-for-age greater than 1
standard deviation above the WHO Growth Reference
median; and obesity was greater than 2 standard deviations above the WHO Growth Reference median [23].
Statistical analyses
All statistical procedures were performed using SAS 9.4
(SAS Institute Inc. Cary, NC, USA). Summary results
were presented as mean (standard deviation, SD) for
continuous data and number (percentage, %) for categorical data. Data from boys and girls were analyzed
separately. Mean, standard deviation (SD), median and
interquartile range were reported for all MF tests by
gender and age groups because of the non-normal distribution of the results.
Chi-square tests or Student’s t-test (or Wilcoxon sign
test) were used to compare characteristics of participants
in the analytic sample (n = 2283). Comparison among
age groups was analyzed using ANOVA or
Kruskal-Wallis test. Cochran–Armitage test was used to
analyze the trend among age groups and BMI groups.
As it was expected that the measures of MF in this study
were possibly correlated, we further calculated correlation coefficients of the three indexes for MF using Pearson and Spearman correlation analyses. Since there were
He et al. BMC Pediatrics
(2019) 19:101
Page 4 of 10
limited number of obesity in both boys and girls, obesity
was integrated with overweight as one category, presented as overweight/obese in the results section.
Two-way ANCOVA was performed by using general
linear regression models (GLMs) to identify the association between BMI and muscle fitness (GS, VJ and SR).
In the sensitivity analyses, quantile regression models
were used to compare the results yielded by GLM.
Sub-group analyses were conducted within age-groups
to detect the possible role of age on the association between BMI and muscle fitness.
Results
Demographic and anthropometric characteristics of
participants
The analyses for this study were based on 2283 children
and adolescents (1032 boys and 1251 girls) aged 7–18
who participated in the muscle fitness tests and were
classified in three BMI categories. The demographic and
anthropometric characteristics stratified by sex were
presented in Table 1. Boys had a higher average age and
proportion of living in rural areas, and were more recruited in Shaanxi Provinces than that of girls.
The distribution of body mass index and its associated
factors
82.29% of boys and girls were normal weight, 12.66%
were underweight and 7.05% were overweight/obese.
The prevalence of underweight, normal weight and overweight/obesity in boys were 14.24, 75.78 and 9.98%, respectively, and in girls were 11.35, 84.01 and 4.64%,
respectively. The sex-specific prevalence of thinness and
overweight/obesity were presented in Additional file 1:
Table S1. The results of multi-variable logistic regression
models indicated that, boys (OR = 1.371, 95% CI: 1.065–
1.764), urban residence (OR = 0.447, 95% CI: 0.336–
0.594) and living in Shaanxi Province (OR = 0.534, 95%
CI: 0.387–0.737) were associated with thinness (reference group = normal weight). This participants showed
that who were male, living in urban areas and recruited
Table 1 Baseline characteristics of children and adolescents. N and percentage (%) for categorical data and mean and standard
deviation for continuous data
Boys (n = 1032)
Age*, year
Girls (n = 1251)
Total (n = 2283)
13.36
3.11
13.77
3.36
13.58
3.26
7–8
73
7.07
94
7.51
167
7.31
9
97
9.40
126
10.07
223
9.77
10
115
11.14
128
10.23
243
10.64
11
111
10.76
116
9.27
227
9.94
12
119
11.53
104
8.31
223
9.77
13
103
9.98
80
6.39
183
8.02
14
78
7.56
62
4.96
140
6.13
15
74
7.17
98
7.83
172
7.53
16
82
7.95
140
11.19
222
9.72
17
78
7.56
151
12.07
229
10.03
18
102
9.88
152
12.15
254
11.13
Urban
514
49.81
702
56.12
1216
53.26
Rural
516
50.00
549
43.88
1065
46.65
Shaanxi Province
333
32.27
309
24.70
642
28.12
Hainan Province
699
67.73
942
75.30
1641
71.88
*
Age-group
*
Residential areas
Study sites*
*
Stature , cm
152.55
16.13
148.67
12.19
150.43
14.24
Weight*, kg
42.11
13.87
39.2
10.63
40.51
12.28
BMI, kg/m2
17.58
3.16
17.37
2.78
17.47
2.96
Vertical jump*, cm
22.93
6.80
18.11
4.08
20.18
5.92
Hand grip strength*, kg
22.30
11.55
16.61
6.87
19.17
9.69
Sit-and-reach*, cm
3.58
7.31
7.33
7.18
5.72
7.47
*
p < 0.05 for the comparison between boys and girls
(2019) 19:101
He et al. BMC Pediatrics
Page 5 of 10
regions, BMI was found associated with GS (Table 3).
Before BMI was considered in the GLM, study regions
(Shaanxi Province) was found associated with GS (P =
0.002), but the association became nonsignificant after
adjustment for BMI (P = 0.086, Table 3).
in Shaanxi Province were more likely to be overweight/
obese, with ORs (95% CI) of 2.260 (1.594–3.203), 3.118
(2.164–4.492) and 3.668 (2.615–5.202), respectively. In
contrast, age was found inversely associated with overweight/obesity with the OR (95% CI) of 0.816 (0.769–
0.865) (Additional file 1: Table S5).
Performance on the vertical jump test
Similar to GS, sex difference was also found in VJ performance, where the means of vertical jump in boys
(22.93 ± 6.80 cm) were higher than that of girls (18.11 ±
4.08 cm). Different from hand grip strength, the variations of VJ among age groups were not as much as that
of GS, ranging from 17.74 cm in the youngest group to
21.56 cm in the 15–16-year-old group. VJ performance
varied by age groups in both sex (both p < 0.01). But for
boys, VJ seemed increased with age, and for girls, the VJ
peak was in the 11–14 age group. Boys had greater performance on VJ than girls in the age groups beyond 10
years old (Table 2).
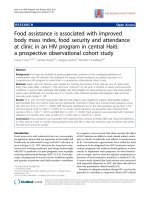
In contrast with GS, overweight/obese youth in both
boys and girls had the lowest value of VJ, the age-,
urbanization-and geographic-adjusted means of which
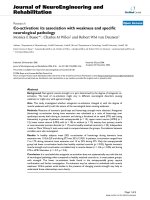
were 19.93 cm and 17.32 cm, respectively (Fig. 2b). The
linear regression model also revealed that BMI categories were inversely associated with VJ (Table 3). Moreover, sex disparity was found in the relationship between
VJ and BMI when comparing the adjusted means of MF
Performance of muscle fitness and its associations with
body mass index
Performance on the hand grip strength test
The means of GS in boys and girls were 22.30 ± 11.55 kg
and 16.61 ± 6.87 kg, respectively. Positive age dependent
linear trends were observed in both sexes (Table 2, both
p < 0.001). The means of GS increased from 8.26 kg in
the 7–8-year-old group to 27.91 kg in the 17–18-year-old group. Before adjusting for age, the normal weight
group had the highest GS in both sexes. However, the
age-, urbanization-and geographic-adjusted means of GS
indicated a significantly increasing trend of GS with elevated BMI categories, from 18.11 kg to 24.06 kg in boys
and 14.39 kg to 18.88 kg in girls, in which the overweight/obese group had the highest GS in both sexes.
The comparisons of the adjusted means of GS among
BMI groups were presented separately by sex in Fig. 2a.
GLMs also supported the idea that increased BMI was
positively associated with GS performance (Table 3).
After adjusting for age, sex, residential areas and study
Table 2 The means and medians of hand grip strength, vertical jump and sit-and-reach in age groups across sex among children
and adolescents aged 7–18 in China, 2014
Age
GS (kg)
n
Mean
VJ (cm)
SD
Median
IQR
n
mean
SR (cm)
SD
Median
IQR
n
mean
SD
Median
IQR
Boys
7–8
73
9.40
2.49
10.00
3.00
42
18.69
3.22
18.65
5.00
45
0.20
5.66
− 0.60
7.70
9–10
208
11.88
3.29
12.00
4.00
142
18.58
4.09
18.25
6.10
149
0.60
5.79
1.50
7.40
11–12
223
15.62
5.19
15.00
6.00
157
21.46
5.52
21.30
7.60
165
1.01
5.88
1.80
7.80
13–14
178
24.29
7.19
24.00
10.00
119
23.81
6.23
22.90
7.70
122
3.91
6.86
3.90
8.80
15–16
155
32.79
7.61
32.00
9.00
93
25.76
7.17
25.30
9.30
94
7.89
7.52
7.65
10.50
17–18
179
36.91 †
6.75
36.00
9.00
119
28.47
7.08
28.40
9.10
120
8.34
7.51
8.10
8.55
Overall
1016
22.30
11.55
19.00
20.00
672
22.93
6.80
21.95
9.05
695
3.58
7.31
3.30
9.30
93
7.36*
2.14
8.00
2.00
42
17.06
4.00
16.50
5.10
67
2.79*
5.19
2.50
6.40
*
3.08
10.00
4.00
142
17.48
4.08
17.00
5.50
183
3.48*
5.75
3.40
7.20
*
Girls
7–8
9–10
252
9.70
*
*
11–12
218
14.47
4.80
14.00
7.00
157
19.15
4.03
19.20
4.50
162
4.72
6.19
4.35
7.30
13–14
142
18.54*
4.47
18.00
6.00
119
18.51*
4.13
18.35
5.65
102
7.48*
6.81
7.85
9.60
15–16
238
*
20.79
4.53
21.00
6.00
*
17–18
302
22.58*
4.76
22.00
5.00
1245
16.61 †
Overall
*
6.87
17.00
11.00
93
*
18.11
4.09
18.00
5.20
180
10.34
6.70
10.45
8.45
119
17.98*
3.96
17.95
5.80
236
11.02*
6.89
11.80
9.25
672
*
930
7.33 †
7.18
7.20
9.80
SD standard deviation, IQR interquartile range
*
p < 0.001 for the comparison between boys and girls
†p < 0.001 for the linear trend tests using Cochran–Armitage method
18.11
4.08
18.00
5.50
*
He et al. BMC Pediatrics
(2019) 19:101
Page 6 of 10
Fig. 2 Adjusted means and standard errors of hand grip strength, vertical jump and sit-and-reach across sex and BMI categories in children and
adolescents aged 7–18 in China. Adjusted covariates included age, urbanization and geographic areas
performance. In boys, underweight and normal weight
groups had greater VJ values (22.46 cm and 23.27 cm, respectively) than overweight/obese group (19.93 cm)
(both p < 0.001), but no difference between underweight
and normal weight children and adolescents (both p
values more than 0.1, see Fig. 2b). However, in girls, the
VJ performance had no statistical difference among the
three BMI groups (all p > 0.05, Fig. 2b).
Performance on the sit-and-reach test
Significant sex difference was observed on the performance of sit-and-reach test. The means of SR in boys and
girls were 3.58 cm and 7.33 cm, respectively. In every age
group, girls had higher SR value than that of the boys
(Table 2). Similar to GS, there was an increasing trend
with age in both sexes (p < 0.001). The GLM indicated
that lean youth may have lower value on SR performance.
The age-, urbanization-and geographic-adjusted means of
SR in each BMI category, stratified by sex, also revealed a
positive association between BMI and SR performance,
with an exception of no statistical significance in male
youth.
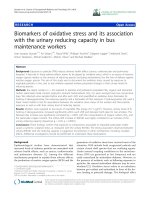
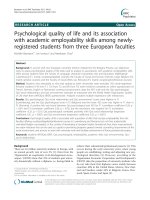
The correlation among muscle strength tests
The correlation analyses suggested that all three MF indexes had significant mutual correlations (all p < 0.01) in
both sexes. In boys, GS and VJ had the strongest correlation. By contrast, in girls, GS and VJ seemed to have a
much weaker correlation, while still being statistically
significant (p = 0.001). Details were presented in Fig. 3.
Furthermore, we compared the adjusted means of VJ
in GS quartile groups. Similar comparisons of SR were
also made to study the relationships among these three
muscle fitness tests. Consistent with the correlation
He et al. BMC Pediatrics
(2019) 19:101
Page 7 of 10
Table 3 The association between BMI and hand grip strength, vertical jump and sit-and-reach in children and adolescents aged 7–
18 in China, 2014
Hand grip strength
Model 1a
B
SE
95% CI
p
B
SE
95% CI
Age
2.253
0.038
2.178
2.328
< 0.001
2.275
0.038
2.200
2.350
< 0.001
Sex (ref = girls)
6.546
0.239
6.077
7.015
< 0.001
6.580
0.236
6.117
7.043
< 0.001
Model 2
p
Residential areas (ref = rural)
0.196
0.255
−0.304
0.695
0.442
0.203
0.256
−0.704
0.298
0.427
Shaanxi (ref = Hainan)
0.822
0.270
0.293
1.352
0.002
0.467
0.272
−0.065
0.999
0.086
Thinness (ref = normal weight)
–
–
–
–
–
−2.997
0.355
−3.693
−2.301
< 0.001
Overweight/obesity (ref = normal weight)
–
–
–
–
–
1.220
0.477
0.285
2.155
0.011
0.475
0.046
0.385
0.564
< 0.001
0.442
0.046
0.351
0.532
< 0.001
Vertical jump
Age
Sex (ref = girls)
5.107
0.267
4.584
5.631
< 0.001
5.179
0.267
4.656
5.701
< 0.001
Residential areas (ref = rural)
−0.145
0.304
−0.740
0.450
0.632
0.109
0.309
−0.496
0.715
0.723
Thinness (ref = normal weight)
–
–
–
–
–
0.230
0.385
−0.524
0.985
0.550
Overweight/obesity (ref = normal weight)
–
–
–
–
–
−2.681
0.655
−3.965
−1.397
< 0.001
0.998
0.056
0.888
1.108
< 0.001
0.981
0.057
0.870
1.092
< 0.001
Sit-and-reach
Age
Sex (ref = girls)
−3.193
0.327
−3.834
−2.553
< 0.001
− 3.114
0.327
− 3.754
− 2.473
< 0.001
Residential areas (ref = rural)
0.180
0.371
−0.907
0.548
0.628
−0.177
0.379
−0.921
0.566
0.640
Thinness (ref = normal weight)
–
–
–
–
–
−1.313
0.467
−2.228
−0.399
0.005
Overweight/obesity (ref = normal weight)
–
–
–
–
–
−1.623
0.813
−3.216
−0.030
0.046
BMI body mass index (kg/m2), B regression coefficient, SE standard error of regression coefficient, CI confidence interval
a
Model 1: adjusted for age, sex, residential areas and study sites; Model 2: adjusted for age, sex, residential areas, study sites (if applicable) and BMI. Age was
analyzed as continuous data; sex, BMI, residential areas and study sites were set as dummy variables
Fig. 3 The relationship between muscle fitness indexes. A-1: relationship between GS and VJ in boys; A-2: relationship between GS and VJ in
girls; B-1: relationship between GS and SR in boys; B-2: relationship between GS and SR in girls; C-1: relationship between VJ and SR in boys; C-2:
relationship between VJ and SR in girls. GS: hand grip strength; VJ: vertical jump; SR: sit-and-reach
He et al. BMC Pediatrics
(2019) 19:101
analyses, there were increasing trends for both VJ and
SR with elevated GS quartiles in boys and girls (p <
0.001, Additional file 1: Figure S2).
Discussion
To the best of our knowledge, this was the first study to
investigate MF, measured using GS, VJ and SR, and its
relationship with BMI in children and adolescents in
China. As physical fitness and MF may play key roles in
health in children and adolescents, it would be helpful
to understand muscle function early in life and its relationship to BMI. This may be of value to understand the
changes in the ability to have ideal function and health
later in life.
By using a multi-stage stratified sampling method, we
selected representative data reflecting BMI and MF
among 7–18 years old children and adolescents. There
were more participants recruited in Hainan than in
Shaanxi Province because of longer recruitment time,
better local government support and larger population
size. Compared with Hainan, Shaanxi had more boys
(51.87% vs. 42.60%) and more participants living in rural
areas (63.08% vs. 40.27%) but their age distribution was
similar (p = 0.588). Since we performed analyses by sex
separately, and mostly adjusted by regions or urban/rural
areas, the disproportion of socioeconomic characteristics
in the two study sites would not cause severe bias in the
study conclusions.
There were sex differences on BMI and MF in the
study. Consistent with other relevant studies [20, 24],
boys had higher stature in the same age group than girls,
with the exception of the age groups below 10, and
seemed to increase keep rising with similar rate through
the 7–18 years stage. The stature of girls increased with
age, but the rate fell after 11–12 years. Boys had higher
prevalence of overweight/obesity than girls, especially in
the ages 9–12.
China is a developing country with highly unbalanced
regional development. In this study, regional and
urban-rural disparities on BMI categories were identified. Compared with children and adolescents from Hainan Province, located in South China, subjects from
Shaanxi Province had lower prevalence of thinness and
higher prevalence of overweight/obesity. This sex and
regional difference may be attributed to diversity of genomic backgrounds, physiology and environmental factors, such as different socioeconomic status (SES),
nutrition status and physical exercises. Previous studies
revealed that in developing countries, youths from a
higher SES were more likely to be obese than youths
from a lower SES [25, 26]. Studies have also shown that
youths with higher SES and from urban areas were more
likely to be obese than those from lower SES and from
rural areas [27, 28]. Shaanxi province comprised more
Page 8 of 10
subjects from urban areas than that from Hainan, which
may partially explain the higher prevalence of overweight/obesity and lower prevalence of thinness.
Based on our study, MF, except VJ, was found increased with age. In general, boys had higher GS and VJ
until older age when GS and VJ values became similar
to those of girls. Consistent with other studies, GS in
boys accelerated specifically after the age of 12 [29, 30].
Compared with US children and adolescents (with an
average performance value of 26.3 kg in the age 7 group
and 79.7 kg in the age 15 group in boys) [18], Chinese
youths had much lower GS value. This difference may
be attribute to the vast disparity of genetic background
and high prevalence of physical inactivity in Chinese
children and adolescents [31].
There were limited data on the relationship between
VJ and BMI, and thus its correlation with other MF indexes. Only a few studies described the VJ performance
in certain populations, such as athletes or sports players
[32, 33]. As a predictor of bone health, higher VJ may
indicate a better status of bone mineral density [34]. The
performance of SR, in which girls were of much greater
performance than boys, indicated that girls may have
better hamstring and hip flexibility [35]. Based on the result of logistic models, the regional difference disappeared after BMI was adjusted, implying that the
original regional difference on MF was mainly caused by
BMI disproportion between the two geographic areas.
The stratification analyses revealed that BMI may play
key role in influencing MF. Increased BMI was positively
associated with GS but normal weight group had the
greatest performance of VJ and SR. Previous studies on
US population and Taiwanese Chinese population had
also observed the association between physical fitness
and body weight. In Ervin’s study [18] on US population
aged 6–15, results found that BMI was associated with
strength. Studies on Taiwanese Chinese population
showed that muscle strength and physical fitness were to
be found associated with obesity [17, 36, 37]. However,
our study was the first one in mainland China to explore
the current situation of MF and its relationship with
body weight.
In the sub-group analyses, BMI was associated with VJ
and SR only in relatively younger age groups (Additional file 1: Table S6), which may imply that age could
modify the association between BMI and muscle fitness.
Further study with larger sample size needs to be done
to clarify this possible modification.
The study had some limitations: Firstly, we did not assess maturation level of the participant, which may be a
factor of great influence on fitness test and BMI. Secondly, the absence of detailed information on living environments, dietary patterns and physical activity limited
our study on exploring other determinants of body
He et al. BMC Pediatrics
(2019) 19:101
weight and MF. Thirdly, we did not measure the
test-retest reliability for SR, GS and VJ, and therefore we
were not able to obtain the coefficient of variation for
each. Fourthly, in Shaanxi Province, we only collected
data on hand grip strength, which limited us to be able
to study the regional difference on VJ and SR. Nonetheless, we were still able to use GS as a predictor for total
muscle strength in children and adolescents [1]. The
three indexes of MF were correlated with each other and
the difference on GS among regions was representative
to some extent to reveal geographic disparities on MF in
the study population. Because dynamometer was more
portable and the test of grip strength was much safer
among elder population, hand grip strength test could
be used as a feasible and important measurement for
muscle strength in a much broader population. Lastly,
we did not calculate the sampling weights because of the
difficult to obtain the denominator, which was the total
number of qualified participants in the survey areas.
This may limit the generalizability to other studies.
Conclusions
Our study was the first study to describe the current
situation of MF status assessed by GS, VJ and SR in children and adolescents in China, with representative data
for further exploration in other related study fields. It
also explored the relationship between MF and BMI and
found that increased body weight may have a positive
association with isometric muscle strength measured by
grip strength, but a negative one with strength of lifting
the body. Sex difference was also found in the performance of flexibility. This study may provide evidence of
the role of BMI on muscle fitness for clinicians and researchers based on the increasing prevalence of childhood obesity, as well as for policy makers to develop
sex-specific strategies on body weight management and
muscle performance promotion among children and adolescents in China.
Additional file
Additional file 1: Table S1–1. The age and sex specific proportions of
thinness, normal weight and overweight/obesity in Urban/Rural areas
among participants aged 7–18, 2014. Table S1–2. The age and sex
specific proportions of thinness, normal weight and overweight/obesity
in different study sites among participants aged 7–18, 2014. Table S2.
The age and sex specific means of hand grip strength stratified by BMI
categories among children and adolescents aged 7–18, 2014. Table S3.
The age and sex specific means of vertical jump stratified by BMI
categories among children and adolescents aged 7–18, 2014. Table S4.
The age and sex specific means of sit-and-reach stratified by BMI categories among children and adolescents aged 7–18, 2014. Table S5. The associated factors of BMI among participants aged 7–18 years in China,
2014. Table S6. The association between BMI and muscle fitness in children and adolescents aged 7–18 in China, stratified by age groups, 2014.
Figure S1. Arithmetical means and deviations of hand grip strength, vertical jump and sit-and reach in sexes and age groups among children
Page 9 of 10
and adolescents aged 7–18, stratified by BMI categories. Figure S2. the
adjusted means and standard errors of vertical jump and sit-and-reach,
stratified by GS quartiles, in boys and girls aged 7–18 in mainland China.
Covariates included residential areas and study sites, and BMI was adjusted using the LSMEANS statement in the GLM procedure in SAS. GS:
hand grip strength; VJ: vertical jump; SR: sit-and-reach; Q: quartiles of grip
strength. (DOCX 667 kb)
Abbreviations
ANCOVA: Analysis of covariance; ANOVA: Analysis of variance; BMI: Body
mass index; CI: Confidence interval; CVD: Cardiovascular disease;
GLM: General linear regression model; GS: Hand grip strength; MF: Muscle
fitness; OR: Odds ratio; SD: Standard deviation; SR: Sit-and-reach; VJ: Vertical
jump; WHO: World health organization
Acknowledgements
This study was supported by the Key Basic Research Program of the Ministry
of Science and Technology of China (Grant No. 2013FY114100) and CAMS
Innovation Fund for Medical Sciences (CIFMS), Grant No. 2016-I2M-2-004 and
2018-I2M-1-001. We appreciate all the participants and staff members from
Hainan and Shaanxi Provincial Centers for Disease Control and Prevention.
We also gratefully appreciate Yvonne Li for language editing, and Guangjin
Zhu, Fen Dong, Ke Wang, Guodong Xu, Guoju Li, Haiying Gong and Yanlong
Li for their efforts in the field work.
Funding
This study was supported by the Key Basic Research Program of the Ministry
of Science and Technology of China (Grant No. 2013FY114100), CAMS
Innovation Fund for Medical Sciences (CIFMS), Grant No. 2016-I2M-2-004 and
2018-I2M-1-001. The funders had no role in study design, data collection and
analysis, decision to publish, or preparation of the manuscript.
Availability of data and materials
The datasets generated and/or analyzed during the current study are not
publicly available due to management rules by the study funder but are
available from the corresponding author on reasonable request.
Authors’ contributions
Conceptualization, GS and HH; methodology, GS and HH; software, HH;
validation, GS, HH and LW; formal analysis, HH; investigation, GS, LP, JD, FL,
YJ, JM, LW, PJ and ZH; resources, GS, JD and FL; data curation, HH;
writing—original draft preparation, HH; writing—review and editing, HH, LW
and GS; visualization, HH; supervision, GS and LP; project administration, GS
and LP; funding acquisition, GS and HH. All authors read and approved the
final manuscript.
Ethics approval and consent to participate
Ethics approval was obtained from the Bioethical Committee of Institute of
Basic Medical Sciences, Chinese Academy of Medical Sciences. All
participants provided written informed consent by their parents before the
survey.
Consent for publication
This manuscript does not contain any individual person’s data in any form.
Competing interests
The authors declare that they have no competing interests.
Publisher’s Note
Springer Nature remains neutral with regard to jurisdictional claims in
published maps and institutional affiliations.
Author details
1
Department of Epidemiology and Statistics, Institute of Basic Medical
Sciences, Chinese Academy of Medical Sciences, 5 Dongdansantiao,
Dongcheng District, Beijing 100005, China. 2Department of Epidemiology
and Statistics, School of Basic Medicine, Peking Union Medical College, 5
Dongdansantiao, Dongcheng District, Beijing 100005, China. 3Hainan
Provincial Center for Disease Control and Prevention, Haikou 570203, Hainan
He et al. BMC Pediatrics
(2019) 19:101
Province, China. 4Shaanxi Provincial Center for Disease Control and
Prevention, Xi’an 710054, Shaanxi Province, China.
Received: 17 January 2019 Accepted: 31 March 2019
References
1. Wind AE, Takken T, Helders PJM. Is grip strength a predictor for total muscle
strength in healthy children, adolescents, and young adults. Eur J Pediatr.
2010;169:281–7.
2. Tounsi M, Aouichaoui C, Elloumi M, Dogui M, Tabka Z, Trabelsi Y. Reference
values of vertical jumping performances in healthy Tunisian adolescent. Ann
Hum Biol. 2014;42(2):117–25.
3. Takken T, Elst E, Spermon N, Helders PJM, Prakken ABJ, van der Net J. The
physiological and physical determinants of functional ability measures in
children with juvenile dermatomyositis. Rheumatology. 2003;42:591–5.
4. Fraser BJ, Schmidt MD, Huynh QL, Dwyer T, Venn AJ, Magnussen CG.
Tracking of muscular strength and power from youth to young adulthood:
longitudinal findings from the childhood determinants of adult health
study. J Sci Med Sport. 2017;20(10):927–31.
5. Grontved A, Ried-Larsen M, Moller NC, Kristensen PL, Froberg K, Brage S,
Andersen LB. Muscle strength in youth and cardiovascular risk in young
adulthood (the European youth heart study). Br J Sports Med. 2015;49(2):
90–4.
6. Fahs CA, Heffernan KS, Ranadive S, Jae SY, Fernhall B. Muscular strength is
inversely associated with aortic stiffness in young men. Med Sci Sports
Exerc. 2010;42(9):1619–24.
7. Ramírez-Vélez R, Rodrigues-Bezerra D, Correa-Bautista JE, Izquierdo M,
Lobelo F. Reliability of health-related physical fitness tests among
Colombian children and adolescents: the FUPRECOL study. PLoS One. 2015;
10(10):e140875.
8. Mason C, Brien SE, Craig CL, Gauvin L, Katzmarzyk PT. Musculoskeletal fitness
and weight gain in Canada. Med Sci Sports Exerc. 2007;39(1):38–43.
9. Timpka S, Petersson IF, Zhou C, Englund M. Muscle strength in adolescent
men and risk of cardiovascular disease events and mortality in middle age:
a prospective cohort study. BMC Med. 2014;12:62.
10. Bui HT, Farinas M, Fortin A, Comtois A, Leone M. Comparison and analysis
of three different methods to evaluate vertical jump height. Clin Physiol
Funct I. 2015;35(3):203–9.
11. Ramirez-Velez R, Correa-Bautista JE, Lobelo F, Cadore EL, Alonso-Martinez
AM, Izquierdo M. Vertical jump and leg power normative data for
Colombian schoolchildren aged 9-17.9 years: the FUPRECOL study. J
Strength Cond Res. 2017;31(4):990–8.
12. Taylor MJ, Cohen D, Voss C, Sandercock GR. Vertical jumping and leg power
normative data for English school children aged 10-15 years. J Sports Sci.
2010;28(8):867–72.
13. Aouichaoui C, Trabelsi Y, Bouhlel E, Tabka Z, Dogui M, Richalet JP, Buvry AB.
The relative contributions of anthropometric variables to vertical jumping
ability and leg power in Tunisian children. J Strength Cond Res. 2012;26(3):
777–88.
14. Baltaci G, Un N, Tunay V, Besler A, Gerceker S. Comparison of three different
sit and reach tests for measurement of hamstring flexibility in female
university students. Br J Sports Med. 2003;37(1):59–61.
15. Ervin RB, Wang C, Fryar CD, Miller IM, Ogden CL. Measures of muscular
strength in U.S. children and adolescents. NCHS Data Brief. 2012;2013(139):1–8.
16. Van Praagh E, Dore E. Short-term muscle power during growth and
maturation. Sports Med. 2002;32(11):701–28.
17. Liao Y, Chang SH, Miyashita M, Stensel D, Chen JF, Wen LT, Nakamura Y.
Associations between health-related physical fitness and obesity in
Taiwanese youth. J Sports Sci. 2013;31(16):1797–804.
18. Ervin RB, Fryar CD, Wang C, Miller IM, Ogden CL. Strength and body weight
in US children and adolescents. Pediatrics. 2014;134:e782.
19. Garber MD, Sajuria M, Lobelo F. Geographical variation in health-related
physical fitness and body composition among Chilean 8th graders: a
nationally representative cross-sectional study. PLoS One. 2014;9(9):e108053.
20. Zhang Y, Zhao J, Chu Z. Socioeconomic inequalities in abdominal obesity
among children and adolescents in Shandong, China. Int J Cardiol. 2014;
174(3):842–3.
21. Lobstein T, Jackson-Leach R, Moodie ML, Hall KD, Gortmaker SL, Swinburn
BA, James WPT, Wang Y, McPherson K. Child and adolescent obesity: part of
a bigger picture. Lancet. 2015;385(9986):2510–20.
Page 10 of 10
22. Zhang Y, Zhao J, Chu Z. Prevalence of overweight and obesity among
children and adolescents is associated with urbanization in Shandong,
China. Int J Cardiol. 2014;176(3):1212–3.
23. WHO. Overweight and obesity. Available at />fact-sheets/detail/obesity-and-overweight. Accessed 24 July 2018.
24. Zhang YQ, Li H. Reference charts of sitting height, leg length and body
proportions for Chinese children aged 0-18 years. Ann Hum Biol. 2015;42(3):
223–30.
25. Silva DA. Socioeconomic inequalities in abdominal obesity in Brazilian
female adolescents: a national-based study. Eur J Pediatr. 2013;172(12):
1665–70.
26. Ji CY, Cheng TO. Prevalence and geographic distribution of childhood
obesity in China in 2005. Int J Cardiol. 2008;131(1):1–8.
27. Zhang Y, Wang Z, Zhao J, Chu Z. Prevalence of overweight and obesity
among children and adolescents in Shandong, China: urban–rural disparity.
J Trop Pediatrics. 2016;62(4):293–300.
28. Liu H, Fang H, Zhao Z. Urban–rural disparities of child health and nutritional
status in China from 1989 to 2006. Econ Hum Biol. 2013;11(3):294–309.
29. Ploegmakers JJ, Hepping AM, Geertzen JH, Bulstra SK, Stevens M. Grip
strength is strongly associated with height, weight and gender in
childhood: a cross sectional study of 2241 children and adolescents
providing reference values. J Physiother. 2013;59(4):255–61.
30. Butterfield SA, Lehnhard RA, Loovis EM, Coladarci T, Saucier D. Grip strength
performances by 5- to 19-year-olds. Percept Mot Skills. 2009;109(2):362–70.
31. Chen Y, Zheng Z, Yi J, Yao S. Associations between physical inactivity and
sedentary behaviors among adolescents in 10 cities in China. BMC Public
Health. 2014;14(1):744.
32. Wong PL, Chamari K, Dellal A, Wisloff U. Relationship between
anthropometric and physiological characteristics in youth soccer players. J
Strength Cond Res. 2009;23(4):1204–10.
33. Chen KT, Yang RS. Effects of exercise on lipid metabolism and
musculoskeletal fitness in female athletes. World J Gastroenterol. 2004;10(1):
122–6.
34. Baptista F, Mil-Homens P, Carita AI, Janz K, Sardinha LB. Peak vertical jump
power as a marker of bone health in children. Int J Sports Med. 2016;37(8):
653–8.
35. Chillon P, Castro-Pinero J, Ruiz JR, Soto VM, Carbonell-Baeza A, Dafos J,
Vicente-Rodriguez G, Castillo MJ, Ortega FB. Hip flexibility is the main
determinant of the back-saver sit-and-reach test in adolescents. J Sports Sci.
2010;28(6):641–8.
36. Hsieh P, Chen M, Huang C, Chen W, Li C, Chang L. Physical activity, body
mass index, and cardiorespiratory fitness among school children in Taiwan:
a cross-sectional study. Int J Environ Res Public Health. 2014;11(7):7275–85.
37. Huang YC, Malina RM. Body mass index and individual physical fitness tests
in Taiwanese youth aged 9-18 years. Int J Pediatr Obes. 2010;5(5):404–11.