2D and 3D numerical evaluation of dam break wave on an obstacle
Bạn đang xem bản rút gọn của tài liệu. Xem và tải ngay bản đầy đủ của tài liệu tại đây (904.31 KB, 6 trang )
BÀI BÁO KHOA H C
2D AND 3D NUMERICAL EVALUATION OF DAM-BREAK
WAVE ON AN OBSTACLE
Le Thi Thu Hien1; Do Xuan Khanh1
Abstract: The aim of this paper is to investigate the capability of the 2D and 3D numerical models
to simulate sudden dam break flows in the presence of an obstacle. The 2D-FV model is proposed
based on Finite Volume method (FVM) to solve shallow water equations. The commerciallyavailable CFD software package Flow-3D solved Navier-Stock equations along the volume of fluid
(VOF) method to track the location of the free surface at the air water interface. Very good
agreement of several hydraulic characteristics such as water level profile, flooding map, velocity
map and force versus time history due to dam-collapse wave exerted on the obstruction produced
by both presented models can be observed.
Keywords: 2D-FV, Flow-3D, dam break wave, obstacle.
1. INTRODUCTION *
Dam failures have been responsible for
devastating consequences such as loss of life or
destruction of property because of extreme
flooding in the downstream valley. The
assessment of the capability of structures to
withstand flood actions is useful in emergency
planning. Numerical models are useful in
investigating and predicting possible flooding
scenarios, which can then be used to formulate
suitable flood hazard mitigation measures.
Some models solved the shallow water
equations (Aureli et al., 2015; Sandra Soares
Frarao et al., 2008), whereas some models use
3D turbulence model (Kang et al., 2012). Much
attention was paid to the hydrodynamic
parameters of dam-break flows, such as
velocity, discharge and free surface profile in
the channel. However, the hydrodynamic forces
acting on the structures which is one of the most
important factor to evaluate the effect of dambreak flow to downstream structure is still
ignorable. This is not because it is not
important, but it is because the dam-break flow
is very fast, dangerous and very difficult to
measure the force accurately. Therefore, the
1
Division of Hydraulics, Thuyloi University
KHOA H C K THU T TH Y L I VÀ MÔI TR
number of studies related to force due the
collision between the dam-break flow and an
obstacle is still limited.
This paper aims to compare the capability of
2D shallow water, 3D Eulerian models to
estimate the effect of obstacle on the dam-break
wave. The 2D-FV model adopted is a finite
volume method which is solved by Godunov
type, second order accuracy in space and time
obtained by MUSCL technique. The 3D model
is the Flow 3D commercial package.
2. NUMERICAL MODEL
2.1. 2D shallow water equations
The 2D-FV model has been constructed for
predicting dam break flow, which introduced in
several author’s works (Le, 2014, 2017). The model
is used the finite volume method (FVM) for
integrating the shallow water equations (SWE)
numerically, MUSCL technique is applied to obtain
second order accuracy in space and time. Cartesian
mesh is used to generate the numerical domain.
The shallow water equations (SWEs) are
derived from depth-integrating the NavierStokes equations and assuming hydrostatic
pressure distribution. If the kinetic and turbulent
viscous terms are neglected, a conservation law
of the two-dimensional non-linear shallow water
equations (2D-NSWE):
NG - S 62 (9/2018)
105
(1)
;
(2)
Here t is time; x and y are the Cartesian
coordinates; q represents the flow variable
vector consisting of h, uh and vh; u and v are
defined as the depth-averaged velocities in x and
y directions, respectively; f and g are flux
vectors in x and y directions, respectively; the
bed and friction slope source term So and Sf are
expressed according to the following
definitions:
;
(3)
Where z denote the bed elevation and n is
Manning coefficient.
With hypothesis the pressure is hydrostatic,
the net force perpendicular to the vertical wall at
each time step was estimated by using
momentum equation applied for the control
volume taken around obstacle. The total force
(including hydrostatic load and momentum flux
term) calculated for each cell adjacent to the
two walls normal to the x-direction; in case the
computational mesh is Cartesian with size
∆x×∆y and the solid wall is parallel to the y-axis
(along the column i), at the time level n:
(4)
The model, namely 2D-FV, based on the
above numerical method is developed by the
first author of this paper and validated with
several test cases (Le, 2014).
2.2 3D Eulerian
In this study, a three-dimensional dam-break
flow was simulated by using Flow-3D model, a
powerful commercial software based on finite
volume method (Flow-3D user’s manual). One
of the main characteristic of this dam-break
flow (turbulent flow) is fluctuating velocity
fields which result in the mixing of transported
quantities like momentum and energy. Because
of the high frequencies of the fluctuations it is
difficult to simulate directly many practical
problems due to their high computational cost.
Therefore, the time-average equations are used
106
instead of instantaneous equations to avoid the
small scales issues and reduce the number of
equations.
The time-average process can be called
Reynolds
decomposition.
For
velocity
components:
ui = ui + ui'
Thus the Reynolds-averaged Navier-Stockes
(RANS) equations can be expressed as:
∂ui
=0
∂xi
∂u′u ′
∂ui
∂u
∂ 2ui
1 ∂p
+uj i = −
+ν
− i j + gi
∂t
∂x j
∂x j ∂x j ∂x j
ρ ∂xi
(5)
where u is average velocity, p is average
pressure, g is gravitational acceleration
The additional term u’iu’j are called Renolds
stress and must be modelled by a turbulent
model to solve the equation (5). In this study
Renormalization Group (RNG) turbulent model
was employed for simulation due to its high
accuracy in comparison with other available
turbulent model in Flow 3D such as k, k and e
(Kermani et al., 2014).
In order to simulate the dam-break flows and
their impact to an obstacle, the flow region is
subdivided into rectangular cells which each
cell has their own local average value of
dependent variables. All boundaries of the
computational domain were assumed to be rigid
walls except for the top boundary (constant
atmospheric pressure) and the downstream end
boundary (free out flow) (Fig. 1). To estimate
KHOA H C K THU T TH Y L I VÀ MÔI TR
NG - S 62 (9/2018)
the force acting on the obstacle, the force is
assumed to include only two terms which are
hydrostatic load and momentum flux. As the
results, the total force in longitudinal (x)
direction was considered as a sum of elemental
forces calculated in each cell adjacent to the two
walls normal to x direction.
3. RESULTS AND DISCUSSION
3.1. Case study
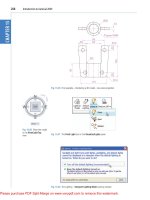
Figure 1. Configuration experimental set up
In order to evaluate the effect of an obstacle
on dam-break wave by numerical method, an
experiment done by Aureli et al., 2015 was used
as a case study. The set-up sketched is presented
in the Figure 1. The facility consisted in a 2,6m
long and 1,2m wide rectangular tank divided
into two compartments. The initial water depth
in reservoir is 0,1m, while at the floodable area
is dry. To created dam-break wave, a 0,30 m
wide gage placed in the middle was set up and
can be quickly opened by a simple man handle
pulley system. Manning coefficient n is set
equal to 0,007 and three boundaries at the
upstream and at both sides are close except at
the downstream is slip boundary. An obstacle is
located at the center of domain.
3.2. Numerical result and discussion
In 2D-FV model, a 5mm square mesh was
chosen. This mesh size was also recommended
and used in the simulation done by Aureli et al.,
2015 with the stability constraint was
introduced by assuming the Courant number
equal 0,9. Figure 2 shows simulated water depth
before obstruction obtained by three model
including 2D-FV model, Flow 3D and 2D
shallow model performed by Aureli 2015 at t =
0,38s and t=1,44s. The formation of a hydraulic
jump in front of obstacle is predicted by all
three models with a maximum water depth of
aproximately 7-8 cm. The water level profies
before hydraulic jump obtained by 3 models
were well matching. However the predicted
shapes of the hydraulic jump by both two 2D
models are worse than Flow 3D model due to
their governing-depth averaged equations.
Figure 3 presented several captured images
showing the process of the flooding wave freely
spreads to the downstream area simulated by
2D-FV model and Flow 3D model. There is a
similarity in in both 2 models showing the
collision process. In 0,38 second after the
breach opening, the flood wave started reaching
to the obstacle and forming an upward-moving
jet in front of the wall. At 0,71s and 1,44 s the
flow went around the obstacle and flooded to
downstream area.
Figure 2. Water depth profiles at y=60cm before obstruction at t=0,38s and t= 1,44s.
KHOA H C K THU T TH Y L I VÀ MÔI TR
NG - S 62 (9/2018)
107
a)
b)
Figure 3. Flooding maps obtained by a) 2D-FV and b) Flow 3D at t = 0,38s; 0,71s and 1,44s
Figure 4 shows the velocity distribution
obtained by 2D-FV model and Flow 3D in
several moments. Both results indicated the
maximum velocity located before hydraulic
jump in front of the wall. Figure 5a is the result
done by Aureli et al., 2015 presenting the
comparison of the total force by time simulated
by server models (2D and 3D) and experimental
data. Figure 5b is the numerical load time
histories simulated by 2D FV model and Flow
3D. The results indicate that both 2D models
gave the similar total force profile which has
only one peak with the maximum value is
around 7N. The peaking time was poorly
represented. It must be at around 0,7 second
instead of 1,4 second. It is because of the 2D
shallow approximation derives from the key
assumption that vertical accelerations are
negligible. Therefore, it cannot reproduce two
peaks of force profile.
a)
b)
Figure 4. Magnitude velocity maps obtained by
a) 2D-FV model and b) Flow 3D at t = 0,38s; 0,71s and 1,44s.
Meanwhile, this characteristic could be well
captured by all above 3D models. In comparison
with solution of two 3D models in Aureli’s
work, numerical result of force-time history
obtained by Flow-3D is much better, especially,
108
after 1,5s. The profile of force-time is good
matched with empirical solution including 2
maximum values (around 7N and 6N,
respectively) and their peaking time (at 0,7
second and 1,4 second, respectively).
KHOA H C K THU T TH Y L I VÀ MÔI TR
NG - S 62 (9/2018)
a)
b)
- Experimental
Figure 5. Comparision of load time histories simulated by several numerical model and
experimental data a) Aureli et al., 2015 b) present study
b)
a)
Figure 6. Comparision of load impluse time histories simulated by several numerical
model and experimental data a) Aureli et al., 2015 b) present study
Figure 6 illustrates load impulse time
histories. The results simulated by both 2D
models (author’s model and Aureli) are similar.
Both of them, however, are over estimated in
comparing with experimental data. In the time
of 3 second, the difference between them is
around 2,5N. In addition, all above 3D models
except Flow 3D also are over estimated,
however their differences are much smaller.
Flow 3D presents as the most suitable model in
simulating force acting on an obstacle. The
accumulated total force at 3 second is wellmatching with the observed data which is
approximately 11,8N.
KHOA H C K THU T TH Y L I VÀ MÔI TR
4. CONCLUSION
The achievement of this paper is used both 2D
and 3D models to reproduce a case study of dam
break flow acting to an obstruction. An 2D-FV
numerical model was proposed based on FVM
with high order accuracy in space and time to
solve SWEs and a commercial software Flow-3D
is applied to obtain several hydraulic
characteristics such as: water depth profile,
inundation maps of water depth and magnitude of
velocity. Force time and load impulse time history
are also calculated by both selected model. The
results show that, there is a good agreement
between water depth and velocity simulated by
NG - S 62 (9/2018)
109
both proposed models. Unfortunately, doublepeak trend of force time relation could not be
predicted by2D-FV model. However, it still can
estimate the maximum value of the total force
acting on an obstacle. Meanwhile, numerical
simulation of force time history and load impulse
time history indicated that Flow-3D is the most
suitable model. It can simulate more closely to
experiment data published by Aureli et al., 2015 in
comparison with the other 3D model. In next
study, the impact of group of obstacle on dam
break flow will be considered.
REFERENCE
F. Aureli, A. Dazzi, A. Maranzoni, P. Mignosa, R. Vacondio (2015). “Experimental and numerical
evaluation of the force due to the impact of a dam break wave on a structure”. Advances in
Water Resources, 76, 29-42.
Sandra Soares-Frazao; Yves Zech (2008). “Dam-break flow through an idealized city”. J.
Hydraulic Research, 46(5), 648–65.
S. Kang, F. Sotiropoulos (2012). Numerical modeling of 3D turbulent free surface flow in natural
waterways. Advances in Water Resources, 40,23-36
Le T.T.H (2014). “2D Numerical modeling of dam break flows with application to case studies in
Vietnam”, Ph.D thesis, University of Brescia, Italia.
Le Thi Thu Hien, Vu Minh Cuong (2017). “Studying an efficient second order accurate scheme for
solving two-dimensional shallow flow model”, Tạp chí Thủy lợi và Môi trường, 60, 117-124.
Kermani, E. F. and Barani, G. A (2014). "Numerical simulation of flow over spillway based on
CFD method" Scientia Iranica A, 21(1), 91-97
Tóm tắt:
NGHIÊN CỨU MÔ HÌNH TOÁN HAI CHIỀU VÀ BA CHIỀU TRONG ĐÁNH GIÁ
ẢNH HƯỞNG CỦA VẬT CẢN TỚI SỰ LAN TRUYỀN SÓNG VỠ ĐẬP
Bài báo này nghiên cứu khả năng của mô hình toán 2 chiều và 3 chiều trong mô phỏng dòng chảy
lũ chịu ảnh hưởng của vật cản. Mô hình 2 chiều 2D-FV do tác giả xây dựng dựa trên phương pháp
thể tích hữu hạn để giải hệ phương trình nước nông hai chiều. Mô hình thương mại 3 chiều Flow3D dựa trên phương pháp VOF để giải hệ phương trình Navier-Stokes cũng được sử dụng. Những
kết quả tính toán như quá trình mực nước, bản đồ ngập lụt về độ sâu, lưu tốc hay lực tác dụng bằng
hai phương pháp trên được phân tích so sánh với kết quả theo phương pháp số hay thực nghiệm
của Aureli và nnk, 2015 cho thấy sự phù hợp cao.
Từ khóa: 2D-FV; Flow-3D, dòng chảy do vỡ đập, vật cản.
Ngày nhận bài:
30/5/2018
Ngày chấp nhận đăng: 08/8/2018
110
KHOA H C K THU T TH Y L I VÀ MÔI TR
NG - S 62 (9/2018)