Iron homeostasis in Arabidopsis thaliana: Transcriptomic analyses reveal novel FITregulated genes, iron deficiency marker genes and functional gene networks
Bạn đang xem bản rút gọn của tài liệu. Xem và tải ngay bản đầy đủ của tài liệu tại đây (4.63 MB, 22 trang )
Mai et al. BMC Plant Biology (2016) 16:211
DOI 10.1186/s12870-016-0899-9
RESEARCH ARTICLE
Open Access
Iron homeostasis in Arabidopsis thaliana:
transcriptomic analyses reveal novel FITregulated genes, iron deficiency marker
genes and functional gene networks
Hans-Jörg Mai1, Stéphanie Pateyron2,3 and Petra Bauer1,4*
Abstract
Background: FIT (FER-LIKE IRON DEFICIENCY-INDUCED TRANSCRIPTION FACTOR) is the central regulator of iron
uptake in Arabidopsis thaliana roots. We performed transcriptome analyses of six day-old seedlings and roots of six
week-old plants using wild type, a fit knock-out mutant and a FIT over-expression line grown under ironsufficient or iron-deficient conditions. We compared genes regulated in a FIT-dependent manner depending on
the developmental stage of the plants. We assembled a high likelihood dataset which we used to perform
co-expression and functional analysis of the most stably iron deficiency-induced genes.
Results: 448 genes were found FIT-regulated. Out of these, 34 genes were robustly FIT-regulated in root and
seedling samples and included 13 novel FIT-dependent genes. Three hundred thirty-one genes showed
differential regulation in response to the presence and absence of FIT only in the root samples, while this was
the case for 83 genes in the seedling samples. We assembled a virtual dataset of iron-regulated genes based on
a total of 14 transcriptomic analyses of iron-deficient and iron-sufficient wild-type plants to pinpoint the best
marker genes for iron deficiency and analyzed this dataset in depth. Co-expression analysis of this dataset
revealed 13 distinct regulons part of which predominantly contained functionally related genes.
Conclusions: We could enlarge the list of FIT-dependent genes and discriminate between genes that are
robustly FIT-regulated in roots and seedlings or only in one of those. FIT-regulated genes were mostly induced,
few of them were repressed by FIT. With the analysis of a virtual dataset we could filter out and pinpoint new
candidates among the most reliable marker genes for iron deficiency. Moreover, co-expression and functional
analysis of this virtual dataset revealed iron deficiency-induced and functionally distinct regulons.
Keywords: Plants, Arabidopsis, Iron homeostasis, FIT, Differential gene expression, Microarray
Background
Iron is an essential micronutrient for plants but excess
iron can be toxic. Hence, plant iron homeostasis is
tightly regulated. Strategy I plants take up reduced iron.
First, the rhizosphere is acidified by proton extrusion to
solubilize Fe3+, then Fe3+ is reduced to Fe2+ which is finally taken up into the root epidermis cell by a specific
* Correspondence:
1
Institute of Botany, Heinrich Heine University Düsseldorf, Universitätsstraße
1, Building 26.13, 02.36, 40225 Düsseldorf, Germany
4
CEPLAS Cluster of Excellence on Plant Sciences, Heinrich Heine University
Düsseldorf, Düsseldorf, Germany
Full list of author information is available at the end of the article
transporter [1–3]. In Arabidopsis thaliana, belonging
to the group of Strategy I plants, the P-type H+-ATPase
AHA2 extrudes protons into the rhizosphere [4]. Ferric
iron is reduced by the ferric chelate reductase FRO2
(FERRIC REDUCTION OXIDASE 2) which is induced
by iron deficiency in the root epidermis [5, 6]. Finally,
ferrous iron is translocated into the root cell by IRT1
(IRON-REGULATED TRANSPORTER 1) [7–10]. Expression of AHA2, FRO2 and IRT1 is regulated by FIT
(FER-LIKE IRON DEFICIENCY-INDUCED TRANSCRIPTION FACTOR) [11–14]. Even under strong
constitutive FIT expression IRT1 and FRO2 are induced
© 2016 The Author(s). Open Access This article is distributed under the terms of the Creative Commons Attribution 4.0
International License ( which permits unrestricted use, distribution, and
reproduction in any medium, provided you give appropriate credit to the original author(s) and the source, provide a link to
the Creative Commons license, and indicate if changes were made. The Creative Commons Public Domain Dedication waiver
( applies to the data made available in this article, unless otherwise stated.
Mai et al. BMC Plant Biology (2016) 16:211
only under iron deficient conditions [11] and ectopic
expression of IRT1 and FRO2 in leaves only occurs
under iron deficiency [12]. Hence, FIT activity is posttranslationally regulated [12], and FIT protein-protein
interactions have been found that can explain this behavior [15–17]. Loss-of-function mutants of fit exhibit
symptoms of iron starvation like chlorosis, reduced
growth and lethality [11, 12, 18].
To gain better understanding of the gene regulatory
processes transcriptomic analyses with regard to iron
homeostasis in A. thaliana have been performed with diverse results. Iron deficiency causes activation of distinct
functional modules such as the ‘transportome’ which,
among others, includes genes that are involved in transition metal detoxification [19]. Ethylene signaling-related
genes and a number of iron-responsive genes are
expressed in an ethylene-dependent manner such as FIT,
IRT1, NAS1, NAS2, FRD3 and the gene of a 2OG-Fe(II)
oxygenase family protein [20]. EIN3/EIL1 appear to be
required for reorganization of the photosystems to reduce photo-oxidative damage and this could also be
achieved under iron deficiency by EIN3/EIL1-mediated
increase of iron uptake [16]. Copper deficiency causes
secondary iron deficiency in Arabidopsis and leads to
up-regulation of IRT1 and FRO2 [21]. There is crosstalk
between copper and iron uptake and phosphate starvation and there are indications for different functions of
copper under iron deficiency and phosphate starvation
[22]. microRNAs were demonstrated to negatively regulate CuSOD (copper containing superoxide dismutase)
genes allowing increased CuSOD expression to functionally replace FeSODs (iron containing superoxide dismutases) under iron deficiency in A. thaliana rosette leaves
[23]. Time course transcriptomic analyses showed that
distinct sets of genes are up- and down-regulated at different time points after induction of iron deficiency [24].
Another time course experiment revealed that PYE
(POPEYE) is involved in iron homeostasis by regulating
genes such as FER1, FER4, OPT3, NAS4, FRO3,
NRAMP4 and FRD3 [25].
Based on results of many microarray analyses, the
creation and analysis of co-regulatory networks of
iron-responsive genes have gained increasing interest.
Prominent publicly available tools for such network
analyses are ATTED II [26] and STRING [27]. Coexpression and interaction network analyses may help
identify further important genes as potential targets
of future investigations and hence contribute to discover new aspects of the plant’s physiological reaction
to iron deficiency and the respective underlying control mechanisms. For example, co-expression analyses
revealed multiple subnetworks for iron homeostasis
functions including the PYE-BTS regulon [25] and
iron uptake including FIT targets like IRT1. Some of
Page 2 of 22
these genes are robust markers for iron deficiency in
A. thaliana roots [13].
So far, there are only few known marker genes for iron
deficiency [13]. A number of FIT-dependent genes have
been determined in a previous study using the fit-1 mutant [14] which is a promoter T-DNA insertion line with
residual FIT expression [11]. Furthermore, this study has
been performed using ATH1 Affymetrix chips which to
this date lack a number of genes including important
iron homeostasis-related genes such as FIT and FRO2. It
can be speculated that fit1-1 plants display a rather
intermediate reaction to iron deficiency due to their residual FIT expression and that not all FIT-dependent
genes could have been detected due to the use of ATH1
Affymetrix chips. So far, no FIT over-expression line has
been employed in the search for FIT-dependent genes
which might contribute to refinement of the search results. Furthermore, it has not yet been investigated
whether the developmental stage of the plants influences
the dependence of genes on FIT. To address these questions, we conducted transcriptomic analyses of roots of
six week-old plants and six day-old seedlings that were
exposed to iron-deficient or iron-sufficient conditions
using the Arabidopsis thaliana Col-0 (wild type), fit-3
(exon T-DNA insertion fit knock-out) [12] and HA-FIT
(pCaMV35S::HA7-FIT) over-expression lines [28]. We
stringently filtered the genes by their expression patterns
to obtain a comprehensive list of known and novel FITdependent genes. This same filtering process was then
used to determine genes that were affected by the presence of FIT only in roots or seedlings, respectively. Furthermore, we assembled a virtual dataset based on our
gene expression data plus previous transcriptomic analyses to pinpoint more reliably iron deficiency-regulated
marker genes and used this dataset to perform coexpression analysis.
Results and discussion
Overview of the microarray analyses
A number of genes that are potentially regulated by FIT
have been pointed out by Colangelo and Guerinot [11].
Since the study has been performed with wild-type Col0 and the fit-1 knock-out mutant [11, 14] which is a promotor T-DNA line, we decided to extend the analytic
strategy by using a fit knock-out mutant with the strong
fit-3 allele which is an exon T-DNA knock-out mutant
[12, 14] (hereafter termed fit) and by including the FIToverexpression line HA-FIT 8 (hereafter called HA-FIT)
[28] to define a full set of genes that are regulated by
FIT. We first analyzed the transcriptomic changes in
roots of six week-old wild type, fit and HA-FIT plants
that were exposed to iron-sufficient (+Fe) or irondeficient (-Fe) conditions for 7 days prior to harvesting
and the same analyses were conducted with six-day-old
Mai et al. BMC Plant Biology (2016) 16:211
whole seedlings that were grown on +Fe or -Fe
(Additional file 1: Figure S1). Using CATMA twocolor microarrays we performed seven pairwise comparisons with three biological and two technical
replicates, respectively. In three pairwise comparisons
we measured the transcriptomic changes upon iron
deficiency within the lines. These include wild type
-Fe vs. +Fe, fit -Fe vs. +Fe and HA-FIT -Fe vs. +Fe.
We refer to these comparisons as ‘intra-line comparisons’. The four other pairwise comparisons monitor
transcriptomic differences between the lines at a
given iron status. They include the comparisons fit
vs. wild type and HA-FIT vs. wild type both at +Fe
and -Fe, respectively. We refer to them as ‘inter-line
comparisons’. To validate the seedling data, we performed RT-qPCR with selected iron homeostasisrelated genes (Additional file 2: Figure S2). The root
data were previously validated by [29].
Gene regulation in roots from six-week-old Arabidopsis
plants
First, when gene expression in roots of six-week-old wild
type plants was analyzed, a total number of 7402 genes
was found regulated in at least one out of the seven
comparisons (Additional file 3: Dataset 1). Four thousand one hundred genes were found regulated in the
intra-line comparisons (Fig. 1a). Out of these, 2287 were
up-regulated (Fig. 1b) and 2361 were down-regulated
(Fig. 1c) at -Fe in at least one of the comparisons. The
least number of regulated genes at +Fe versus -Fe was
found in fit. Four hundred fifty-four genes were induced
and 438 genes repressed in fit. The number of induced
and repressed genes in wild type was 1256 and 1418, respectively, while in HA-FIT 1303 genes were induced
and 1555 genes repressed under -Fe. The less pronounced transcriptomic reaction to -Fe in fit can be explained by the fact that fit plants suffered from iron
deficiency although they were grown on iron-sufficient
medium. Hence, the primary and secondary adaptations
to -Fe that can be observed in wild type and HA-FIT
may have largely been established in fit plants under
+Fe already. Additionally, the lack of FIT may cause the
inability to induce or repress a subset of genes as soon
as further iron deficiency is sensed. The little overlaps
between fit and the other lines and the large overlaps between wild type and HA-FIT (Fig. 1b and Fig. 1c) also
suggest that six-week-old fit roots react in a more distinct way to iron deficiency while wild type and HA-FIT
show similar responses.
In the inter-line comparisons a total of 6899 genes
were found regulated (Fig. 1d). More genes were regulated in the inter-line comparisons (Fig. 1d) than in the
intra-line comparisons (Fig. 1a). Hence, differential gene
expression between the different lines at a given iron
Page 3 of 22
supply is larger than the reaction of the respective lines
to iron deficiency. Out of the 6899 regulated genes in
the inter-line comparisons 3290 were up-regulated
(Fig. 1e) and 4497 were down-regulated (Fig. 1f ). Thirteen percent (888 genes) were found up- and downregulated in different lines suggesting a regulation by
FIT. Whereas the number of regulated genes was lower
in fit under -Fe than in the other lines, the transcriptomic changes between fit and wild type were much
greater than between HA-FIT and wild type. In conclusion the transcriptomes of HA-FIT and wild type are
more similar to each other while six-week-old fit plants
display distinct transcriptomic adaptations.
Gene regulation in 6-day-old Arabidopsis seedlings
In six-day-old seedlings 3802 genes were found regulated
in at least one of the seven comparisons (Additional file 3:
Dataset 2). With 2769 genes the number of regulated
genes in the inter-line comparisons of six-day-old seedlings (Fig. 1g) is 32 % less than in roots of six week-old
plants. Out of these, 1435 genes were found induced
(Fig. 1h) and 1393 genes were found repressed (Fig. 1i)
under -Fe. The overlap between the up- and downregulated genes was only 2 % (59 genes). This suggests
that gene regulation upon iron deficiency is very specific
to the investigated lines. In contrast to the six-week-old
roots we could not observe a large difference in the number of regulated genes that overlap between fit, wild type
and HA-FIT seedlings in the intra-line comparisons. All
three lines shared roughly similar numbers of regulated
genes, being reduced or repressed. The number of genes
regulated in seedlings of the single lines did not differ as
much as in roots of six-week-old plants. Therefore, seedlings of the three lines react more similarly to iron deficiency than roots of adult plants.
In the inter-line comparisons 2742 genes were found
regulated (Fig. 1j). Out of these, 1263 genes were induced (Fig. 1k) and 1597 genes were repressed (Fig. 1l)
in at least one of the comparisons. The intersection between up- and down-regulated genes was 4 % (118
genes). This again suggests that the observed regulations
were predominantly specific to the compared lines. In
contrast to the six-week-old roots where the most pronounced regulation in the intra-line comparisons was
found in fit this could not be observed in the six-day-old
seedlings. Five hundred fifty-seven genes were induced
(Fig. 1k) and 788 were repressed under iron-deficient
conditions in fit seedlings compared to wild type (Fig. 1l)
under -Fe. Only 54 genes were induced (Fig. 1k) and 29
genes were repressed under +Fe in fit seedlings compared to wild type (Fig. 1l). From the lower numbers of
regulated genes and the higher line and comparisonspecific gene regulation we conclude that the six-day-old
seedlings display a transcriptomic reaction that is
Mai et al. BMC Plant Biology (2016) 16:211
Page 4 of 22
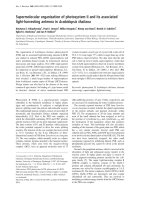
Fig. 1 Venn diagrams of the differentially expressed genes in the six-week-old Arabidopsis roots (a-f) and six-day-old seedlings (g-l). Intra-line
comparisons in roots (a-c): Total numbers of regulated genes (a), induced genes (b) and repressed genes (c). Inter-line comparisons in roots (d-f):
Total numbers of regulated genes (d), induced genes (e) and repressed genes (f). Intra-line comparisons in seedlings (g-i): Total numbers of
regulated genes (g), induced genes (h) and repressed genes (i). Inter-line comparisons in seedlings (j-l): Total numbers of regulated genes (j),
induced genes (k) and repressed genes (l). Intersection between regulated genes in roots and seedlings (m). The diagrams were created using
the unnamed online tool provided by VIB/U Gent, Bioinformatics & Systems Biology, Technologiepark 927, B-9052 Gent, Belgium; accessible
through />
distinct from the differential gene expression in sixweek-old roots at the large scale.
Taken together, the total number of regulated genes
was larger in the roots of six-week-old plants than in
seedlings (Fig. 1m). Seedlings may programmed to
quickly increase their biomass and uptake and utilization
of nutrients may be generally enhanced, which could
lead to a less responsive gene regulation upon iron deficiency. Iron is also stored in vacuoles of the embryo
[30–32] so there is a pool of usable iron which might
contribute to a less pronounced transcriptomic reaction
to iron-deficient medium in young seedlings. Another
possible explanation could be that older roots are fully
differentiated and react differently and more intensively
to iron deficient conditions. However, among the 7402
and 3802 genes regulated in roots and seedlings, respectively, there is a comparably large intersection of 2156
genes which still points towards a certain common transcriptomic reaction in roots and seedlings (Fig. 1m). Furthermore, the numbers of regulated genes show that the
influence of FIT on gene expression is higher than the
impact of iron deficiency alone. In roots of HA-FIT and
wild type more genes were regulated in -Fe versus +Fe
than in fit and the intersection between HA-FIT and
Mai et al. BMC Plant Biology (2016) 16:211
wild type was larger than between fit and the two other
lines. This is in agreement with the fact that fit mutants
cannot react to iron deficiency as wild type or the FIT
over-expressor.
Hierarchical clustering of the microarray results in iron
homeostasis-enriched gene clusters
To detect regulatory patterns we performed hierarchical
clustering with the datasets from the six-week-old Arabidopsis roots (Additional file 3: Dataset 1), the six-day-old
seedlings (Additional file 3: Dataset 2) and the combination of both (Additional file 3: Dataset 3). We highlighted
clusters in which the two confirmed FIT-regulated marker
genes IRT1 and FRO2 [12], AT3G13610, AT3G07720,
MTPA2 and COPT2 [11] were present.
Page 5 of 22
In the dataset generated from the six-day-old seedlings
the FIT-regulated marker genes appeared in five clusters
of which four were directly adjacent and contained a
total of 65 genes (Fig. 2a). The fifth cluster was distinct
from the others and contained 30 genes (Fig. 2b). In
the dataset from the six-week-old roots, the marker
genes were found in one cluster containing 33 genes
(Fig. 2c). Finally, in the combined dataset of both roots
and seedlings, the marker genes were found in a single
cluster containing 65 genes (Fig. 2d, Additional file 4:
Figure S3). When focusing on the genes that clustered
with FIT-regulated marker genes, 14 genes were found
co-regulated in a robust manner in three clusters.
Thirty-three genes were found in two of three clusters
and 85 genes were present in only one out of the three
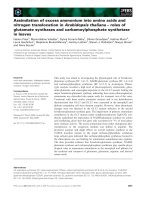
Fig. 2 Hierarchical clustering of the genes that were differentially regulated in six-day-old seedlings (a and b). Roots of six-week-old plants (c)
and in the combined analysis (d). The respectively compared lines and conditions are indicated by numbers. 1: fit +Fe vs. WT +Fe. 2: fit -Fe vs. WT
-Fe. 3: HA-FIT +Fe vs. WT +Fe. 4: HA-FIT -Fe vs. WT -Fe. 5: HA-FIT -Fe vs. HA-FIT +Fe. 6: WT -Fe vs. WT +Fe. 7: fit -Fe vs. fit +Fe. The left panels
show an overview over the whole cluster analysis and the right panel shows a magnified view of the respective cluster that is indicated by the
red triangle and that contains known iron homeostasis-related genes. Red color represents up-regulation and green color represents down-regulation.
The cluster analysis has been performed with Genesis [76]
Mai et al. BMC Plant Biology (2016) 16:211
clusters (Additional file 5: Table S1). Among the genes
that were found in the clusters there were 38 previously
FIT-associated ones. Ten of these were present in all
three clusters, 16 in two of three clusters and 12 in one
of the three clusters (Additional file 5: Table S1).
Stringent expression pattern filtering revealed robustly
FIT-dependent genes
To detect novel FIT targets, we performed stringent filtering of the 9048 regulated genes in the combined dataset of roots and seedlings (Additional file 3: Dataset 3).
At first, we reduced the list of all genes to those genes
that were found regulated in at least one comparison in
seedlings and roots, thereby reducing the number to
2156 genes (intersection in Fig. 1m, Additional file 3:
Dataset 4).
Next, we performed a consecutive four-step filtering of genes by scatter plot analysis. In the first step
we selected 99 genes that were induced by -Fe in
the wild type in the comparisons WT -Fe vs. WT
+Fe in roots and seedlings (Fig. 3a, Additional file 5:
Table S2). In the second step we selected genes that
were down-regulated under iron deficiency in the fit
knock-out mutant compared to wild type (Fig. 3b,
Additional file 5: Table S2). In the third step we filtered out genes that were up-regulated in the comparison HA-FIT at -Fe vs. +Fe in roots and seedlings
(Fig. 3c, Additional file 5: Table S2) since the FIT
target genes IRT1 and FRO2 are only induced under
iron deficient conditions in a constitutive FIT overexpressor [11, 12, 28]. In the last step, we selected
genes that were not induced in fit vs. WT under
+Fe in roots and seedlings (Fig. 3d, Additional file 5:
Table S2). As a result, we ended up with 32 genes
that we considered as positively FIT-regulated (Tables 1
and 2, Additional file 5: Table S2). As these were found
regulated by FIT in roots and seedlings, we refer to them
as robustly FIT-induced. Out of these 32 genes, 21 have
been related to FIT before [11, 12]. However, 11 genes
(AT1G32380, AT1G14182, AT1G14185, AT2G35850,
AT4G17680, AT1G09560, AT5G62420, AT5G45105,
AT5G55250, AT1G53635 and AT5G46060) are novel FITinduced genes previously not known in the FIT regulation
context (Table 2). A comparison of the expression pattern
analysis with the results of hierarchical clustering shows
that all the genes found in the expression analysis were
also present in at least one of the iron- and FIT-associated
clusters (Additional file 5: Table S1).
The question whether there are also FIT-repressed
genes was addressed with the inverse analysis as above.
In the first step we selected 63 genes that were repressed
by -Fe in the wild type in the comparisons WT -Fe vs.
WT +Fe in roots and seedlings (Fig. 4a). In the second
step we selected genes that were up-regulated under iron
Page 6 of 22
deficiency in the fit knock-out mutant compared to wild
type (Fig. 4b). In the third step we filtered out genes that
were down-regulated in the comparison HA-FIT at -Fe
vs. +Fe in roots and seedlings (Fig. 4c). In the fourth
step, we selected genes that were not repressed in the
absence of FIT under +Fe in the comparison fit +Fe vs.
WT +Fe in roots and seedlings (Fig. 4d). As a result, we
ended up with 2 genes that we considered as repressed
by FIT (Tables 1 and 2). The two FIT-repressed genes
were SERINE CARBOXYPEPTIDASE-LIKE 31 (SCPL31,
AT1G11080) and ZRT/IRT-LIKE PROTEIN 2 (ZIP2,
AT5G59520). SCPL proteins are annotated to have peptidase activity by sequence similarities but a number of
SCPL, instead of peptidase activity, act as lyases and
acyltransferases in the production of secondary metabolites involved in herbivory defense or UV protection
[33]. However, the catalytic activity and the biological
processes in which SCPL31 might be involved have not
yet been determined. Excess zinc causes secondary iron
deficiency in A. thaliana and iron uptake genes are induced to compensate for secondary iron deficiency [34].
Another zinc transporter, ZIP8, belongs to the robustly
FIT-induced genes (Tables 1 and 2). It can be speculated
that under iron deficiency and in situations of excess
zinc, zinc homeostasis could be modulated by FIT to reduce the negative effects of zinc on iron homeostasis.
Expression pattern analysis in six-day-old seedlings and
six-week-old roots reveals distinct sets of FIT-dependent
genes
We used the same filtering as above to detect genes regulated in a FIT-dependent manner only in six-day-old
seedlings or only in six-week-old roots, respectively. In
seedlings, out of the 3802 input genes (red circle in
Fig. 1m, Additional file 3: Dataset 2) that were found
regulated in one of the comparisons, 285 were expressed
at a higher level in WT -Fe vs. +Fe and expressed at a
lower level in fit -Fe vs. WT -Fe (Fig. 5a). Out of these
285 genes, 96 were expressed at a higher level in the
comparison HA-FIT -Fe vs. HA-FIT +Fe and not
expressed at a higher level in the comparison fit -Fe vs.
fit +Fe (Fig. 5b). Among these 96 genes there were all
the 32 previously found FIT-regulated genes, as expected. Hence, 64 genes were regulated in a FITdependent manner exclusively in six-day-old seedlings
(Additional file 5: Table S3).
In roots of six-week-old plants, out of 7402 total regulated genes (blue circle in Fig. 1m, Additional file 3:
Dataset 1) 840 were expressed at a higher level in WT
-Fe vs. +Fe and expressed at a lower level in fit -Fe vs.
WT -Fe (Fig. 5c). Out of these 840 genes 299 were
expressed at a higher level in HA-FIT -Fe vs. HA-FIT
+Fe and not expressed at a higher level in fit -Fe vs. fit
+Fe (Fig. 5d). Also these genes comprised the 32
Mai et al. BMC Plant Biology (2016) 16:211
Page 7 of 22
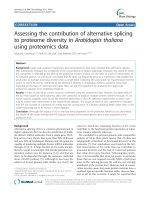
Fig. 3 Four-step filtering of FIT-induced genes using scatterplot analysis of log2 fold changes of gene expression in the respective comparison in
seedlings (horizontal) and roots (vertical). The blue dots represent genes that did not match the requirement and were removed in the subsequent
step. The yellow dots represent gene expression patterns that matched the requirement and which were used as the input for the subsequent pattern
analysis. The respective zero-points are indicated by red crosshairs. The genes filtered in a were used as input in b. The genes filtered in b were used
as input in c. The genes filtered in c were used as input in d. The yellow dots in d represent the 32 FIT-induced genes (Tables 1 and 2)
previously determined FIT-regulated genes, so that finally, 267 genes were found regulated in a FITdependent manner exclusively in six-week-old roots
(Additional file 5: Table S4).
Among the 64 genes that were regulated in a FITdependent manner specifically in seedlings there were
15 genes that have been previously associated with FIT
[11] (Additional file 5: Table S3) and those that were
regulated in a FIT-dependent manner specifically in sixweek-old roots comprised 9 previously FIT-associated
genes (Additional file 5: Table S3). Thus, including the
above-described 32 robustly FIT-induced genes, our
results cover 45 out of the 72 previously known FITassociated genes [11]. Three hundred eighteen FITdependent genes were not previously described as
FIT-regulated genes. Eleven of them were stably regulated in a FIT-dependent manner in six-day-old seedlings and in six-week-old roots. Forty-nine were
regulated in a FIT-dependent manner exclusively in
six-day-old seedlings. Two hundred fifty-eight genes
displayed a FIT-dependent regulation pattern exclusively in six-week-old roots. Interestingly, 11 of the
Mai et al. BMC Plant Biology (2016) 16:211
Page 8 of 22
Table 1 Expression patterns of the robustly FIT-regulated genes in six-day-old seedlings and six-week-old roots
The genes were identified by expression pattern analysis. The selection criteria for FIT-induced genes were: induced under -Fe in WT, repressed in fit vs. WT at -Fe,
induced in HA-FIT under -Fe and not induced in fit vs. WT at +Fe (Fig. 3). Those for FIT-repressed genes were: repressed under -Fe in WT, induced in fit vs. WT at -Fe,
repressed in HA-FIT under -Fe and not repressed in fit vs. WT at +Fe (Fig. 4). These criteria had to be met in roots and seedlings. The given values are log2(fold change).
Up-regulation is indicated by red background, down-regulation is indicated by green background and insignificant or below threshold regulation is indicated by black
background. AGI codes of genes that have been previously associated with FIT [11] and the FIT-regulated gene FRO2 [11, 12] are written normal, the AGI codes of the
novel robustly FIT-induced genes are written in bold and underlined. For more information on the genes see Table 2
seedling-specific FIT-dependent genes were not found
regulated at all in six-week-old roots. These are considered generally seedling-specific. One hundred sixtyfive of the FIT-dependent genes in six-week-old roots
were not found regulated at all in seedlings. These are
considered generally root-specific. The generally rootspecific genes contained four previously known FIT
targets which coincides with the fact that previously
found FIT targets were obtained with roots of plants
in the four to six true leaf stage plus three days of
treatment [11]. The 64 seedling-specific, positively
FIT-dependent genes comprise a total of 11 genes that
were either previously determined as FIT targets [11]
or that were shown to play specific roles in iron
homeostasis [4, 35–39] (see also Additional file 5:
Table S3 column S). Additionally, these genes contain
NADK1 (AT3G21070), an NAD kinase which is involved in de novo synthesis of NADP [40]. As
suggested before [41, 42], reducing equivalents are required to maintain the iron uptake machinery and de
novo synthesis of NADP could be increased as a response to these requirements.
We also performed the same analysis with inversed
parameters to find genes that were repressed in a
FIT-dependent manner in either seedlings or root
samples (Fig. 6). After subtraction of the abovedetermined two robustly FIT-repressed genes, another
64 genes were repressed by FIT in six-week-old roots
(Additional file 5: Table S5) and 19 genes in six-day-old
seedlings (Additional file 5: Table S6). Taken together, we
suggest as a possible explanation that along with the robustly FIT-dependent genes other distinct sets of genes
could be under the control of additional but yet unknown
factors which might act in different developmental stages.
We suspected that the genes which showed the FITdependent regulation pattern only in the seedling
Mai et al. BMC Plant Biology (2016) 16:211
Table 2 Symbols or descriptions of the robustly FIT-regulated
genes
AGI
Symbol or shortened Description
Robustly FIT-induced genes
AT1G01580
FERRIC REDUCTION OXIDASE 2 (FRO2)
AT1G09560
GERMIN-LIKE PROTEIN 5 (GLP5)
AT1G09790
COBRA-LIKE PROTEIN 6 PRECURSOR (COBL6)
AT1G14182
SCR-LIKE 28 (SCRL28)
AT1G14185
Glucose-methanol-choline (GMC) oxidoreductase
family protein
AT1G32380
PHOSPHORIBOSYL PYROPHOSPHATE (PRPP)
SYNTHASE 2 (PRS2)
AT1G34760
GENERAL REGULATORY FACTOR 11 (GRF11)
AT1G53635
unknown protein
AT1G73120
unknown protein
AT2G01880
PURPLE ACID PHOSPHATASE 7 (PAP7)
AT2G20030
RING/U-box superfamily protein
AT2G35850
unknown protein
AT3G06890
unknown protein
AT3G07720
Galactose oxidase/kelch repeat superfamily protein
AT3G12900
2-oxoglutarate (2OG) and Fe(II)-dependent
oxygenase superfamily protein
AT3G46900
COPPER TRANSPORTER 2 (COPT2)
AT3G50740
UDP-GLUCOSYL TRANSFERASE 72E1 (UGT72E1)
AT3G53480
ATP-BINDING CASSETTE G37 (ABCG37)
AT3G58060
Cation efflux family protein
AT3G58810
METAL TOLERANCE PROTEIN A2 (MTPA2)
AT3G61410
BEST Arabidopsis thaliana protein match is: U-box
domain-containing protein kinase family protein
(TAIR:AT2G45910.1)
AT3G61930
unknown protein
AT4G09110
RING/U-box superfamily protein
AT4G17680
SBP (S-ribonuclease binding protein) family protein
AT4G19680
IRON REGULATED TRANSPORTER 2 (IRT2)
AT4G19690
IRON-REGULATED TRANSPORTER 1 (IRT1)
AT5G03570
IRON REGULATED 2 (IREG2)
AT5G38820
Encodes a putative amino acid transporter
AT5G45105
ZINC TRANSPORTER 8 PRECURSOR (ZIP8)
AT5G46060
Protein of unknown function. DUF599
AT5G55250
IAA CARBOXYLMETHYLTRANSFERASE 1 (IAMT1)
AT5G62420
NAD(P)-linked oxidoreductase superfamily protein
Robustly FIT-repressed genes
AT5G59520
ZRT/IRT-LIKE PROTEIN 2 (ZIP2)
AT1G11080
SERINE CARBOXYPEPTIDASE-LIKE 31 (scpl31)
If available the short symbols are given in brackets along with the fully written
gene name. If no symbol was available we provided a shortened version of
the description. The AGI codes of the novel robustly FIT-induced and repressed
genes that had not been previously associated with FIT [11, 12] are written
bold and underlined. For more information on the expression patterns of these
genes see Table 1. The genes in this table were selected by their expression
patterns in roots and seedlings
Page 9 of 22
samples but not in the root samples (in total 83 genes
designated as FIT-repressed/induced only in six-day-old
seedlings, Fig. 8) were expressed in roots where FIT is
active. Sixty-six of these 83 genes were found in our
study to be FIT-regulated in roots. The other 17 genes
were checked for root expression using publicly available
microarray and RNA-seq data via the Genevestigator
tool [43]. All 11 FIT-induced and four FIT-repressed
genes out of these 17 genes were indeed all found
expressed at low, medium or high level in root and root
cell samples. Only two FIT-repressed genes (AT1G67265
and AT4G38825) were found expressed at very low level
in roots and were therefore excluded from any further
analyses. We cannot exclude that some other genes
which might have been expressed at a very low level in
roots but higher level in cotyledons were not detected in
our analyses.
The robustly FIT-regulated genes comprise a number
of transporters that are involved in iron uptake, such as
IRT1 [7, 44], or in sequestration of other bivalent metals
under iron deficiency such as MTPA2 [45], MTP8 [46]
and IREG2 [47]. COPT2 is involved in copper uptake
[22]. COPT2 expression and copper uptake are increased
under Fe deficiency, possibly to supply Cu to enzymes
that use Cu as a cofactor [22]. The exact function of
the ZRT/IRT-like family protein ZIP8 is unknown but
it could potentially be an Fe or Zn transporter.
AT5G38820 is a putative amino acid transporter. The
FIT-repressed gene ZIP2 encodes a transporter that is
localized to the plasmamembrane and capable of transporting Zn and Mn [48]. The role of ZIP2 in iron
homeostasis is unclear but it might also be involved in
Zn or Mn detoxification. IRT2 is an iron transporter.
IRT2 expression is induced by iron and zinc deficiency
[49, 50]. PDR9 might be an exporter of scopoletin and
derivates into the rhizosphere [51].
Some robustly FIT-regulated genes encode enzymes.
FRO2 is a ferric chelate reductase that is part of the iron
uptake machinery in Arabidopsis [6]. PAP7 is a purple
acid phosphatase that is targeted to peroxisomes [52].
Peroxisomes are involved in a number of metabolic
pathways but also in the response to oxidative stress, JA
and SA biosynthesis and indole-3-butyric acid metabolism [53]. Hence, PAP7 could play a role in the regulation
of such processes under Fe deficiency through reversible protein phosphorylation [53]. PAP7 regulation also
depends on JAI3. Thus, in addition to FIT, it may be
regulated by MYC2 [54]. AT1G14185 is a glucosemethanol-choline (GMC) oxidoreductase family protein
with unclear function. PRS2 is a phosphoribosyl pyrophosphate synthetase. According to BioCYC [55] the
product, 5-phospho-α-D-ribose 1-diphosphate, could
serve as a precursor in several nucleoside and nucleotide salvage pathways but could also be a precursor of
Mai et al. BMC Plant Biology (2016) 16:211
Page 10 of 22
Fig. 4 Four-step filtering of FIT-repressed genes using scatterplot analysis of log2 fold changes of gene expression in the respective comparison
in seedlings (horizontal) and roots (vertical). The blue dots represent genes that did not match the requirement and were removed in the subsequent
step. The yellow dots represent gene expression patterns that matched the requirement and which were used as the input for the subsequent pattern
analysis. The respective zero-points are indicated by red crosshairs. The genes filtered in a were used as input in b. The genes filtered in b were used
as input in c. The genes filtered in c were used as input in d. The yellow dots in d represent the FIT-repressed genes (Tables 1 and 2)
NAD+ which might be required in higher amounts
under iron deficiency. IAMT1 converts IAA to methylIAA (MeIAA). MeIAA is an inactive form of IAA that
gets converted back into IAA by hydrolysis [56]. It has
been suggested that the nonpolar and mobile MeIAA
molecule serves to quickly change local IAA concentrations [56]. UGT72E1 is involved in the glycosylation of
sinapyl aldehyde and coniferyl aldehyde [57]. The phenylpropanoid glucosides are better soluble than their
non-glycosylated forms and ready for transport. Coniferyl aldehyde and sinapyl aldehyde can be precursors
of ferulic acid, sinapic acid and lignin. It has been suggested that glycosylation of these phenylpropanoids
might regulate the biosynthesis of lignin and the metabolism of a number of other phenylpropanoids [57].
AT5G62420 is an NAD(P)-linked oxidoreductase superfamily protein of unknown function. COBL6 is predicted
to be anchored to the plasmamembrane [58] and has been
previously annotated as a putative phytochelatin synthase
[11, 47]. The FIT-regulated genes also encompass the
genes of three putative E3 ligases: AT2G20030 and
AT4G09110 are RING/U-box superfamily proteins and
Mai et al. BMC Plant Biology (2016) 16:211
Page 11 of 22
Fig. 5 Filtering of temporally FIT-induced genes using scatterplot analysis of log2 fold changes of gene expression in the respective comparisons
in seedlings (a and b) and roots (c and d). The blue dots represent genes that did not match the requirement and were removed in the subsequent
step. The yellow dots represent gene expression patterns that matched the requirements and which were used as the input for the subsequent pattern
analysis. The respective zero-points are indicated by red crosshairs. The genes filtered in a were used as input in b. The genes filtered in c were used as
input in d. The yellow dots in b and d represent FIT-induced genes in six-day-old seedlings (b) (Additional file 5: Table S3) and in roots of sic-week-old
plants (d) (Additional file 5: Table S4). The filtering steps 1 and 2 as well as 3 and 4 are combined in one graph, respectively
AT3G61410 contains a U-box. An enzymatic function of
these gene products has not been demonstrated but based
on the similarity to E3 ligases we speculate that they might
be involved in the regulation of proteasome-dependent
protein turnover under iron deficiency. AT3G07720 is a
galactose oxidase/kelch repeat superfamily protein with
high similarity to nitrile specifier proteins which are involved in glucosinolate breakdown [59]. AT3G12900
shows a high similarity to AT3G13600 (F6’H1). Therefore,
we speculate that it could also play a role in coumarin
biosynthesis or metabolism. SCPL31 which is the other
FIT-repressed gene, encodes a putative serine carboxypeptidase. Enzymatic activity has not been demonstrated but
the protein could play a role in proteasome-independent
protein processing or turnover.
The exact molecular function of another fraction of
the robustly FIT-induced genes is unknown. The 14-3-3
protein GRF11 has been demonstrated to act downstream of NO and has been suggested to modulate FIT
expression in a feedback loop [60]. GLP5 is a
Mai et al. BMC Plant Biology (2016) 16:211
Page 12 of 22
Fig. 6 Filtering of temporally FIT-repressed genes using scatterplot analysis of log2 fold changes of gene expression in the respective comparisons
in seedlings (a and b) and roots (c and d). The blue dots represent genes that did not match the requirement and were removed in the subsequent
step. The yellow dots represent gene expression patterns that matched the requirements and which were used as the input for the subsequent pattern
analysis. The respective zero-points are indicated by red crosshairs. The genes filtered in a were used as input in b. The genes filtered in c were used as
input in d. The yellow dots in b and d represent FIT-repressed genes in six-day-old seedlings (b) (Additional file 5: Table S5) and in roots of sic-week-old
plants (d) (Additional file 5: Table S6). The filtering steps 1 and 2 as well as 3 and 4 are combined in one graph, respectively
plasmodesmata-located protein. GLP5 over-expressing
plants display reduced primary root and enhanced lateral
root growth [61]. Hence, GLP5 might be involved in altering the root architecture under iron deficiency.
AT4G17680 is an SBP (S-ribonuclease binding protein)
family protein it contains a Zinc finger domain. We
speculate that this might be a regulatory protein, possibly by taking a role in mRNA processing. SCRL28 is a
97 amino acids long peptide and member of a family of
small, secreted, cysteine rich proteins. According to
UniProtKB [62] it is a putative defensin-like protein. The
role of SCRL28 is unknown. AT1G73120, the gene of an
unknown protein has been demonstrated to be induced
under excess Zn [34]. The genes of five more unknown
proteins are among the robustly FIT-regulated proteins:
AT3G06890, AT3G61930, AT1G53635, AT2G35850 and
AT5G46060. AT3G06890, AT3G61930, AT1G53635 and
AT2G35850 encode 79 to 128 amino acids long peptides
that might have regulatory functions or play roles in
signal transduction.
Mai et al. BMC Plant Biology (2016) 16:211
Validation of FIT-dependent genes by assembly of a
virtual dataset
We assembled a virtual dataset using our own expression data of iron-regulated genes together with the
transcriptomic data from 9 previous studies in which
Arabidopsis wild type roots or seedlings were tested
for transcriptomic adaptations upon iron deficiency
[11, 13, 19, 20, 24, 25, 63–65]. From time course experiments we used the 24 h [24], 48 h and 72 h data
[64]. The reconstructed data from two publications
[11, 20] were incomplete since they only contained induced genes. Together, 14 transcriptomic analyses
from 9 studies and our own data have been taken into
account (Additional file 3: Dataset 5). From the collected data we assembled a virtual iron regulation dataset (Additional file 3: Dataset 6) in which the genes
were filtered by the number of occurrences among the
regulated genes and by the uniformity of their regulation. From 5851 genes that were found regulated in at
least one of the studies, 598 genes met the requirements of which 437 genes were induced and 161 were repressed under -Fe. Out of the 32 FIT-regulated genes all
but seven genes (AT1G14182, AT1G32380, AT1G53635,
AT4G17680 AT5G4510, AT5G46060 and AT5G55250)
were among the induced genes in this virtual dataset. A
closer look at these seven genes showed that five of them
(AT1G14182, AT1G53635, AT4G17680, AT5G45105 and
AT5G46060) had not been included in the Affymetrix
ATH1 chips used in the published work. The two other
genes, AT1G32380 and AT5G55250, were barely 1.5 and
2-fold up-regulated under -Fe, which makes them
prone to be filtered by the oftentimes used two-fold detection threshold.
One observation that we made during the assembly of
the virtual dataset was the very variable number of genes
detected as regulated in the distinct analyses. The highest number of genes that was found regulated in wild
type upon iron deficiency was 2673 (this study). A comparable number of genes was for example also detected
by Long et al. [25] in the 48 h and 72 h time points of
the time course analysis. The lowest number of genes
that were found regulated upon iron deficiency in wild
type roots was 14 [65] while in transcriptomic analyses
of other studies this number ranged from roughly 150 to
1000 genes. The average number is ca. 800. Hence, it is
not surprising that potentially important genes were
often not detected and this might have contributed to
the fact that AT5G55250 did not make it into the virtual
dataset and that some of the newly FIT-associated genes
were not found as such. A reason for the great variability
of the number of detected differentially expressed genes
could be inconsistent growth conditions which may lead
to a high variance between the biological replicates and
consequently to insignificant regulation. Interestingly,
Page 13 of 22
even the central regulator of iron uptake, FIT, has only
been found regulated in 7 of 14 analyses. This might be
due to the fact that FIT is relatively weakly up-regulated
under iron deficiency but might also be due to the fact
that this gene is only present on two of four often used
microarrays to this time point. Hence, detection of some
important genes might also depend on the microarrays
used to perform the transcriptomic analysis. The comparison of the 598 genes in the virtual dataset with our
own data showed that we found 293 of these genes regulated while 305 genes in the virtual dataset were not
found regulated in our analyses. The fact that the average VIRT absolute value was 0.36 shows that our analyses with ca. 49 % covered an above-average number
of these genes.
Robust marker genes for iron deficiency
Our virtual dataset of the transcriptomic response of
wild type to iron deficiency was constructed so that the
genes were not only ranked by the number of occurrences in all analyses but also according to the uniformity of their regulation across multiple analyses. Setting
thresholds in the process of constructing the dataset enabled us to filter the regulatory noise and pinpoint those
genes that are most reliably induced upon iron deficiency in wild type Arabidopsis roots and whole seedlings. According to this procedure, 598 out of 5847
genes that were found regulated in at least one of the 14
analyses of WT -Fe vs. WT +Fe in this study and all the
other considered studies [11, 13, 19, 20, 24, 25, 63–65]
are present in the virtual dataset (Additional file 3:
Dataset 6). This number is ca. 25 % less than the average number of genes that were found regulated in all
considered studies. The highest ranked up- and downregulated genes are shown in Table 3. The four topmost ranked induced genes upon iron deficiency in
WT are AT3G07720 (galactose oxidase, kelch repeat
family protein), AT3G58810 (MTPA2), AT4G19690
(IRT1), AT3G12900 (2-oxoglutarate (2OG) and Fe(II)dependent oxygenase superfamily protein) and AT3G
61930 (unknown protein) (Table 3). This makes them
the most reliable marker genes for iron deficiency in
Arabidopsis roots and seedlings. AT3G07720 and
MTPA2 match previous findings [13]. AT4G19690,
AT3G12900 and AT3G61930 are almost equivalent alternatives albeit their ranking is slightly lower. Although stably up-regulated under iron deficiency in
roots and seedlings, not much is known about the
functions AT3G12900 and AT3G61930. Due to its
similarity to AT3G13610 (F6'H1) it can be guessed
that AT3G12900 possibly also participates in coumarin biosynthesis. The consistent induction of these
genes upon iron deficiency, along with the hitherto
unknown AT3G07720, they are interesting new targets
Mai et al. BMC Plant Biology (2016) 16:211
Page 14 of 22
Table 3 Genes that were found most stably up or down-regulated in Arabidopsis wild type across 11 studies in a total of 14
transcriptomic comparisons between -Fe and +Fe
Symbol
AGI
1
2
3
4
5
6a
6b
6c
7
8
9a
9b
10
11
VIRT
Genes that are most stably up-regulated under iron deficiency
Kelch repeat family protein
AT3G07720
1
1
1
1
1
1
1
1
1
1
1
1
1
1
1.00
MTPA2
AT3G58810
1
1
1
1
1
1
1
1
1
1
1
1
1
1
1.00
IRT1
AT4G19690
1
1
1
1
1
1
1
1
1
1
1
1
1
0
0.93
2OG
AT3G12900
1
1
1
1
1
1
1
1
1
1
1
1
1
0
0.93
unknown
AT3G61930
1
1
1
1
1
1
1
1
1
1
1
1
1
0
0.93
GLP5
AT1G09560
1
1
1
1
1
1
1
1
1
1
1
1
0
0
0.86
Unknown
AT3G06890
1
1
1
1
1
1
1
1
0
1
1
1
1
0
0.86
COPT2
AT3G46900
1
1
0
1
1
1
1
1
1
1
1
1
1
0
0.86
UGT72E1
AT3G50740
1
1
1
1
1
1
1
1
0
0
1
1
1
1
0.86
bHLH039
AT3G56980
1
1
1
1
1
1
1
1
0
1
1
1
0
1
0.86
MYB72
AT1G56160
1
1
0
1
1
1
1
1
1
1
1
1
1
0
0.86
Cation efflux family protein
AT3G58060
1
1
1
1
1
1
1
1
0
1
1
1
1
0
0.86
Genes that are most stably down-regulated under iron deficiency
FER1
AT5G01600
-1
0
-1
-1
-1
-1
-1
-1
-1
-1
-1
0
-0.83
ATABC1
AT4G04770
-1
0
-1
-1
-1
-1
-1
-1
0
-1
-1
0
-0.75
unknown
AT2G36885
-1
0
0
0
-1
-1
-1
-1
-1
-1
-1
0
-0.67
PSAF
AT1G31330
-1
0
-1
-1
0
-1
-1
0
0
-1
-1
0
-0.58
uncharacterized protein family (UPF0016)
AT1G68650
-1
0
0
0
-1
-1
-1
-1
-1
0
-1
0
-0.58
PER21
AT2G37130
-1
0
-1
-1
0
-1
-1
0
0
-1
-1
0
-0.58
FER4
AT2G40300
-1
0
0
-1
-1
-1
-1
-1
-1
0
0
0
-0.58
LAC7
AT3G09220
-1
-1
0
0
-1
-1
-1
0
0
-1
-1
0
-0.58
SAPX
AT4G08390
-1
0
-1
-1
0
-1
-1
0
0
-1
-1
0
-0.58
unknown
AT5G59400
-1
0
-1
-1
-1
-1
-1
-1
0
0
0
0
-0.58
HEMA1
AT1G58290
0
0
0
0
-1
-1
-1
-1
0
-1
-1
0
-0.50
FSD1
AT4G25100
-1
-1
0
-1
-1
0
0
-1
0
0
0
-1
-0.50
peroxidase, putative
AT5G64100
0
-1
0
-1
0
-1
-1
0
0
-1
-1
0
-0.50
Up-regulated genes are represented by the value 1. Down-regulated genes are represented by the value -1. Genes with no significant regulation or with regulation
below the threshold of the respective study are represented by the value 0. The genes with the highest VIRT absolute value are regarded as most stably up- or
down-regulated, respectively. 1: This study (seedlings). 2: This study (roots). 3: Bauer and Blondet, 2011 [63]. 4: Ivanov et al., 2012 [13]. 5: Yang et al., 2010 [19]. 6a:
Long et al., 2010. 48 h [25]. 6b: Long et al., 2010. 72 h [25]. 6c: Long et al., 2010. 24 h (WT vs. pye) [25]. 7: Garcia et al., 2010 [20]. 8: Buckhout et al., 2009 [24]. 9a:
Dinneny et al., 2008. 48 h [64]. 9b: Dinneny et al., 2008. 72 h [64]. 10: Colangelo and Guerinot, 2004 [11]. 11: Schuler et al., 2011 [65]. For the down-regulated
genes, the analyses 7 [20] and 10 [11] were excluded in the calculation of the VIRT value since these only contained genes that were induced upon iron deficiency
for future research. Interestingly, among the top 12
up-regulated genes 11 have been associated with FIT
by Colangelo and Guerinot [11] and this study. Only
AT3G56980 (bHLH039) is regulated independently from
FIT. This fits the previous finding that bHLH039 is regulated together with bHlh038, bHLH100 and bHLH101 by
the concerted action of bHLH104 and ILR3 [66].
Among the most stably up-regulated genes under iron
deficiency there is also the newly FIT-associated gene
AT1G09560 (GLP5). GLP5 is a germin-like protein.
Germin-like proteins have been associated with pathogen response [67]. It is possible that germin-like proteins
also play a role in other stress responses such as iron deficiency. GLP5, also named PGLP1, is a component of
the NCAP (non-cell-autonomous protein) pathway, locates to plasmodesmata and regulates root growth [61].
So GLP5 could be involved in iron signal complex translocation or in the altered root growth as a response to
iron deficiency. Hence it would be interesting to know
whether adaptations of the root architecture to iron deficiency is disturbed by glp5 knock-out or GLP5 overexpression mutants.
The three topmost ranked down-regulated genes are
AT5G01600 (FER1), AT4G04770 (ATABC1) and AT2G
36885 (unknown protein) (Table 3). However, since their
rank absolute value is lower than the five topmost induced genes they are less suitable as robust iron deficiency marker genes. However, due to its ranking the
Mai et al. BMC Plant Biology (2016) 16:211
down-regulated gene that is best-suited for this purpose
would be FER1.
Co-expression and functional analysis of the virtual
dataset revealed functionally enriched regulons
Out of the 598 genes in the virtual dataset 437 were
found induced. This is concordant with the general observation that under iron deficiency more genes are induced than repressed. We used these genes to create
co-expression networks using the String version 10 tool
[27]. Genes resulting in singlet nodes and networks
with ≤ 3 nodes were disregarded. One hundred sixtynine genes grouped into networks with ≥4 nodes (Fig. 7,
Additional file 6: Figure S4). After rearranging the
nodes we could detect a total of 13 networks with 4 to
Page 15 of 22
43 nodes. Six networks (Fig. 7, regulons 1, 2, 3, 11, 12
and 13) had no connection to other networks. Seven
networks (Fig. 7, regulons 4-10) were connected with
each other by sharing few nodes.
One closed regulon (Fig. 7, regulon 1) contained genes
of the FIT target network [13], namely IRT1, MTPA2,
FRO2 and CYP82C4 (Additional file 5: Table S7). Among
the input genes of the virtual dataset further members of this regulon (AT1G34760, AT1G73120, AT1G
74770, AT3G07720, AT3G12820, AT3G12900, AT3G
50740, AT3G58810, AT4G19680, AT4G19690, AT4G
30120, AT4G31940 and AT5G38820) were present.
Another closed regulon (Fig. 7, regulon 2) was mainly
composed of known members of the iron homeostasis
PYE-BTS regulon [13]. Only 3 genes of the original
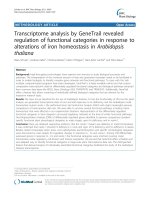
Fig. 7 Co-expression network built from the genes induced under -Fe in the virtual dataset: Regulon 1: contains members of the FIT target network [13].
Regulon 2: consists of members of the iron homeostasis network [13]. Regulon 3: is largely composed of genes involved in phenylpropanoid metabolism.
Regulon 4: mainly comprises genes that participate in the pentose phosphate pathway, glycolysis and gluconeogenesis. Regulon 5: is mostly composed
of genes that are involved in RNA processing and translation. Regulon 6: contains mitochondrial proteins. Regulon 7: is heterogeneous but contains
comparably many chaperons. Regulon 8: is enriched in genes involved in amino acid metabolism. Regulon 9: is also heterogeneous but enriched in
genes that participate in plant-pathogen interaction. Regulon 10: shows no enrichment of molecular functions. Regulon 11: mainly contains genes that
participate in purine, lipid and aromatic compound metabolism. Regulon 12: is composed of genes involved in the response to low sulfur. Regulon 13
shows no enrichment of molecular functions. The network has been created with the String version 10 protein interaction database [27]. The confidence
was set to ‘medium’ (0.400) and no genes were added. The 437 genes induced under -Fe in the virtual dataset were used as input. Singlet nodes have
been removed and only networks with 4 or more nodes are shown. The resulting network image contains 169 genes (Additional file 5: Table S7). For a
high resolution image see Additional file 6: Figure S4
Mai et al. BMC Plant Biology (2016) 16:211
regulon were missing, namely PP2-A9, the gene of an
unknown protein (AT2G30760) and IPT3. Hence, this
regulon is very consistently and almost entirely induced upon iron deficiency. Interestingly, this regulon
contained 5 additional members compared to the original network, namely IREG3, BHLH38, DJC77,
PGR5-LIKE A and CGLD27. Thus, the PYE-BTS regulon could be extended by 5 members. The third
closed regulon (Fig. 7, regulon 3) was mainly composed
of genes that are involved in phenylpropanoid metabolism. Increase of phenylpropanoid biosynthesis has been
previously observed at the proteomic level [42]. Among
others, PAL1, PAL2, 4CL1 and 4CL2, which catalyze the
very first steps in the phenylpropanoid pathway, were
members of this regulon (Additional file 5: Table S7)
and the respective proteins were also found induced
upon iron deficiency. This network did not contain
genes of enzymes that synthesize the final conversions.
However, F6’H1 and another gene that has been hypothesized to also participate in coumarin biosynthesis
(AT3G12900) as well as the gene of the ABC transporter PDR9 (AT3G53480) which could be responsible
for coumarin secretion into the rhizosphere were
among the consistently iron deficiency-induced genes
(Additional file 3: Dataset 6) but not directly connected
to one of the regulons in our graph (Fig. 7). Furthermore, this regulon also contained MAT3 which provides S-adenosylmethionine that, among others, serves
as a methyl group donor in coumarin biosynthesis.
Among others, organic acids such as malic acid were discussed to attract soil bacteria which might contribute to
enhance iron uptake [68, 69]. Coumarins are excreted
under iron deficiency [39, 51, 70, 71] and coumarins also
play roles under other abiotic stresses such as osmotic
stress [72]. Coumarins like Scopoletin also function as
phytoalexins [73]. Besides mobilization of rhizospheric
iron they could also serve to alter the rhizobiome.
At the proteomic level induction of glucose metabolism upon iron deficiency has been observed [41, 42].
We identified a regulon with 10 nodes (Fig. 7, regulon
4) that is induced under iron-deficiency. Eight of the
ten nodes are genes which are involved in glucose metabolism, namely G6PD6, IPGAM2, PEPC1, PFK1, the
gene of a 6-phosphogluconate dehydrogenase family
protein (AT3G02360), the gene of a sugar isomerase
family protein (AT5G42740), the gene of a phosphofructokinase family protein (AT1G76550) and the gene
of a pyruvate kinase family protein (AT5G56350).
Additionally, FBA6 was found induced in a neighboring and connected regulon (Fig. 7, network 7). This
clearly indicates an increase of glycolysis and the
pentose phosphate pathway. Both were suggested to
provide energy equivalents, organic acids and reducing
equivalents [41].
Page 16 of 22
Another network with 19 members (Fig. 7, regulon 5)
contained mainly transcription and translation-related
genes. Among those are MDN1, NRPA2, NAP1;1,
RPL3P, PRH75, ERF1-1, the gene of a ribosomal protein
L10 family protein (AT2G40010), the gene of the ribosomal protein S4 (AT5G39850), the gene of a ribosomal
protein L30/L7 family protein (AT3G13580), the gene
of a nonsense-mediated mRNA decay NMD3 family
protein (AT2G03820) and the gene of a zinc finger
(C2H2 type) family protein (AT2G36930) (Additional
file 5: Table S7).
Noticeable enrichment in genes that are involved in
the response to low sulfur were found in a small
four-member network (Fig. 7, regulon 12): the tetratricopeptide repeat (TPR)-like superfamily protein
gene SDI1 (AT5G48850), LSU2 (AT5G24660), APR2
(AT1G62180) and the gene of another so far uncharacterized tetratricopeptide repeat (TPR)-like superfamily protein (AT1G04770). SDI1 is regulated by FIT specifically in
seedlings (this study). The largest regulon contained 48
tightly interwoven nodes (Fig. 7, regulon 9). A portion of
the genes in this regulon is involved in the response to
various chemical, biotic and abiotic stimuli such as response to chitin, response to water deprivation or response
to other organism as well as response to stress. This regulon also contained the formerly known and partially newly
determined FIT downstream targets PUB23, F6’H1,
GSTL1, RBOHD, the gene of two unknown proteins
(AT1G49000 and AT4G29780) and the gene of a glycine
rich protein (AT3G04640) (Additional file 5: Table S7).
Twenty-five of the FIT target genes were contained in
the virtual dataset and used as input genes. Only three
of them were present in the resulting co-expression network. Since we intentionally did not add any genes, the
respective bridging nodes were missing so they appeared
as singlet nodes or networks with <4 nodes and were removed. For the same reason the FIT target network and
the iron homeostasis PYE-BTS-regulon were not connected. However, the deeper analysis of the virtual dataset showed a comparably high concordance with previous
observations at the proteomic level. Although the actual
overlap between distinct genes and proteins in the transcriptomic and proteomic analyses is comparably low and
single comparisons between the proteomic and transcriptomic regulation under iron deficiency showed a pronounced discrepancy between gene and protein regulation,
the general adaptations of some metabolic and regulatory
pathways that were observed at the protein level [41, 42]
are mirrored at the transcriptome level.
Conclusions
FIT is the central regulator of iron homeostasis in Arabidopsis. Until now, 73 genes were known to be regulated
downstream of FIT [11, 12]. With stringent expression
Mai et al. BMC Plant Biology (2016) 16:211
pattern analysis we divided the regulated genes in multiple subgroups with distinct expression patterns (Fig. 8).
We were able to define 32 robustly FIT-induced genes
among which there were 11 novel robustly FIT-induced
genes. Additionally, we pinpointed two robustly FITrepressed genes. Hence, for the first time a repressing effect of FIT could be demonstrated. Furthermore, our
results indicate a total of 414 genes that were regulated
in a FIT-dependent manner either in seedlings or in sixweek-old roots. FIT influenced the expression of far
more genes than previously demonstrated. We were able
to show that the control by FIT also depends on hitherto
unknown factors.
The construction of a virtual dataset based on 14 distinct transcriptomic analyses allowed for removing a
great portion of regulatory noise and revealed a total
of 598 genes that are stably regulated under iron deficiency in Arabidopsis roots and seedlings. Four hundred thirty-seven of them were found stably induced
and 161 stably repressed under iron deficiency with a
probability of ≥ 0.25. From the induced genes in this
dataset we performed co-expression analysis and
found a total of 13 regulons with ≥ 4 nodes. Some of
Page 17 of 22
these regulons were enriched with functionally related
genes among which parts of the previously known
FIT target network and the iron homeostasis PYEBTS regulon could be identified. The PYE-BTS regulon was almost completely present and could be
extended by further genes.
Direct comparisons demonstrated large discrepancies
between the proteomic and transcriptomic regulation
[29] and remodeling the ribosomal composition has
been proposed to cause biased translation [74]. The analysis of our virtual dataset appears to confirm such remodeling processes. However, the data in the virtual
dataset display considerable overlap with combined
proteomic data [42] at least at the functional level.
Taken together this study not only provides new
insight into the effects of FIT abundance on gene expression but also points out the importance of redundant analyses.
Methods
Plant materials and plant growth
In this study we used the wild-type Arabidopsis ecotype
Columbia-0 (Col-0) named WT, the fit knock-out line
Fig. 8 Summary of the results of our microarray analyses. The big blue circle represents genes that were found regulated in at least one
comparison in six-week-old roots and the big red circle contains genes that were found regulated in at least one comparison in six-day-old
seedlings. The lower yellow oval consists of genes that were found FIT-induced in six-week-old roots and the lower green oval represents the
FIT-induced genes in six-day-old seedlings. The intersection between the lower yellow and green ovals contains the 32 genes that we consider robustly
FIT-induced. Eleven of them are novel FIT-regulated genes (brown circle). We also detected FIT-repressed genes. The upper yellow oval represents
genes that were found FIT-repressed in six-week-old roots and the upper green oval contains the FIT-repressed genes in six-day-old seedlings. The
intersection between the upper yellow and green ovals contains the 2 genes that we consider robustly FIT-repressed
Mai et al. BMC Plant Biology (2016) 16:211
fit-3 (GABI_108C10) [14] named fit and the FIT overexpressing line HA-FIT 8 [28] named HA-FIT. The
seeds were sterilized and stratified for 48 h at 4 °C.
Hydroponic growth was conducted as previously described using ¼-strength Hoagland medium without sucrose containing 10 μM iron [35]. The medium was
exchanged every seven days. To prevent the fit plants
from dying they were sprayed with Flory 72 (FeEDDHA) twice a week. After five weeks of hydroponic
growth all plants were washed with ddH2O to rinse off
residual Fe-EDDHA and the treatment was started by
transferring the plants to fresh medium containing either 10 μM (+Fe) or 0 μM iron (-Fe). After seven days
of treatment the six week-old plants were harvested. In
the plate system stratified seeds were germinated in
12x12 cm2 square plates with 1 x Hoagland agar containing 50 μM (+Fe) or 0 μM iron (-Fe). After 6 days
the seedlings were harvested.
RNA extraction
One hundred milligrams of the roots of the six weekold hydroponically grown plants or 100 mg whole six
day-old seedlings were frozen and homogenized under
constant liquid nitrogen cooling, respectively. RNA extraction was performed with the RNEasy Plant Mini Kit
(Qiagen) according to the manufacturer’s instructions.
Total RNA content of the final extracts was measured
fluorimetrically with the infinite M200PRO plate reader
(TECAN) using the NanoQuant plate. RNA quality was
estimated with the OD260/OD280 ratio.
Microarray analysis
Two hundred nanogram of original total RNA were used
per hybridization for the microarray analysis. The analysis was performed using CATMA microarrays. Three
independent biological replicates were produced. For
each biological replicate, RNA samples were prepared
and analyzed in two technical replicates as previously
described [29]. We analyzed gene expression in roots of
six-week-old plants that were grown on +Fe ¼-strength
liquid Hoagland medium for five weeks and then
transferred to +Fe or -Fe for one week. We also analyzed gene expression in six-day-old whole seedlings
that were grown on +Fe or -Fe Hoagland agar for six
days. Probes with a p value of ≤ 0.05 and a fold change
of ≥1.5 were considered differentially expressed. The
microarray data are publicly available at CATdb
( projects “AU15-01_
Iron-FIT” and “AU13-06_FIT”). Microarray data from
this article were deposited at Gene Expression Omnibus ( accession no.
GSE65934 and GSE80281. The RNA preparations were
also used for differential gene expression via RT-qPCR of
Page 18 of 22
selected genes identified in the microarray analysis (Additional file 2: Figure S2).
Reverse transcription-quantitative polymerase chain
reaction (RT-qPCR)
For RT-qPCR 1 μg of total RNA were treated with
DNase. cDNA was synthesized using oligo-dT primers.
The cDNA was diluted 1:10 with ddH2O, then once
more 1:10 and 10 μl of this dilution were used per 20 μl
PCR reaction. Using the DyNAmo ColorFlash SYBR
Green qPCR Kit (Thermo Scientific) Real-time PCR was
performed. A water negative control was treated equally.
Quantification was based on mass standard curve analysis. Each sample value was normalized based on
EF1Balpha2 expression. The average of 2 technical replicates was used as the sample expression value. The average of three biological replicates was calculated and
ANOVA with Tukey’s HSD (Honestly Significant Difference) was performed for statistical analysis using the
OriginPro 9.0 software. The primer sequences are shown
in the Additional file 5: Table S8.
Construction of the virtual dataset
For the construction of the virtual dataset we were interested in qualitative data, and for easier comparison
with other experiments the expression data of previous publications as well as our own data were transformed so that in each comparison up-regulation was
represented by the value 1 and down-regulation by the
value -1. Below-threshold or insignificant regulation
was given the value 0. We used our data and the provided expression data from 10 previous publications
[11, 13, 19, 20, 24, 25, 63–65, 75]. From time course
experiments we used the 24 h [24] or the 48 h and
72 h data [64], respectively. The reconstructed data
from two publications [11, 20] must be considered incomplete since they only contain iron deficiencyinduced genes. One dataset could not be reconstructed
from the available supplementary information [75]. Together, 14 transcriptomic analyses from 9 studies have
been taken into account (Additional file 3: Dataset 5).
From the transformed expression change values of the
comparison WT -Fe vs. WT +Fe we counted how often
each gene was found regulated in any of the analyses irrespective of the direction of regulation. We abbreviated
this value as “ABS” (absolute occurrence). Then we
added the expression change values. We named the result “SUM” (sum of regulation values). If a gene was always or mostly regulated in one direction this resulted
in a positive or negative value of SUM. We set the SUM
threshold to ≥ 2 or ≤ -2 to ensure that a gene has been
regulated at least twice more into one direction than
into the other direction. Then we divided the absolute
value of SUM by ABS to measure how often a
Mai et al. BMC Plant Biology (2016) 16:211
contradictory regulation has been observed with the respective gene. We abbreviated this ratio as “RAT” (ratio
between SUM and ABS). To ensure that the gene was
regulated at least twice as often in one direction than
into the other direction the threshold for RAT was set
to ≥ 0.5. Only genes that matched the SUM and RAT
thresholds were considered predominantly regulated
into the respective direction under iron deficiency. All
the other genes were considered regulated by other
factors and removed from the dataset. To be able to
rank the genes according to their uniformity of differential expression we introduced the “VIRT” value (virtual expected expression change) by dividing SUM
(including the positive or negative sign) by the total
number of analyses and multiplying the result with
RAT. The total number of analyses was set to 14 for
up-regulated genes (SUM > 2) since 14 analyses were
used. For down-regulated genes (SUM < -2) we set the
total number of analyses to 12 since 2 of the 14 analyses [11, 20] only contained genes that were induced
under iron deficiency. The sign of VIRT indicates the
direction of regulation and its absolute value roughly
represents the probability to find the gene regulated
into this direction. Genes that were found regulated in
both directions got lower absolute VIRT values than
genes that were found regulated in only one direction.
We set the threshold of VIRT to be ≥ 0.25 or ≤ -0.25.
Finally, the VIRT value was used to rank the genes in
the virtual dataset according to their probability of regulation in the comparison WT -Fe vs. WT +Fe (Additional
file 3: Dataset 6).
Additional files
Additional file 1: Figure S1. Overview and workflow of the analyses
performed and the Arabidopsis lines used in this study. Three
independent biological replicates of wild-type, HA-FIT and fit Arabidopsis
plants were grown on iron-sufficient (+Fe) liquid medium for five weeks
and then transferred to iron-sufficient or iron-deficient (-Fe) medium for
one week (see also [29]). After a total of six weeks the roots were
harvested. Seedlings were grown on iron-sufficient or iron-deficient
Hoagland agar for six days and then the whole seedlings were harvested.
From both, six-week-old roots and six-day-old seedlings, we extracted
total RNA. This RNA was used to perform CATMA microarray analyses.
RT-QPCR was performed to validate expression of a number of known
iron homeostasis-related genes. By filtering the genes according to their
expression patterns we were able to determine novel robustly FITinduced and repressed genes and genes that were regulated in a FITdependent manner only in six-week-old roots or in six-day-old seedlings.
Furthermore, we used our analyses plus previously published transcriptomic
analyses to construct a virtual dataset with which we could determine
robustly iron deficiency-regulated genes. (TIF 839 kb)
Additional file 2: Figure S2. Validation of gene regulation by RT-qPCR
analysis. Normalized absolute expression of the iron homeostasis-related
genes FIT, IRT1, FRO2, AT3G07720, BHLH038, BHLH039, NAS1 and NAS2
(A-H) in six-day-old seedlings grown on iron-sufficient (+Fe) or irondeficient (-Fe) medium. The horizontal point diagrams (I-P) indicate
significant changes in the respective pairwise comparisons according to
Tukey’s HSD. (TIF 1315 kb)
Page 19 of 22
Additional file 3: Supplemental Datasets. Dataset 1. Fold-changes
of gene expression in roots of 6 week-old Arabidopsis plants. The foldchanges are log2 values. In the column header the upper line/condition
is compared to the lower line/condition. Significant up-regulation is indicated by red background color. Significant down-regulation is indicated
by green background-color. The residual insignificant and belowthreshold values are masked by black background color. Dataset 2. Foldchanges of gene expression in 6 day-old Arabidopsis whole seedlings.
The fold-changes are log2 values. In the column header the upper line/
condition is compared to the lower line/condition. Significant upregulation is indicated by red background color. Significant downregulation is indicated by green background-color. The residual insignificant and below-threshold values are masked by black background color.
Dataset 3. Juxtaposition of the fold-changes of gene expression in roots
of 6-day-old Arabidopsis
seedlings and 6-week-old Arabidopsis roots. The fold-changes are log2
values. In the column header the upper line/condition is compared to
the lower line/condition. Significant up-regulation is indicated by red
background color. Significant down-regulation is indicated by green
background-color. The residual insignificant and below-threshold values
are masked by black background color. Dataset 4. Juxtaposition of the
fold-changes of gene expression in roots of 6-day-old Arabidopsis
seedlings and 6-week-old Arabidopsis roots. The fold-changes are log2
values. In the column header the upper line/condition is compared to
the lower line/condition. Significant up-regulation is indicated by red
background color. Significant down-regulation is indicated by green
background-color. The residual insignificant and below-threshold values
are masked by black background color. The genes were filtered so that
only genes are present in this table which were found regulated at least
in one comparison in whole seedlings and in one comparison in roots.
Dataset 5: Genes that are regulated in an iron-dependent manner across
10 studies with a total of 14 comparisons. Up-regulated genes are
represented by the value 1 and a red background color. Down-regulated
genes are represented by the value -1 and a green background color.
Genes with no significant regulation or with regulation below the
threshold of the respective study are represented by the value 0 and
black background color. The column titled ‘ABS’ shows the number of
comparisons in which the gene was found regulated. The column
titled ‘SUM’ shows the overall sum of the given values (-1 for downregulation, +1 for up-regulation, ±0 for no regulation) of all
comparisons. The genes with the highest sum are regarded as most
stably up-regulated upon iron deficiency. The genes with the lowest
sum are regarded as most stably down-regulated upon iron deficiency.
The column titled ‘RAT’ contains the result of division of the absolute
value of ‘SUM’ by ‘ABS’ and is supposed to provide a threshold for the
Supplemental Dataset 6, along with ‘SUM’. (XLSX 4180 kb)
Additional file 4: Figure S3. Close view of the iron homeostasis cluster
in six-day-old seedlings and six-week-old roots as shown in Fig. 2d. The
indicator genes and their respective expression patterns are highlighted
yellow. (TIF 71 kb)
Additional file 5: Supplemental Tables. Table S1. List of genes that
were found regulated in the inter-line and intra-line comparisons in sixday-old seedlings and roots of six-week-old plants and that were found
in iron homeostasis-related clusters after hierarchical clustering of the
seedling, root and combined expression data. Table S2. Lists of input
genes and the output genes before and after each of the four filtering
steps. The lists are sorted alphabetically. Table S3. Expression patterns of
genes that are induced by FIT in six-day-old seedlings. The genes marked
red were found regulated in seedlings but not in the root samples. The
genes marked yellow have previously been associated with iron
homeostasis. For comparison, the respective root expression patterns
have been added to the right. Additionally, we have added a column (S)
with selected publications in which mutants have been investigated or
which establish a direct link to iron homeostasis. Table S4. Expression
patterns of genes that are induced by FIT in roots of six-week-old plants.
The genes marked red were found regulated in the root samples but not
Mai et al. BMC Plant Biology (2016) 16:211
in seedlings. For comparison the respective seedling expression patterns
have been added to the right. Table S5. Expression patterns of genes
that are repressed by FIT in six-week-old roots. The genes marked red
were found regulated in the root samples but not in seedlings. For
comparison the respective seedling expression patterns have been added
to the right. Table S6. Expression patterns of genes that are repressed by
FIT in six-day-old seedlings. The genes marked red were found regulated
in seedlings but not in the root samples. For comparison the respective
seedling expression patterns have been added to the right. Table S7. List
of genes that were found in common regulons with ≥ 4 nodes in the
co-expression analysis of iron deficiency-induced genes in the virtual
dataset. The numbers correspond to the numbering in Fig. 7. Table S8.
List of primers which we used to validate the expression data of some
iron homeostasis-related genes. (XLSX 197 kb)
Additional file 6: Figure S4. Co-expression network built from the
genes induced under -Fe in the virtual dataset: Regulon 1: contains
members of the FIT target network [13]. Regulon 2: consists of members
of the PYE-BTS regulon [13]. Regulon 3: is largely composed of genes
involved in phenylpropanoid metabolism. Regulon 4: mainly comprises
genes that participate in the pentose phosphate pathway, glycolysis and
gluconeogenesis. Regulon 5: is mostly composed of genes that are
involved in RNA processing and translation. Regulon 6: contains
mitochondrial proteins. Regulon 7: is heterogeneous but contains
comparably many chaperons. Regulon 8: is enriched in genes involved in
amino acid metabolism. Regulon 9: is also heterogeneous but enriched
in genes that participate in plant-pathogen interaction. Regulon 10:
shows no enrichment of molecular functions. Regulon 11: mainly
contains genes that participate in purine, lipid and aromatic compound
metabolism. Regulon 12: is composed of genes involved in the response
to low sulfur. Regulon 13 shows no enrichment of molecular functions.
The network has been created with the String version 10 protein
interaction database [27]. The confidence was set to ‘medium’ (0.400) and
no genes were added. The 437 genes induced under -Fe in the virtual
dataset were used as input. Singlet nodes have been removed and only
networks with 4 or more nodes are shown. The resulting network image
contains 169 genes (Additional file 5: Table S7). (TIF 8234 kb)
Abbreviations
ANOVA: Analysis of variance; CATMA: Complete Arabidopsis Transcriptome
MicroArray; EDDHA: Ethylenediamine-N,N'-bis(2-hydroxyphenylacetic acid);
HSD: Honestly Significant Difference; IAA: Indole-3-acetic acid; JA: Jasmonic
acid; MeIAA: Methyl-indole-3-acetic acid; RNA-seq: RNA sequencing; RTqPCR: Reverse transcription quantitative polymerase chain reaction;
SA: Salicylic acid; WT: wild-type
Acknowledgements
We thank Angelika Anna and Elke Wieneke for their help in growing the
plants and Elke Wieneke for performing RT-qPCR analyses. The platform POPS
(transcriptOmic Platform of iPS2) benefits from the support of the LabEx
Saclay Plant Sciences-SPS (ANR-10-LABX-0040-SPS).
Funding
This work was funded by the Deutsche Forschungsgemeinschaft (DFG Ba
1610/7-1) to PB and by the Heinrich Heine University Düsseldorf.
Availability of data and materials
The transcriptomic data used in this study are publicly available at
CatDB ( under the project names “AU1501_Iron-FIT” and “AU13-06_FIT” and at Gene Expression Omnibus
( under the accession numbers
GSE65934 and GSE80281. Further relevant data are available in the
manuscript and the supporting files.
Authors’ contributions
PB and HM designed the experiments. HM wrote the manuscript, performed
experiments and analyzed and evaluated the data. SP, transcriptomic platform
POPS (transcriptOmic Platform of iPS2), performed the CATMA microarray
analyses. PB revised the manuscript critically. All authors have read and
approved this manuscript.
Page 20 of 22
Competing interests
The authors declare that they have no competing interests.
Consent for publication
Not applicable.
Ethics approval and consent to participate
Not applicable.
Author details
Institute of Botany, Heinrich Heine University Düsseldorf, Universitätsstraße
1, Building 26.13, 02.36, 40225 Düsseldorf, Germany. 2Institute of Plant
Sciences Paris Saclay IPS2, CNRS, INRA, Université Paris-Sud, Université Evry,
Université Paris-Saclay, Bâtiment 630, 91405 Orsay, France. 3Institute of Plant
Sciences Paris-Saclay IPS2, Paris Diderot, Sorbonne Paris-Cité, Bâtiment 630,
91405 Orsay, France. 4CEPLAS Cluster of Excellence on Plant Sciences,
Heinrich Heine University Düsseldorf, Düsseldorf, Germany.
1
Received: 7 July 2016 Accepted: 16 September 2016
References
1. Marschner H, Romheld V, Kissel M. Different Strategies in Higher-Plants in
Mobilization and Uptake of Iron. J Plant Nutr. 1986;9(3-7):695–713.
2. Romheld V, Marschner H. Evidence for a specific uptake system for iron
phytosiderophores in roots of grasses. Plant Physiol. 1986;80(1):175–80.
3. Romheld V. Different Strategies for Iron Acquisition in Higher-Plants. Physiol
Plant. 1987;70(2):231–4.
4. Santi S, Schmidt W. Dissecting iron deficiency-induced proton extrusion in
Arabidopsis roots. New Phytol. 2009;183(4):1072–84.
5. Robinson NJ, Procter CM, Connolly EL, Guerinot ML. A ferric-chelate
reductase for iron uptake from soils. Nature. 1999;397(6721):694–7.
6. Connolly EL, Campbell NH, Grotz N, Prichard CL, Guerinot ML.
Overexpression of the FRO2 ferric chelate reductase confers tolerance to
growth on low iron and uncovers posttranscriptional control. Plant Physiol.
2003;133(3):1102–10.
7. Eide D, Broderius M, Fett J, Guerinot ML. A novel iron-regulated metal
transporter from plants identified by functional expression in yeast. Proc
Natl Acad Sci U S A. 1996;93(11):5624–8.
8. Henriques R, Jasik J, Klein M, Martinoia E, Feller U, Schell J, Pais MS, Koncz C.
Knock-out of Arabidopsis metal transporter gene IRT1 results in iron
deficiency accompanied by cell differentiation defects. Plant Mol Biol. 2002;
50(4-5):587–97.
9. Varotto C, Maiwald D, Pesaresi P, Jahns P, Salamini F, Leister D. The metal
ion transporter IRT1 is necessary for iron homeostasis and efficient
photosynthesis in Arabidopsis thaliana. Plant J. 2002;31(5):589–99.
10. Vert G, Grotz N, Dedaldechamp F, Gaymard F, Guerinot ML, Briat JF, Curie C.
IRT1, an Arabidopsis transporter essential for iron uptake from the soil and
for plant growth. Plant Cell. 2002;14(6):1223–33.
11. Colangelo EP, Guerinot ML. The essential basic helix-loop-helix protein FIT1
is required for the iron deficiency response. Plant Cell. 2004;16(12):3400–12.
12. Jakoby M, Wang HY, Reidt W, Weisshaar B, Bauer P. FRU (BHLH029) is
required for induction of iron mobilization genes in Arabidopsis thaliana.
FEBS Lett. 2004;577(3):528–34.
13. Ivanov R, Brumbarova T, Bauer P. Fitting into the harsh reality: regulation of
iron-deficiency responses in dicotyledonous plants. Mol Plant. 2012;5(1):27–42.
14. Bauer P, Ling HQ, Guerinot ML. FIT, the FER-LIKE IRON DEFICIENCY INDUCED
TRANSCRIPTION FACTOR in Arabidopsis. Plant Physiol Biochem. 2007;45(5):
260–1.
15. Wang N, Cui Y, Liu Y, Fan H, Du J, Huang Z, Yuan Y, Wu H, Ling HQ.
Requirement and functional redundancy of Ib subgroup bHLH proteins for
iron deficiency responses and uptake in Arabidopsis thaliana. Mol Plant.
2013;6(2):503–13.
16. Lingam S, Mohrbacher J, Brumbarova T, Potuschak T, Fink-Straube C,
Blondet E, Genschik P, Bauer P. Interaction between the bHLH transcription
factor FIT and ETHYLENE INSENSITIVE3/ETHYLENE INSENSITIVE3-LIKE1 reveals
molecular linkage between the regulation of iron acquisition and ethylene
signaling in Arabidopsis. Plant Cell. 2011;23(5):1815–29.
17. Yuan Y, Wu H, Wang N, Li J, Zhao W, Du J, Wang D, Ling HQ. FIT interacts
with AtbHLH38 and AtbHLH39 in regulating iron uptake gene expression
for iron homeostasis in Arabidopsis. Cell Res. 2008;18(3):385–97.
Mai et al. BMC Plant Biology (2016) 16:211
18. Yuan YX, Zhang J, Wang DW, Ling HQ. AtbHLH29 of Arabidopsis thaliana is
a functional ortholog of tomato FER involved in controlling iron acquisition
in strategy I plants. Cell Res. 2005;15(8):613–21.
19. Yang TJ, Lin WD, Schmidt W. Transcriptional profiling of the Arabidopsis
iron deficiency response reveals conserved transition metal homeostasis
networks. Plant Physiol. 2010;152(4):2130–41.
20. Garcia MJ, Lucena C, Romera FJ, Alcantara E, Perez-Vicente R. Ethylene and
nitric oxide involvement in the up-regulation of key genes related to iron
acquisition and homeostasis in Arabidopsis. J Exp Bot. 2010;61(14):3885–99.
21. Bernal M, Casero D, Singh V, Wilson GT, Grande A, Yang H, Dodani SC,
Pellegrini M, Huijser P, Connolly EL, et al. Transcriptome sequencing
identifies SPL7-regulated copper acquisition genes FRO4/FRO5 and the
copper dependence of iron homeostasis in Arabidopsis. Plant Cell. 2012;
24(2):738–61.
22. Perea-Garcia A, Garcia-Molina A, Andres-Colas N, Vera-Sirera F, PerezAmador MA, Puig S, Penarrubia L. Arabidopsis copper transport protein
COPT2 participates in the cross talk between iron deficiency responses and
low-phosphate signaling. Plant Physiol. 2013;162(1):180–94.
23. Waters BM, McInturf SA, Stein RJ. Rosette iron deficiency transcript and
microRNA profiling reveals links between copper and iron homeostasis in
Arabidopsis thaliana. J Exp Bot. 2012;63(16):5903–18.
24. Buckhout TJ, Yang TJ, Schmidt W. Early iron-deficiency-induced
transcriptional changes in Arabidopsis roots as revealed by microarray
analyses. BMC Genomics. 2009;10:147.
25. Long TA, Tsukagoshi H, Busch W, Lahner B, Salt DE, Benfey PN. The bHLH
transcription factor POPEYE regulates response to iron deficiency in
Arabidopsis roots. Plant Cell. 2010;22(7):2219–36.
26. Obayashi T, Hayashi S, Saeki M, Ohta H, Kinoshita K. ATTED-II provides
coexpressed gene networks for Arabidopsis. Nucleic Acids Res. 2009;
37(Database issue):D987–91.
27. Szklarczyk D, Franceschini A, Wyder S, Forslund K, Heller D, Huerta-Cepas J,
Simonovic M, Roth A, Santos A, Tsafou KP, et al. STRING v10: protein-protein
interaction networks, integrated over the tree of life. Nucleic Acids Res.
2015;43(Database issue):D447–52.
28. Meiser J, Lingam S, Bauer P. Posttranslational regulation of the iron
deficiency basic helix-loop-helix transcription factor FIT is affected by iron
and nitric oxide. Plant Physiol. 2011;157(4):2154–66.
29. Mai HJ, Lindermayr C, von Toerne C, Fink-Straube C, Durner J, Bauer P. Iron and
FER-LIKE IRON DEFICIENCY-INDUCED TRANSCRIPTION FACTOR-dependent
regulation of proteins and genes in Arabidopsis thaliana roots. Proteomics. 2015.
30. Roschzttardtz H, Conejero G, Curie C, Mari S. Identification of the
endodermal vacuole as the iron storage compartment in the Arabidopsis
embryo. Plant Physiol. 2009;151(3):1329–38.
31. Lanquar V, Lelievre F, Bolte S, Hames C, Alcon C, Neumann D, Vansuyt G,
Curie C, Schroder A, Kramer U, et al. Mobilization of vacuolar iron by
AtNRAMP3 and AtNRAMP4 is essential for seed germination on low iron.
EMBO J. 2005;24(23):4041–51.
32. Kim SA, Punshon T, Lanzirotti A, Li L, Alonso JM, Ecker JR, Kaplan J, Guerinot
ML. Localization of iron in Arabidopsis seed requires the vacuolar
membrane transporter VIT1. Science. 2006;314(5803):1295–8.
33. Fraser CM, Rider LW, Chapple C. An expression and bioinformatics analysis
of the Arabidopsis serine carboxypeptidase-like gene family. Plant Physiol.
2005;138(2):1136–48.
34. van de Mortel JE, Almar Villanueva L, Schat H, Kwekkeboom J, Coughlan S,
Moerland PD, Ver Loren van Themaat E, Koornneef M, Aarts MG. Large
expression differences in genes for iron and zinc homeostasis, stress
response, and lignin biosynthesis distinguish roots of Arabidopsis thaliana
and the related metal hyperaccumulator Thlaspi caerulescens. Plant Physiol.
2006;142(3):1127–47.
35. Klatte M, Schuler M, Wirtz M, Fink-Straube C, Hell R, Bauer P. The analysis of
Arabidopsis nicotianamine synthase mutants reveals functions for
nicotianamine in seed iron loading and iron deficiency responses. Plant
Physiol. 2009;150(1):257–71.
36. Sudre D, Gutierrez-Carbonell E, Lattanzio G, Rellan-Alvarez R, Gaymard F,
Wohlgemuth G, Fiehn O, Alvarez-Fernandez A, Zamarreno AM, Bacaicoa E,
et al. Iron-dependent modifications of the flower transcriptome, proteome,
metabolome, and hormonal content in an Arabidopsis ferritin mutant. J Exp
Bot. 2013;64(10):2665–88.
37. Mukherjee I, Campbell NH, Ash JS, Connolly EL. Expression profiling of the
Arabidopsis ferric chelate reductase (FRO) gene family reveals differential
regulation by iron and copper. Planta. 2006;223(6):1178–90.
Page 21 of 22
38. Rodriguez-Celma J, Lin WD, Fu GM, Abadia J, Lopez-Millan AF, Schmidt W.
Mutually exclusive alterations in secondary metabolism are critical for the
uptake of insoluble iron compounds by Arabidopsis and Medicago
truncatula. Plant Physiol. 2013;162(3):1473–85.
39. Schmid NB, Giehl RF, Doll S, Mock HP, Strehmel N, Scheel D, Kong X, Hider
RC, von Wiren N. Feruloyl-CoA 6′-Hydroxylase1-dependent coumarins
mediate iron acquisition from alkaline substrates in Arabidopsis. Plant
Physiol. 2014;164(1):160–72.
40. Berrin JG, Pierrugues O, Brutesco C, Alonso B, Montillet JL, Roby D, Kazmaier
M. Stress induces the expression of AtNADK-1, a gene encoding a NAD(H)
kinase in Arabidopsis thaliana. Mol Genet Genomics. 2005;273(1):10–9.
41. Lopez-Millan AF, Grusak MA, Abadia A, Abadia J. Iron deficiency in plants: an
insight from proteomic approaches. Front Plant Sci. 2013;4:254.
42. Mai H-J, Bauer P. From the proteomic point of view: Integration of adaptive
changes to iron deficiency in plants. Current Plant Biology. 2016.
43. Hruz T, Laule O, Szabo G, Wessendorp F, Bleuler S, Oertle L, Widmayer P,
Gruissem W, Zimmermann P. Genevestigator v3: a reference expression
database for the meta-analysis of transcriptomes. Adv Bioinformatics. 2008;
2008:420747.
44. Korshunova YO, Eide D, Clark WG, Guerinot ML, Pakrasi HB. The IRT1 protein
from Arabidopsis thaliana is a metal transporter with a broad substrate
range. Plant Mol Biol. 1999;40(1):37–44.
45. Arrivault S, Senger T, Kramer U. The Arabidopsis metal tolerance protein
AtMTP3 maintains metal homeostasis by mediating Zn exclusion from the
shoot under Fe deficiency and Zn oversupply. Plant J. 2006;46(5):861–79.
46. Eroglu S, Meier B, von Wiren N, Peiter E. The Vacuolar Manganese
Transporter MTP8 Determines Tolerance to Iron Deficiency-Induced
Chlorosis in Arabidopsis. Plant Physiol. 2016;170(2):1030–45.
47. Schaaf G, Honsbein A, Meda AR, Kirchner S, Wipf D, von Wiren N. AtIREG2
encodes a tonoplast transport protein involved in iron-dependent nickel
detoxification in Arabidopsis thaliana roots. J Biol Chem. 2006;281(35):25532–40.
48. Milner MJ, Seamon J, Craft E, Kochian LV. Transport properties of members
of the ZIP family in plants and their role in Zn and Mn homeostasis. J Exp
Bot. 2013;64(1):369–81.
49. Vert G, Barberon M, Zelazny E, Seguela M, Briat JF, Curie C. Arabidopsis IRT2
cooperates with the high-affinity iron uptake system to maintain iron
homeostasis in root epidermal cells. Planta. 2009;229(6):1171–9.
50. Vert G, Briat JF, Curie C. Arabidopsis IRT2 gene encodes a root-periphery
iron transporter. Plant J. 2001;26(2):181–9.
51. Fourcroy P, Siso-Terraza P, Sudre D, Saviron M, Reyt G, Gaymard F, Abadia A,
Abadia J, Alvarez-Fernandez A, Briat JF. Involvement of the ABCG37
transporter in secretion of scopoletin and derivatives by Arabidopsis roots
in response to iron deficiency. New Phytol. 2014;201(1):155–67.
52. Kataya AR, Schei E, Lillo C. Towards understanding peroxisomal
phosphoregulation in Arabidopsis thaliana. Planta.
2016;243(3):699–717.
53. Kaur N, Reumann S, Hu J. Peroxisome biogenesis and function. The
Arabidopsis book/American Society of Plant Biologists. 2009;7:e0123.
54. Chini A, Fonseca S, Fernandez G, Adie B, Chico JM, Lorenzo O, GarciaCasado G, Lopez-Vidriero I, Lozano FM, Ponce MR, et al. The JAZ family of
repressors is the missing link in jasmonate signalling. Nature. 2007;
448(7154):666–71.
55. Caspi R, Altman T, Billington R, Dreher K, Foerster H, Fulcher CA, Holland TA,
Keseler IM, Kothari A, Kubo A, et al. The MetaCyc database of metabolic
pathways and enzymes and the BioCyc collection of Pathway/Genome
Databases. Nucleic Acids Res. 2014;42(Database issue):D459–71.
56. Li L, Hou X, Tsuge T, Ding M, Aoyama T, Oka A, Gu H, Zhao Y, Qu LJ. The
possible action mechanisms of indole-3-acetic acid methyl ester in
Arabidopsis. Plant Cell Rep. 2008;27(3):575–84.
57. Lim EK, Jackson RG, Bowles DJ. Identification and characterisation of
Arabidopsis glycosyltransferases capable of glucosylating coniferyl aldehyde
and sinapyl aldehyde. FEBS Lett. 2005;579(13):2802–6.
58. Roudier F, Schindelman G, DeSalle R, Benfey PN. The COBRA family of
putative GPI-anchored proteins in Arabidopsis. A new fellowship in
expansion. Plant Physiol. 2002;130(2):538–48.
59. Wittstock U, Burow M. Tipping the scales–specifier proteins in glucosinolate
hydrolysis. IUBMB Life. 2007;59(12):744–51.
60. Yang JL, Chen WW, Chen LQ, Qin C, Jin CW, Shi YZ, Zheng SJ. The 14-3-3
protein GENERAL REGULATORY FACTOR11 (GRF11) acts downstream of
nitric oxide to regulate iron acquisition in Arabidopsis thaliana. New Phytol.
2013;197(3):815–24.
Mai et al. BMC Plant Biology (2016) 16:211
Page 22 of 22
61. Ham BK, Li G, Kang BH, Zeng F, Lucas WJ. Overexpression of Arabidopsis
plasmodesmata germin-like proteins disrupts root growth and
development. Plant Cell. 2012;24(9):3630–48.
62. UniProt C. UniProt: a hub for protein information. Nucleic Acids Res. 2015;
43(Database issue):D204–12.
63. Bauer P, Blondet E. Transcriptome analysis of ein3 eil1 mutants in response
to iron deficiency. Plant Signal Behav. 2011;6(11):1669–71.
64. Dinneny JR, Long TA, Wang JY, Jung JW, Mace D, Pointer S, Barron C, Brady
SM, Schiefelbein J, Benfey PN. Cell identity mediates the response of
Arabidopsis roots to abiotic stress. Science. 2008;320(5878):942–5.
65. Schuler M, Keller A, Backes C, Philippar K, Lenhof HP, Bauer P. Transcriptome
analysis by GeneTrail revealed regulation of functional categories in
response to alterations of iron homeostasis in Arabidopsis thaliana. BMC
Plant Biol. 2011;11:87.
66. Zhang J, Liu B, Li M, Feng D, Jin H, Wang P, Liu J, Xiong F, Wang J, Wang
HB. The bHLH transcription factor bHLH104 interacts with IAA-LEUCINE
RESISTANT3 and modulates iron homeostasis in Arabidopsis. Plant Cell.
2015;27(3):787–805.
67. Membre N, Bernier F, Staiger D, Berna A. Arabidopsis thaliana germin-like
proteins: common and specific features point to a variety of functions.
Planta. 2000;211(3):345–54.
68. Rudrappa T, Czymmek KJ, Pare PW, Bais HP. Root-secreted malic acid
recruits beneficial soil bacteria. Plant Physiol. 2008;148(3):1547–56.
69. Zhang H, Sun Y, Xie X, Kim MS, Dowd SE, Pare PW. A soil bacterium
regulates plant acquisition of iron via deficiency-inducible mechanisms.
Plant J. 2009;58(4):568–77.
70. Schmidt H, Gunther C, Weber M, Sporlein C, Loscher S, Bottcher C, Schobert
R, Clemens S. Metabolome analysis of Arabidopsis thaliana roots identifies a
key metabolic pathway for iron acquisition. PLoS One. 2014;9(7):e102444.
71. Fourcroy P, Tissot N, Gaymard F, Briat JF, Dubos C. Facilitated Fe Nutrition
by Phenolic Compounds Excreted by the Arabidopsis ABCG37/PDR9
Transporter Requires the IRT1/FRO2 High-Affinity Root Fe(2+) Transport
System. Mol Plant. 2016;9(3):485–8.
72. Abu El-Soud W, Hegab MM, AbdElgawad H, Zinta G, Asard H. Ability of
ellagic acid to alleviate osmotic stress on chickpea seedlings. Plant Physiol
Biochem. 2013;71:173–83.
73. Gnonlonfin GJ, Sannic A, Brimera L. Review Scopoletin - A Coumarin
Phytoalexin with Medicinal Properties. Crit Rev Plant Sci. 2012;31(1):47–56.
74. Rodriguez-Celma J, Pan IC, Li W, Lan P, Buckhout TJ, Schmidt W. The
transcriptional response of Arabidopsis leaves to Fe deficiency. Front Plant
Sci. 2013;4:276.
75. Sivitz AB, Hermand V, Curie C, Vert G. Arabidopsis bHLH100 and bHLH101
control iron homeostasis via a FIT-independent pathway. PLoS One. 2012;
7(9):e44843.
76. Sturn A, Quackenbush J, Trajanoski Z. Genesis: cluster analysis of microarray
data. Bioinformatics. 2002;18(1):207–8.
Submit your next manuscript to BioMed Central
and we will help you at every step:
• We accept pre-submission inquiries
• Our selector tool helps you to find the most relevant journal
• We provide round the clock customer support
• Convenient online submission
• Thorough peer review
• Inclusion in PubMed and all major indexing services
• Maximum visibility for your research
Submit your manuscript at
www.biomedcentral.com/submit