Identification and analysis of novel salt responsive candidate gene based SSRs (cgSSRs) from rice (Oryza sativa L.)
Bạn đang xem bản rút gọn của tài liệu. Xem và tải ngay bản đầy đủ của tài liệu tại đây (1.28 MB, 11 trang )
Molla et al. BMC Plant Biology (2015):
DOI 10.1186/s12870-015-0498-1
RESEARCH ARTICLE
Open Access
Identification and analysis of novel salt
responsive candidate gene based SSRs (cgSSRs)
from rice (Oryza sativa L.)
Kutubuddin Ali Molla, Ananda Bhusan Debnath, Showkat Ahmad Ganie and Tapan Kumar Mondal*
Abstract
Background: Majority of the Asian people depend on rice for nutritional energy. Rice cultivation and yield are
severely affected by soil salinity stress worldwide. Marker assisted breeding is a rapid and efficient way to develop
improved variety for salinity stress tolerance. Genomic microsatellite markers are an elite group of markers, but
there is possible uncertainty of linkage with the important genes. In contrast, there are better possibilities of linkage
detection with important genes if SSRs are developed from candidate genes. To the best of our knowledge, there is
no such report on SSR markers development from candidate gene sequences in rice. So the present study was
aimed to identify and analyse SSRs from salt responsive candidate genes of rice.
Results: In the present study, based on the comprehensive literature survey, we selected 220 different salt
responsive genes of rice. Out of them, 106 genes were found to contain 180 microsatellite loci with, tri-nucleotide
motifs (56%) being most abundant, followed by di-(41%) and tetra nucleotide (2.8%) motifs. Maximum loci were
found in the coding sequences (37.2%), followed by in 5′UTR (26%), intron (21.6%) and 3′UTR (15%). For validation,
19 primer sets were evaluated to detect polymorphism in diversity analysis among the two panels consisting of
17 salt tolerant and 17 susceptible rice genotypes. Except one, all primer sets exhibited polymorphic nature with
an average of 21.8 alleles/primer and with a mean PIC value of 0.28. Calculated genetic similarity among genotypes
was ranged from 19%-89%. The generated dendrogram showed 3 clusters of which one contained entire 17
susceptible genotypes and another two clusters contained all tolerant genotypes.
Conclusion: The present study represents the potential of salt responsive candidate gene based SSR (cgSSR)
markers to be utilized as novel and remarkable candidate for diversity analysis among rice genotypes differing
in salinity response.
Keywords: Microsatellite, Genic-SSR, cgSSR, Salt tolerance, Salt responsive gene, Rice, Molecular diversity, Candidate
gene, Rice genotype
Background
Rice (Oryza sativa L.) is the most widely consumed
staple food by over half of the world’s population and it
provides 27 percent of dietary energy supply worldwide
[1]. The burgeoning world population growth and
shrinkage of agricultural land are the two main reasons
of an estimated food shortage in the coming days. Rice
production must increase at least 25% by 2030 in order
to feed the estimated world population [2]. The situation
* Correspondence:
Division of Genomic Resources, National Bureau of Plant Genetic Resources,
IARI Campus, Pusa, New Delhi 110012, India
is more aggravated due to the huge loss of crop yield as
a result of different abiotic stresses. Soil salinity, one of
the top most abiotic stresses, imposes limitation to the
growth and development of rice plant causing yield losses
of more than 50 percent [3]. Rice being a natural glycophyte, for every unit of excess salinity (deciSiemens/metre),
rice yields are estimated to reduce over 12 percent [4].
In contrast to animal, plants, the creature of nature,
are unable to move from one place to other compelling them to endure the stress in standing condition. In
this scenario, rice genetic improvement is one of the
top priority areas to increase yield overcoming those constraints to meet the future demand.
© 2015 Molla et al.; licensee BioMed Central. This is an Open Access article distributed under the terms of the Creative
Commons Attribution License ( which permits unrestricted use, distribution, and
reproduction in any medium, provided the original work is properly credited. The Creative Commons Public Domain
Dedication waiver ( applies to the data made available in this article,
unless otherwise stated.
Molla et al. BMC Plant Biology (2015):
Marker assisted selection remarkably speeds up the
efficiency and preciseness of breeding programme
over the traditional breeding. Availability of high
quality genome sequence [5] further eases up the
mining of DNA markers to facilitate marker assisted
breeding programme in rice. With the advancement
of molecular techniques, a diverse group of molecular
markers like restriction fragment length polymorphism
(RFLP), random amplification of polymorphic DNA
(RAPD), variable number tandem repeat (VNTR),
amplified fragment length polymorphisms (AFLP),
microsatellites polymorphism or simple sequence repeats
(SSR) and single nucleotide polymorphism (SNP) have
been developed. Among all, SSR markers are outstanding
in application because of their high reproducibility,
multi-allelic nature, codominant inheritance, good uniform
genome coverage, simplicity and inexpensive developmental methodology [6]. SSRs are present in the genome
as tandem arrays of short nucleotide repeats usually 1–5
bases per unit. SSR markers have been extensively
used in phylogenetic relationship cum diversity analysis
among rice genotypes [7-9], association mapping [10,11]
and identification and characterization of important trait
related QTL [12-14].
Traditional SSR markers developed from random
genomic sequences have uncertainty of linkage with
the transcribed regions (genes) of the genome, whereas
genic SSR derived from expressed sequence tag (EST) or
candidate gene sequences based SSR have far better
possibility of linkage to important loci conferring
desired phenotypes [15]. Genic SSR markers are highly
valuable by virtue of their high transferability to related
species, usefulness in functional diversity analysis and
utilization as anchor markers for comparative mapping
and evolutionary studies [16]. Genic SSR markers were
developed from EST sequences available from public
database in different crop species like rice [17,18], wheat
[19], barley [20], date palm [21], common bean [22] and
many others. As another approach, development of SSR
markers based on important candidate genes related to a
particular trait may greatly expedite marker assisted
breeding programme for the trait. Moreover, looking for
SSR in candidate genes may attain many unanswered
question about the regulation of those genes as increasing
evidences are being reported about the regulatory roles of
microsatellites in gene sequences [23-25]. However, report
on the development of genic SSR marker based on
candidate gene sequences (cgSSR) are scanty [26,27].
From literature survey, around 220 different genes in
rice were found to be salt responsive as evidenced by
forward/reverse genetics study. To the best of our
knowledge, there is no report on the development of
candidate gene based SSR markers in rice. In this study, we
report an exclusive identification of novel salt responsive
Page 2 of 11
candidate gene based SSR markers (cgSSRs) from rice. We
extensively investigated all characterized salt responsive
rice genes from published reports. When those gene
sequences were subjected for mining SSR, 106 genes
were found to contain simple sequence repeats. Among
those cgSSRs, 19 primer sets were evaluated and validated
for their extent of polymorphism in 17 salt tolerant and 17
salt sensitive rice genotypes. The originated dendrogram
revealed their remarkable ability to distinguish rice
genotype on the basis of salinity response. This is the first
report of salt responsive candidate gene based SSR
(cgSSR) marker identification and validation in rice.
Methods
Plant materials
A total of 34 rice genotypes including two contrasting
panel (salt tolerant and salt susceptible), each of
which contains 17 genotypes, were subjected for the
polymorphism survey in this study. Details of rice
genotypes along with their salt sensitivity level are given in
Additional file 1.
Isolation of genomic DNA
Fresh green leaves were collected, weighed (100 mg) and
immediately used for DNA isolation or stored at −80°C
after snap freezing in liquid N2. DNA was isolated following a previously described protocol [28]. Leaf tissues
were grinded to fine powder employing liquid N2 in a
pre-chilled morter. Prewarmed CTAB buffer (2.0%
CTAB (w/v); 0.1 M Tris Cl, pH 8; 0.02 M of EDTA,
pH 8; 1.4 M NaCl) was added to the powder for extraction and the mixture was incubated at 60°C for 20 min.
Supernatant was collected after centrifugation and a solution of Chloroform: Isoamyl alcohol (24:1) was mixed.
After centrifugation, aqueous phase was collected, mixed
with equal volume of isopropanol and incubated for
20 min at −20°C. Centrifugation was done to pellet
down DNA. Pellet was washed with 70% (v/v) ethanol,
air dried and dissolved in nuclease free water. The sample was treated with RNase enzyme at 37°C and subsequently purified by phenol-chloroform method [28].
Concentration and quality of purified DNA were checked
in Nanodrop spectrophotometer (Thermo scientific, USA)
employing 260/280 and 260/230 ratio and also by 1% (w/v)
agarose gel electrophoresis.
Salt tolerant genes, SSRs mining and Primer designing
An extensive search of literature was performed manually
to identify the rice candidate genes conferring salt tolerant
phenotype. All rice genes which have been reported elsewhere to confer stable salt tolerance in transgenic plants
on homologous and heterologous over expression and
which showed either enhanced or suppressed expression
upon salt stress were considered in this study. The gene
Molla et al. BMC Plant Biology (2015):
bank locus numbers were retrieved and subsequently
sequences of all those genes were downloaded from the
web ( resources of Rice
Genome Annotation Project [29]. The gene sequences
were used to mine SSRs in SSR identification tool [30].
Respective references of those candidate genes which have
been found to contain microsatellite repeats were given in
Additional file 2: Table S2. We designed primers from the
flanking sequences of the identified microsatellite repeat
region. Primers were designed manually with the following
parameters: primer length 20–25 bp, melting temperature
55–60°C, GC percentage- 45–60 and product size130–250 bp. Details of the primers, melting temperature
and the anticipated amplification product length are given
in Table 1.
PCR amplification and 6% polyacrylamide gel
electrophoresis
PCR amplification was done from 34 genotypes with 19
pairs of SSR primers in a total volume of 25 μl using a
C1000 Thermal Cycler (Bio Rad, USA). Each 25 μl volume
of reaction mixture contained 50 ng of genomic DNA as
template, 1X Taq polymerase buffer, 2 mM MgCl2,
0.2 mM dNTPs mix, 0.4 pM each of the forward and
reverse primer, 1 U of Taq polymerase. The optimized
condition was initial 5 minutes incubation at 97°C for
complete denaturation, followed by 38 cycles consisting of
94°C for 1 min, 55°C- 60°C (vary with the primer pair) for
1 min, 72°C for 2 min and finally 72°C for 10 min. The
experiments were repeated twice.
Resolving of all PCR products were performed in a
vertical 6% non denaturing Polyacrylamide gel electrophoresis (PAGE) system at constant 140 V with 1X TAE
(Tris acetate EDTA) buffer (pH-8.0). The gel was stained
with ethidium bromide solution and visualized in gel
documentation system (Protein Simple, USA).
Allele scoring and sequencing
Molecular weights of the amplified bands were determined
based on the relative migration of standard 100 bp DNA
ladder (Thermo scientific, USA) in the gel. The molecular
weight of each allele was determined using the Alpha View
software (Protein Simple, USA). Presence or absence of a
particular allele was denoted as 1 or 0 respectively and
the data was plotted to generate a data matrix for
further analysis. When an allele was found exclusively
in one genotype, it was designated as unique allele.
Alleles found in less than 5% of genotypes were designated
as rare.
DNA was eluted from the bands of selected alleles and
purified using QIAEX II Gel Extraction Kit (Qiagen,
Germany). The purified DNA was sequenced. The obtained
sequences were aligned with the original target sequence
using NCBI blastn tool.
Page 3 of 11
Data analysis
Analysis of data was performed according to the method
described in a previous report [31]. Polymorphism
information content (PIC) value of each primer pairs
was calculated according to the formula: PIC = 1- ∑ pi2,
where pi is equal to the frequency of the ith allele of a
particular locus [32]. DARwin v5 software was used to
draw the phylogenetic relationship among the rice
genotypes [33]. Euclidean distance matrix was computed
for evaluation of genetic distances between genotypes and
further utilized to construct a dendrogram using the
neighbour joining method [34]. Bootstrapping data over a
locus for 1000 replications of the original matrix (1/0 data
matrix) was used to evaluate the significance of each node.
Principal coordinate analysis (PCoA) was carried out in
DARwin v5 for differentiating the genotypes.
Result
Frequency and distribution of salt responsive cgSSRs
A total of 220 different salinity responsive candidate
genes were screened for the presence of SSR which yielded
a total of 180 SSR loci from 106 (48.18%) candidate genes.
List of those genes harbouring SSR loci with their
respective gene bank LOC number, function, number,
types and location of motif found were detailed in
Additional file 2. The study included only di-tetra
nucleotide repeats and reiteration of motifs less than
5 times was excluded. Tri-nucleotide motifs were
found to be the largest (56.11%) and tetra-nucleotide
motifs formed the smallest group (2.8%) (Figure 1A).
A total of 50 different kinds of motifs were found, of
which, CT/TC motifs (12.8%) were most frequent,
followed by AT/TA (10%) and CGG (7.7%) motif
(Additional file 3). Among the trinucleotide repeat motifs,
CGG (coding for arginine) and GCC (coding for alanine)
were more abundant than others (Additional file 3). The
number of repetition of a motif varied from 5–40, among
which, motif with 5 reiterations were the highest in
frequency, followed by six, seven and eight repetition
indicating that there is an inverse relationship between
number of reiteration of a SSR motifs and its frequency.
To survey the trend of distribution of SSR loci in candidate
gene sequences, the location of motifs were thoroughly
investigated. Our results showed that maximum percentage of SSR loci were found in CDS (37.22%)
followed by 5′UTR (26.11%), intron (21.66%) and 3′UTR
(15%) (Figure 1B). We classified the all 106 candidate
genes into seven broad functional groups. Among the
groups, 28.3% of total cgSSRs were found in transcription
factor genes, while antioxidant genes contained 9.43% of
total cgSSRs (Figure 1C). Further we have analyzed the
location of SSR loci in each individual functional group.
The result revealed that most SSR loci were found in CDS
region in case of transcription factor genes and of genes
Gene bank
LOC No.
Gene
Forward (Tm)
Reverse (Tm)
Expected
Number of PIC
amplicon size alleles
value
Function
(Motif)
repeat*
Location
of motif
LOC_Os11g08210
OsNac5
ATGTGATTAGAGTCGCTTTCAGTTGG
(56.9C)
CCAGCTTGTACTTGTGCCAGCC (58.4C)
238 bp
10
0.110
TF
(TAA)18
3′UTR
LOC_Os10g25010
OsCML8
GAGAATCAGAGCAAGAGTCTGAACCAGC GTCAGCCGCTTCTTCCTCACCTG (61C)
(61C)
209 bp
21
0.275
Signaling
(CGG)9
CDS
LOC_Os01g32120
OsCML11
CATGCAAGCCTGCGGAGACG (61.2C)
CGGTCGAAGGAGCGGAAGATCT (60.5C) 154 bp
42
0.221
Signaling
(CAG)10
CDS
LOC_Os02g17500
OsGMST1
AGGAACCAACAGAAGCAAAGGTG (56.3C) GAGGTGATTTGATGCTGTGAGGC (57.4C) 194 bp
25
0.289
Sugar
Transporter
(AG)10
5′UTR
LOC_Os07g06740.2 OsCPK17
TTGCCTTTTGATCTAGTGCATTGG (57.2C)
GTCTTCGTCCTTTACTAAATAGCACTCC
(55.8C)
267 bp
21
0.353
Kinase
(CT)9/(CT)11 3′UTR
LOC_Os02g04630
CTGTTTGGCAATCTGCCAGC (55.6C)
CGTCTCGGCAAAATGTTCCTC (56.1C)
139 bp
20
0.326
Ion transporter
(CT)18
Intronic
OsCAX (D)
LOC_Os02g04630
OsCAX (T)
CTTTGGTTGGTTCAGGACGATG (55.9)
GAATTGGAAGCTGTTGGCTCATTC (57.9)
163 bp
18
0.169
“
(TTA)26
Intronic
LOC_Os07g38090
OsC3H50
GAGGAATTAGACCATTTAACTCGTCGC
(58.7)
GAATCCGACCCAATCCAATCAAG (58.3)
214 bp
24
0.199
RNA processing
(TC)9
5′UTR
GACATCTAAGTGCCGCGTGTTC (56.2)
TACATGCAGCGTCGAATCGAAG (57.6)
254 bp
17
0.358
Kinase
(CT)12
5′UTR
OsWRKY13 CCATGCGTACATACACGTTCATGTG (57C) GATGGGTGCAGCTTTCAATGATC (57.3C) 246 bp
20
0.370
TF
(AG)16/
(GA)9
5′UTR
LOC_Os06g48590.1 OsMAPK4
LOC_Os01g54600
GTTGATGGATCTGTAAATGCTTCATGG
(58.8)
GGCACCATGGAGCACCAAAC (57.4)
167 bp
Not
amplified
Not
Signaling
amplified
(AT)40
3′UTR
LOC_Os01g45274.1 OsCA1
CCATCGAGTACGCCGTCTGC (57.9)
CTTCACCATGAATGTTACACACCCTAC
(56.8)
281 bp
35
0.296
Chloroplast
photosynthesis
(CT)9
Intronic
LOC_Os02g02840.1 OsRacB (D) GCTCCTCCTTCAACCTTCTTCTTTC (57.1C) GTGACGCACTTTATGAACCTGGAC
(56.5C)
176 bp
30
0.318
Signaling,
GTPase
(GA)21
5′UTR
LOC_Os02g02840.1 OsRacB (T)
CAAGACCTGCATGCTCATCTCC (56.1C)
CCAGATCAAGAACCATAATCCTAGCTC
(56.9C)
202 bp
14
0.386
“
(TTC)9
Intronic
LOC_Os05g51670.1 OsUGE1
CACAACGCCAACAACCTCGAC (57.7C)
GCTTATCGAGATGGGAATGGTTG (56.5)
154 bp
11
0.087
Nucleotide sugar (TC)9
metabolism
Intronic
LOC_Os06g48590.1 OsMSRMK3 CACCTCCATTTCCCATTCCACC (58.9C)
CGAATCGAAGGCGGCAGCTATAG (60.9) 201 bp
27
0.340
Signaling, Kinase (CT)12
5′UTR
LOC_Os02g35190.2 OsCLC-1
CAGAGAAGCCAAGCAAAGAAAGTCTC
(58.1C)
CCGTGCTCTCGATGTCGTAGTTG (59.2)
179 bp
24
0.322
Ion trasport
(AGA)11
5′UTR
LOC_Os09g13570
OsbZIP71
CTCAGTAAGCTCCCTGTAGTTGTAGCC
(57.3)
GTTCAGGTCATCTTCCGACCTGG (58.5)
259 bp
13
0.323
TF
(TA)12
5′UTR
LOC_Os03g02590
OsPEX11-1
GCTGCTCTCGACTTTCTTGTTCC (56.2)
ACTAGCCCTGCACAGACTGAAGAG
(55.8)
276 bp
21
0.261
Peroxisomal
biogenesis
(TG)19
Intronic
D- di-nucleotide and T- tri-nucleotide. *subscript denotes the number of repeats.
Page 4 of 11
LOC_Os01g72530.1 OsCML31
Molla et al. BMC Plant Biology (2015):
Table 1 Details of salt tolerance gene, respective genbank LOC number, motifs with repeat number and location in sequence, primers with Tm and molecular
weight of expected band
Molla et al. BMC Plant Biology (2015):
Page 5 of 11
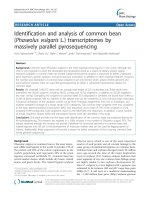
Figure 1 Frequency and distribution of salt responsive cgSSRs in rice. A) Number of different SSR motifs found, B) number of motifs found in
different locations of salt responsive gene sequences, C) Percentage of different functional classes of salt responsive genes harbouring SSR
loci. D) Location of SSR loci in each functional class of salt responsive genes. TF- transcription factor, TP- transporter, SK- signaling & kinase,
DRM- DNA/RNA modifying, CAT- catalytic and AO- Antioxidant.
involved in DNA/RNA modification and in intronic region
in case of catalytic and antioxidant genes, whereas the
genes showing kinase activity and involved in signaling
showed highest frequency of SSRs in 5′UTR (Figure 1D).
Equal percentage of SSR loci were found in CDS and
intron of transporter genes (Figure 1D). Although salt
responsive cgSSRs are present on all 12 chromosomes
of rice, yet their distribution were not equal among
the chromosomes (Figure 2). For example, maximum
frequency (23.88%) of salt responsive cgSSR loci were
found on chromosome 1, whereas the least (2.22%) was
found on chromosome 10. Chromosome 2, 3 and 5 were
found to contain more than 10% cgSSR loci.
values. A total of 393 alleles were detected including 32
rare alleles and 32 unique alleles. The average number of
alleles produced per primer was 21.8. There was also a
degree of stutter bands associated with the main alleles of
almost half of the markers used. The cgSSR from Nac5
gene produced the lowest number of alleles (10), whereas
the cgSSR from CML11 gave rise to the highest number
(42) of alleles. Although SSR markers are multiallelic in
nature, in order to avoid erroneous calculation and to
Development and validation of salt responsive candidate
gene based SSR (cgSSR) markers
Out of 180 cgSSRs, primers were designed for 19 loci
(NCBI probe- Pr032302526- Pr032302544) from 17
different salt responsive candidate genes (Table 1) for
validation. Among 19 different loci, only one designed
from CML31 gene failed to amplify. Therefore, we used
finally 18 different cgSSR loci to study polymorphism in
34 rice genotypes containing two contrasting panels
(17 tolerant and 17 susceptible genotypes). All 18 primer
sets generated clear distinct polymorphic profiles as
evident from the 6% agarose gel profile (Figure 3) and PIC
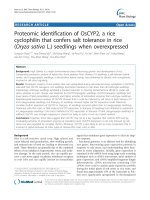
Figure 2 Frequency and distribution of salt responsive cgSSR loci in
different rice chromosomes.
Molla et al. BMC Plant Biology (2015):
Page 6 of 11
Figure 3 Representative images of 6% Polyacrylamide gel profile of amplified product from 34 genotypes using salt responsive cgSSR primer.
A- Gel picture with marker- OsRacB (2)-SSR and B- with marker OsCML11-SSR. Image was taken in gel documentation system after staining with
EtBr. Lane M- 100 bp DNA ladder (Thermo scientific), 1-34- different rice genotypes as defined in Additional file 1.
ascertain the nature of amplicons, we have sequenced all
the amplified bands for a particular genotype with a
specific marker as a representative case. A total of 20
randomly chosen alleles were sequenced and aligned with
the original target sequence. The alignment results
confirmed the similarity of each bands with its particular
original target sequence (data not shown).
The PIC value denotes the allelic diversity and frequency
among genotypes. In our study, an average of about 0.278
PIC value was obtained per cgSSR. The lowest PIC value
(0.087) was exhibited by the cgSSR from UGE1 gene,
while highest value (0.386) was obtained with the cgSSR
from tri-nucleotide motif of RacB gene. Primer designed
from di-nucleotide motif loci of RacB had a bit lower
PIC value of 0.318. On the contrary, cgSSR primers
based on di-nucleotide and tri-nucleotide motif loci of
the gene CAX showed a PIC value of 0.326 and 0.169 respectively. Details of primers and their corresponding PIC
values were depicted in the Table 1.
Genetic diversity analysis using salt responsive cgSSR
The data matrix generated from 18 cgSSRs profiling of
34 genotypes were utilized to study the genetic diversity
by dissimilarity analysis, factorial analysis through PCoA
(principal coordinates analysis) and cluster analysis. The
dendrogram generated through unweighted pair group
method of arithmetic mean (UPGMA) showed the
similarity among the rice accessions ranging from 19% to
89%. The dendrogram exhibited 3 distinct clusters of
which two containing all salt tolerant genotypes and one
single cluster containing all susceptible rice genotypes
(Figure 4). The salt tolerant genotypes were more diverse
than the salt susceptible panel in our study. Cluster I
consisted of 15 tolerant genotypes containing 2 sub
clusters (IA and IB). IA sub-cluster contained 6 genotypes,
viz. two Indian- Kalo Nuniya, Pokkali and 4 exoticTaangteikpan, Erati, Tarome and Talay, while IB sub-cluster
contained 9 genotypes, viz. 4 exotic- Cypress, Dom Sofid,
Hasawi, Som and 5 Indian- SR26B, CSR10, CSR30, CSR23
and Nona Bokra. Interestingly the smallest cluster
(cluster II) contains exclusively two salt tolerant genotypes FL478 and Kala Rata. On the other hand, the largest
cluster (cluster III) incorporated all salt susceptible genotypes in the study. Interestingly, all aromatic basmati rice
genotypes (Pusa Basmati 1121, Pusa basmati I and Basmati
370) were grouped closely in the same sub cluster.
Similarly, IR36, IR64 and IR50 were clustered together.
Hence, it is distinct from the genetic diversity analysis
using the 18 cgSSR markers that those markers are able to
distinguish rice genotypes on the basis of salt sensitivity.
For overall representation of diversity, principal coordinates analysis (PCoA) which requires Euclidean distance
Molla et al. BMC Plant Biology (2015):
Page 7 of 11
Figure 4 Dendrogram generated from an unweighted pair group method analysis (UPGMA) cluster analysis s based on salt responsive cgSSR
markers. First two clusters showing all tolerant genotypes, whereas third cluster showing all susceptible genotypes.
between units has been performed. PCoA revealed distinct
separation between each two rice genotypes (Figure 5). In
accordance with the dendrogram, the PCoA also clearly
divided the susceptible and tolerant panel without a
single intermixing. Despite of being its one of the parent,
susceptible IR29 was grouped separately from tolerant
FL478. In a similar fashion, susceptible parent Jaya was in
different group from the tolerant descendant CSR10. So it
is clear that the developed cgSSRs from salt responsive
genes distinguish the genotypes on account of their
behavior in salt stress.
Discussion
Ubiquitously, no toxic substance restricts plant growth
more than does salt [35]. Salt stress is an emerging
threat not only to rice but also to all glycophytes.
Salinity has a tremendous effect on plant growth and
reproduction as it imposes two simultaneous stresses- one
in the form of toxic salt ions and other in the form of water
stress caused by a certain drop in water potential value of
the soil solution. Although a majority of rice abiotic stress
biologists focused on deciphering the mechanism, developing resistance and identifying candidate genes and QTL
Molla et al. BMC Plant Biology (2015):
Page 8 of 11
Figure 5 Two-dimension plot generated from principal coordinate analysis (PCoA) for all 34 rice genotypes. Red and violet colour was used for
salt tolerant genotypes, while black and green colour was used for salt sensitive genotypes.
involved in salt stress, yet, very few salt tolerant commercially available varieties have been developed. In
order to enrich the genomic resource for developing
salinity tolerance in rice, here we report the development
of salt responsive candidate gene based SSR markers
(cgSSRs) in rice for the first time. However, in maize, SSR
markers were identified from genes involved in zinc and
iron transporter [26] and from candidate genes related to
tryptophan and lysine metabolic pathways [27]. Unlike the
previous reports, all types of characterized candidate genes
including transporter, transcription factor, antioxidant,
DNA/RNA modifying which showed differential regulation
under salinity stress in rice were selected from published
literature and their sequence were used to mine SSR loci.
Result of our study showed that tri-nucleotide repeats
(56.11%) are more abundant than di- (42.11%) and
tetra- (2.8%) nucleotide repeats which is in accordance
with previously published reports on rice SSR [17,36] and
common bean genic SSR [22]. Similar kind of result was
demonstrated in an in silico analysis of cereals (rice,
wheat, maize, barley, oat and rye) EST derived SSRs
showing tri-nucleotide were the most frequent (54–78%)
followed by di- (17.1–40.4%) and tetra- (3–6%) nucleotide
[37]. However, contrastingly, it has been reported that the
number of tri-nucleotide repeats was lesser than the
number of di-nucleotide repeats in rice genic non coding
microsatellites (GNMS) [38]. Most of the tri-nucleotide
motifs were found in CDS (59%) followed by in 5′UTR
(21%), intron (11%) and 3′UTR (9%). In this respect, the
result of our study is in agreement with an earlier report
in wheat [39]. Other studies in rice also support our
finding of highest frequency of occurrence of tri-nucleotide
repeats in CDS region than any other region like 5′UTR,
intron and 3′UTR [38,40]. The phenomenon of copiousness of tri-nucleotide repeats in CDS could be attributed to
the selection pressure against frame shift mutation in
coding regions resulting from length changes in nontriplet
repeats [41]. A previous study of Fujimori et al. [40] proposed that there is a gradual reduction of microsatellite
density along the direction of transcription in plant.
However, in our study, except the highest frequency in
CDS, microsatellite density declines along the direction of
Molla et al. BMC Plant Biology (2015):
transcription (5′UTR—›Intron—›3′UTR) (Figure 1B).
In our study, arginine coding (CGG) and alanine coding
(GCC) tri-nucleotide repeat motifs were found as two most
abundant classes which is in accordance of a previous
study of unigene derived microsatellites in cereals [42].
Keeping in mind to validate those salt responsive
cgSSRs, we analyzed their possible role to distinguish salt
tolerant and susceptible rice genotypes. We speculated the
repeat length variations in those cgSSR loci may play role
in the manifestation of differential behavior of rice genotypes to salt stress. In order to demonstrate experimental
evidence on the speculation, 19 selected cgSSRs were
tested in two contrasting panels of rice genotypes which
differ in salt sensitivity. The selection of those cgSSRs was
based on the notion that SSR loci with more repeats tend
to be more polymorphic [43]. SSR loci with 9 or more
repeats have been selected to study polymorphism. With
the exception of one which failed to amplify, remaining all
18 cgSSRs exhibited polymorphic banding pattern
supporting our speculated hypothesis regarding the high
level of diversity in salt responsive genes. Among the 18
cgSSRs, six was comprised of tri-nucleotide motif and
twelve was with di-nucleotide motif (Table 1). As
evidenced from PIC value, polymorphism level varies from
primer to primer. Usually di-nucleotide repeats containing
SSRs are more prone to mutation and as a result they
show more polymorphism than tri-nucleotide repeats
containing SSRs [43,44]. However, in our study, the mean
difference of PIC value between di-nucleotide and trinucleotide containing cgSSRs was not quite statistically
significant (p value 0.0627). The mean PIC value of all 18
cgSSR primers in the present study was 0.278 which is
higher than the previous report describing salt responsive
miRNA-SSR markers in rice [31]. Nevertheless, higher
PIC values for SSR primers from genomic sequences of
rice were reported in earlier studies [7,45]. This might be
due to the fact that genic SSRs usually reveal less
polymorphism in comparison with genomic SSRs as
reviewed in a previous report [16]. The average number of
alleles per locus was 21.8 in the present study. This
average value is higher in comparison with the average
value published in earlier reports [7,27,46,47]. However,
producing more alleles than the presence of its repeats by
SSR markers is also well documented in literature [48,49]
which corroborate our present findings.
It is noteworthy of the present study that the 18 cgSSR
markers were remarkably capable of indicating the variation
or diversity among rice genotypes in relation to their salinity responsive characters. In the present study, dendrogram
generated by UPGMA clearly established relationship
between different rice genotype according to their salt
sensitivity (Figure 4). Of the three clusters generated in
the dendrogram, two contained all tolerant genotypes
and another one was comprised of all salt susceptible
Page 9 of 11
genotypes exclusively. Our result is also in accordance
with the result about the similar clustering pattern of
Nona Bokra and Pokkali [50], CSR23, CSR10 and SR
26B [31], Hasawi and SR26B [51] and susceptible IR36
and IR64 [52]. Cluster II was consisted of two tolerant
genotypes FL478 and Kala Rata. Similar grouping was
observed in the report of salt responsive miRNA-SSR [31].
Remarkably, no single genotype from a particular panel
(salinity tolerant or susceptible) is intermixed with another
panel. However, out-grouping and intermixing of quite a
few salt tolerant and susceptible genotypes were reported
previously [31,53,54]. The similarity value between genotypes in the present study ranged from 19% to 89%. In this
regard, our result is comparable to the reports published
previously [55]. Of all 18, only one cgSSR, CML11 is
located at a nearby position (17.58 Mb) of the well known
major QTL Saltol (10.8-16.4 Mb) on chromosome 1 indicating it’s possibility of being used in MAS programme
[56]. Microsatellite within genes can play vital role in gene
regulation for controlling a particular trait. SSR in CDS
can lead to a gain or loss of gene function via frameshift
mutation, SSR in 5′-UTRs can affect transcription and
translation, SSR in 3′-UTRs can disrupt splicing and,
possibly, disrupt other cellular function and intronic SSRs
can affect gene transcription and mRNA splicing [23].
The diversity analysis in the study was based on cgSSR
markers representing all classes (CDS, 5′UTR, 3′UTR
and intronic) (see Table 1). As no null alleles were
obtained, the possibility of the presence or absence of a
particular allele in contrasting genotypes is discarded.
Hence, our result clearly provoked a thought that the variation present in the salt responsive gene’s microsatellite
loci may be a key role player in the behavioral response of
rice genotypes to salinity. The variation may also play
important role in the differential molecular regulation of
those genes in rice which differs in salt sensitivity.
Conclusion
To conclude, the present study represents an extensive
identification of salt responsive candidate gene based
SSR (cgSSR) and their validation as a remarkable tools to
distinguish salt susceptible and salt tolerant rice genotypes.
The cgSSRs developed here distinctly demarcated the distance between rice genetic resources which show different
response to salinity. Identification of these types of allelic
variations within salt responsive candidate genes from
contrasting panel can provide unique genomic resources
with delivering novel alleles to develop improved varieties
for salt tolerance. Those developed cgSSRs markers have
high potential of linkage and can be utilized for gene
pyramiding in breeding programme for salt tolerance
trait in rice. They may be proved as an aid in robust
functional diversity analysis in the available array of rice
germplasms and also in natural population. As there is a
Molla et al. BMC Plant Biology (2015):
high chance of being conserved in nature, the cgSSRs
markers are hypothesized to be highly transferable to
other cereals which also face tremendous yield losses
from salinity. To insight the exact molecular mechanism
of that variation in the microsatellite loci governing
different sensitivity to salinity, further intense investigation
is required.
Page 10 of 11
7.
8.
9.
10.
Availability of supporting data
11.
Salt tolerance ad susceptible panel of rice germplasms
used for validation of cgSSR markers are available in
Additional file 1. Name of all 106 salt responsive
genes, LOC number, number and position of SSR and their
respective references are available in Additional file 2.
All 19 cgSSR marker used in the present study to
construct phylogenetic tree can be found as NCBI
probe- Pr032302526- Pr032302544. The phylogenetic
tree for the study have been submitted to DRYAD
/>
15.
Additional files
16.
Additional file 1: Rice genotypes used in diversity analysis using
salt responsive cgSSR markers.
12.
13.
14.
17.
Additional file 2: Salt responsive genes with their LOC number,
function and their number, locations.
18.
Additional file 3: Bar diagram showing frequency of different types
of cgSSR motifs found in salt responsive candidate genes of rice.
19.
20.
Competing interests
The authors declare that they have no competing interests.
21.
Authors’ contributions
KM is responsible for planning, performing the work, analysis of data, writing
the manuscript, AD is responsible for performing the work, SG is responsible for
planning as well as identification of salt responsive genes, TKM is responsible
for conceiving, planning, analysis of data and writing the manuscript. All
authors read and approved the final manuscript.
Acknowledgement
The authors thank Dr. K.V. Bhat, Head, Division of Genomic Resources,
NBPGR, New Delhi for his support and advice to carry out this work.
Mr. Showkat Ahmad Ganie is grateful to the Department of Biotechnology,
Government of India for the award of Senior Research Fellow.
22.
23.
24.
25.
Received: 10 February 2015 Accepted: 21 April 2015
26.
References
1. Fresco L. “Rice is life”. J Food Compos Anal. 2005;18(4):249–53.
2. Li J-Y, Wang J, Zeigler RS. The 3,000 rice genomes project: new opportunities
and challenges for future rice research. Gigascience. 2014;3(1):1–3.
3. Zeng L, Shannon MC. Salinity effects on seedling growth and yield
components of rice. 2000.
4. Redfern SK, Azzu N, Binamira JS. Rice in Southeast Asia: facing risks and
vulnerabilities to respond to climate change. Build Resilience Adapt Climate
Change Agri Sector. 2012;23:295.
5. IRGS. The map-based sequence of the rice genome. Nature.
2005;436(7052):793–800.
6. Powell W, Machray GC, Provan J. Polymorphism revealed by simple
sequence repeats. Trends Plant Sci. 1996;1(7):215–22.
27.
28.
29.
30.
Das B, Sengupta S, Parida SK, Roy B, Ghosh M, Prasad M, et al. Genetic
diversity and population structure of rice landraces from Eastern and North
Eastern States of India. BMC Genet. 2013;14(1):71.
Choudhary G, Ranjitkumar N, Surapaneni M, Deborah DA, Vipparla A,
Anuradha G, et al. Molecular genetic diversity of major Indian rice cultivars
over decadal periods. PLoS One. 2013;8(6):e66197.
Babu BK, Meena V, Agarwal V, Agrawal PK. Population structure and genetic
diversity analysis of Indian and exotic rice (Oryza sativa L.) accessions using
SSR markers. Mol Biol Rep. 2014;41(7):4329–39.
Zhang P, Liu X, Tong H, Lu Y, Li J. Association Mapping for Important
Agronomic Traits in Core Collection of Rice (Oryza sativa L.) with SSR
Markers. PLoS One. 2014;9(10):e111508.
Agrama HA, Eizenga GC, Yan W. Association mapping of yield and its
components in rice cultivars. Mol Breed. 2007;19(4):341–56.
Wang Z, Cheng J, Chen Z, Huang J, Bao Y, Wang J, et al. Identification of
QTLs with main, epistatic and QTL× environment interaction effects for salt
tolerance in rice seedlings under different salinity conditions. Theor Appl
Genet. 2012;125(4):807–15.
Thomson MJ, de Ocampo M, Egdane J, Rahman MA, Sajise AG, Adorada DL,
et al. Characterizing the Saltol quantitative trait locus for salinity tolerance in
rice. Rice. 2010;3(2–3):148–60.
Bernier J, Kumar A, Ramaiah V, Spaner D, Atlin G. A Large-Effect QTL for
Grain Yield under Reproductive-Stage Drought Stress in Upland Rice. Crop
Sci. 2007;47(2):507–16.
Dutta S, Kumawat G, Singh BP, Gupta DK, Singh S, Dogra V, et al.
Development of genic-SSR markers by deep transcriptome sequencing in
pigeonpea [Cajanus cajan (L.) Millspaugh]. BMC Plant Biol. 2011;11(1):17.
Varshney RK, Graner A, Sorrells ME. Genic microsatellite markers in plants:
features and applications. Trends Biotechnol. 2005;23(1):48–55.
Cho YG, Ishii T, Temnykh S, Chen X, Lipovich L, McCOUCH SR, et al. Diversity
of microsatellites derived from genomic libraries and GenBank sequences in
rice (Oryza sativa L.). Theor Appl Genet. 2000;100(5):713–22.
Yu J-K, La Rota M, Kantety R, Sorrells M. EST derived SSR markers for comparative
mapping in wheat and rice. Mol Genet Genomics. 2004;271(6):742–51.
Gao L, Jing R, Huo N, Li Y, Li X, Zhou R, et al. One hundred and one new
microsatellite loci derived from ESTs (EST-SSRs) in bread wheat. Theor Appl
Genet. 2004;108(7):1392–400.
Castillo A, Budak H, Varshney RK, Dorado G, Graner A, Hernandez P. Transferability
and polymorphism of barley EST-SSR markers used for phylogenetic analysis in
Hordeum chilense. BMC Plant Biol. 2008;8(1):97.
Zhao Y, Williams R, Prakash C, He G. Identification and characterization of
gene-based SSR markers in date palm (Phoenix dactylifera L.). BMC Plant
Biol. 2012;12(1):237.
Blair MW, Hurtado N, Chavarro CM, Muñoz-Torres MC, Giraldo MC, Pedraza
F, et al. Gene-based SSR markers for common bean (Phaseolus vulgaris L.)
derived from root and leaf tissue ESTs: an integration of the BMc series.
BMC Plant Biol. 2011;11(1):50.
Li Y-C, Korol AB, Fahima T, Nevo E. Microsatellites within genes: structure,
function, and evolution. Mol Biol Evol. 2004;21(6):991–1007.
Sharopova N. Plant simple sequence repeats: distribution, variation, and
effects on gene expression. Genome. 2008;51(2):79–90.
Tranbarger TJ, Kluabmongkol W, Sangsrakru D, Morcillo F, Tregear JW,
Tragoonrung S, et al. SSR markers in transcripts of genes linked to
post-transcriptional and transcriptional regulatory functions during
vegetative and reproductive development of Elaeis guineensis. BMC Plant
Biol. 2012;12(1):1.
Sharma A, Chauhan RS. Identification of candidate gene-based markers
(SNPs and SSRs) in the zinc and iron transporter sequences of maize
(Zea mays L.). Curr Sci. 2008;95:1051–9.
Babu BK, Agrawal PK, Gupta HS, Kumar A, Bhatt JC. Identification of
candidate gene–based SSR markers for lysine and tryptophan metabolic
pathways in maize (Zea mays). Plant Breed. 2012;131(1):20–7.
Sambrook J, Russell D. Molecular Cloning a laboratory manual. 3rd ed. New
York, USA: CSHL Press; 2001.
Kawahara Y, de la Bastide M, Hamilton JP, Kanamori H, McCombie WR,
Ouyang S, et al. Improvement of the Oryza sativa Nipponbare reference genome
using next generation sequence and optical map data. Rice. 2013;6(1):4.
Temnykh S, DeClerck G, Lukashova A, Lipovich L, Cartinhour S, McCouch S.
Computational and experimental analysis of microsatellites in rice
(Oryza sativa L.): frequency, length variation, transposon associations,
and genetic marker potential. Genome Res. 2001;11(8):1441–52.
Molla et al. BMC Plant Biology (2015):
31. Mondal T, Ganie S. Identification and characterization of salt responsive
miRNA-SSR markers in rice (Oryza sativa). Gene. 2014;535:204–9.
32. Botstein D, White RL, Skolnick M, Davis RW. Construction of a genetic
linkage map in man using restriction fragment length polymorphisms. Am J
Hum Genet. 1980;32(3):314–31.
33. Perrier X, Flori A, Bonnot F. Data analysis methods. In: Hamon P, Seguin M,
Perrier X, Glaszmann JC, editors. Genetic Diversity of Cultivated Tropical
Plants. Montpellier: Enfield Science Publishers; 2003. p. 43–76.
34. Saitou N, Nei M. The neighbor-joining method: a new method for
reconstructing phylogenetic trees. Mol Biol Evol. 1987;4(4):406–25.
35. Zhu J. Plant salt stress, Encyclopedia of life sciences. 2007.
36. Singh H, Deshmukh RK, Singh A, Singh AK, Gaikwad K, Sharma TR, et al.
Highly variable SSR markers suitable for rice genotyping using agarose gels.
Mol Breed. 2010;25(2):359–64.
37. Varshney RK, Thiel T, Stein N, Langridge P, Graner A. In silico analysis on
frequency and distribution of microsatellites in ESTs of some cereal species.
Cell Mol Biol Lett. 2002;7(2A):537–46.
38. Parida SK, Dalal V, Singh AK, Singh NK, Mohapatra T. Genic non-coding
microsatellites in the rice genome: characterization, marker design and use
in assessing genetic and evolutionary relationships among domesticated
groups. BMC Genomics. 2009;10(1):140.
39. Yu J-K, Dake TM, Singh S, Benscher D, Li W, Gill B, et al. Development and
mapping of EST-derived simple sequence repeat markers for hexaploid
wheat. Genome. 2004;47(5):805–18.
40. Fujimori S, Washio T, Higo K, Ohtomo Y, Murakami K, Matsubara K, et al. A
novel feature of microsatellites in plants: a distribution gradient along the
direction of transcription. FEBS Lett. 2003;554(1):17–22.
41. Metzgar D, Bytof J, Wills C. Selection against frameshift mutations limits
microsatellite expansion in coding DNA. Genome Res. 2000;10:72–80.
42. Parida SK, Kumar KAR, Dalal V, Singh NK, Mohapatra T. Unigene derived
microsatellite markers for the cereal genomes. Theor Appl Genet.
2006;112(5):808–17.
43. Schug MD, Hutter CM, Wetterstrand KA, Gaudette MS, Mackay TF, Aquadro
CF. The mutation rates of di-, tri- and tetranucleotide repeats in Drosophila
melanogaster. Mol Biol Evol. 1998;15(12):1751–60.
44. Gadaleta A, Mangini G, Mulè G, Blanco A. Characterization of dinucleotide
and trinucleotide EST-derived microsatellites in the wheat genome.
Euphytica. 2007;153(1–2):73–85.
45. Jain N, Jain S, Saini N, Jain R. SSR analysis of chromosome 8 regions
associated with aroma and cooked kernel elongation in Basmati rice.
Euphytica. 2006;152(2):259–73.
46. Yang G, Maroof MS, Xu C, Zhang Q, Biyashev R. Comparative analysis of
microsatellite DNA polymorphism in landraces and cultivars of rice. Mol Gen
Genet. 1994;245(2):187–94.
47. Nagaraju J, Kathirvel M, Kumar RR, Siddiq E, Hasnain SE. Genetic analysis of
traditional and evolved Basmati and non-Basmati rice varieties by using
fluorescence-based ISSR-PCR and SSR markers. Proc Natl Acad Sci.
2002;99(9):5836–41.
48. Li FP, Lee YS, Kwon SW, Li G, Park YJ. Analysis of genetic diversity and trait
correlations among Korean landrace rice (Oryza sativa L.). Genet Mol Res.
2014;13(3):6316–31.
49. Yasmin F, Islam MR, Rehana S, Mazumder RR, Anisuzzaman M, Khatun H,
et al. Molecular characterization of inbred and hybrid rice genotypes of
Bangladesh. SABRAO J Breed Genet. 2012;44(1):163–75.
50. Lisa LA, Seraj ZI, Elahi CF, Das KC, Biswas K, Islam MR, et al. Genetic variation
in microsatellite DNA, physiology and morphology of coastal saline rice
(Oryza sativa L.) landraces of Bangladesh. Plant and Soil. 2004;263(1):213–28.
51. Chattopadhyay K, Nath D, Mohanta RL, Bhattacharyya S, Marndi BC,
Nayak AK, et al. Diversity and validation of microsatellite markers
in‘Saltol’QTL region in contrasting rice genotypes for salt tolerance at the
early vegetative stage. Aust J Crop Sci. 2014;8(3):356–62.
52. Shanthi P, Jebaraj S, Geetha S, Aananthi N. DNA Finger Printing of Salt
Tolerant and Susceptible Genotypes Using MicroSatellite Markers in Rice
(Oryza sativa L.). Int J Plant Breed Genet. 2012;6:206–16.
53. Kanawapee N, Sanitchon J, Srihaban P, Theerakulpisut P. Genetic diversity
analysis of rice cultivars (Oryza sativa L.) differing in salinity tolerance based
on RAPD and SSR markers. Electron J Biotechnol. 2011;14(6):2–2.
54. Sudharani M, Reddy P, Reddy G. Identification of genetic diversity in rice
(Oryza sativa L.) genotypes using microsatellite markers for salinity tolerance.
Int J Sci Innov Discov. 2013;3:22–30.
Page 11 of 11
55. Das B, Sengupta S, Prasad M, Ghose TK. Genetic diversity of the conserved
motifs of six bacterial leaf blight resistance genes in a set of rice landraces.
BMC Genet. 2014;15(1):82.
56. Bonilla PDJ, Mackill D, Deal K, Gregorio G. RLFP and SSLP mapping of
salinity tolerance genes in chromosome 1 of rice (Oryza sativa L.) using
recombinant inbred lines. Philipp Agric Sci. 2002;85:68–76.
Submit your next manuscript to BioMed Central
and take full advantage of:
• Convenient online submission
• Thorough peer review
• No space constraints or color figure charges
• Immediate publication on acceptance
• Inclusion in PubMed, CAS, Scopus and Google Scholar
• Research which is freely available for redistribution
Submit your manuscript at
www.biomedcentral.com/submit
![Chemical and functional components in different parts of rough rice (oryza sativa l[1] ) beforeandaftergermination](https://media.store123doc.com/images/document/14/rc/qa/medium_qab1394872940.jpg)