Tissue-specifc chemical profling and quantitative analysis of bioactive components of Cinnamomum cassia by combining laser-microdissection with UPLC-Q/TOF–MS
Bạn đang xem bản rút gọn của tài liệu. Xem và tải ngay bản đầy đủ của tài liệu tại đây (1.32 MB, 9 trang )
Zhou et al. Chemistry Central Journal (2018) 12:71
/>
Open Access
RESEARCH ARTICLE
Tissue‑specific chemical profiling
and quantitative analysis of bioactive
components of Cinnamomum cassia
by combining laser‑microdissection
with UPLC‑Q/TOF–MS
Wenwen Zhou1,2, Zhitao Liang2, Ping Li1, Zhongzhen Zhao2* and Jun Chen1*
Abstract
Background: Cinnamomi Cortex, the dried stem bark of Cinnamomum cassia Presl (Rougui in Chinese) has been
widely used in traditional Chinese medicine, cooking and perfumery for thousands of years. Traditionally, the Cinnamomi Cortex of thick size is considered to be of good quality; however, there is no scientific data to support this
point. Considering that essential oils are the main bioactive components, Cinnamomi Cortex of greater variety and
amount essential oils is thought to be of better quality. In this study, laser microdissection coupled with ultra-high
performance liquid chromatography-quadrupole/time-of-flight-mass spectrometry (UPLC-Q/TOF–MS) was applied
to profile the essential oils in different tissues of Cinnamomi Cortex and to determine if there is a correlation between
the essential oil content and the stem bark thickness.
Results: We report the tissue-specific metabolic profiles of different grades of Cinnamomi Cortex. Nineteen chemical components were unequivocally or tentatively identified in the chromatogram of the test samples. The results
indicate that the bioactive components, the essential oils, were mainly present in the phloem.
Conclusion: Phloem thickness is the key character for evaluating the quality of Cinnamomi Cortex. Our results can
be of great importance in improving the cultivation, harvesting, and processing of Cinnamomi Cortex, as well as
enhancing its effects in clinical applications.
Keywords: Essential oils, Cinnamomum cassia Presl, LMD, UPLC-Q/TOF–MS
Background
Cinnamomi Cortex, is the dried stem bark of Cinnamomum cassia Presl, known as Rougui in Chinese.
It has been widely cultivated in Southeast Asia and is
commonly used in pharmaceuticals, cooking and cosmetics. Essential oils have been proven to be the main
active components of Cinnamomi Cortex [1], with
*Correspondence: ;
1
State Key Laboratory of Natural Medicines, Department
of Pharmacognosy School of Traditional Chinese Pharmacy, China
Pharmaceutical University, Tongjiaxiang‑24, Nanjing 210009, China
2
School of Chinese Medicine, Hong Kong Baptist University, Kowloon,
Hong Kong Special Administrative Region, China
cinnamaldehyde making up between 17.1 and 87.23% of
these oils [2]. Coumarin, cinnamyl alcohol, cinnamic acid
and 2-methoxycinnamaldehyde also comprise significant
proportions of the essential oils [3]. Previous pharmacological studies have demonstrated that the essential oils
of Cinnamomi Cortex have antioxidant, antidiabetic,
anti-platelet aggregation and antifungal activities [4–7].
Thus, in this study, five compounds, namely coumarin,
cinnamyl alcohol, cinnamic acid, cinnamaldehyde and
2-methoxycinnamaldehyde, were selected as chemical
markers for determination.
Currently various specifications of different grades of
Cinnamomi Cortex have been found in the herbal market,
© The Author(s) 2018. This article is distributed under the terms of the Creative Commons Attribution 4.0 International License
(http://creativecommons.org/licenses/by/4.0/), which permits unrestricted use, distribution, and reproduction in any medium,
provided you give appropriate credit to the original author(s) and the source, provide a link to the Creative Commons license,
and indicate if changes were made. The Creative Commons Public Domain Dedication waiver (http://creativecommons.org/
publicdomain/zero/1.0/) applies to the data made available in this article, unless otherwise stated.
Zhou et al. Chemistry Central Journal (2018) 12:71
such as Zhong tong (cylindric as sample RGgxdxzt),
Ban gui (plate-like as sample RGgxpnbg), and Guan gui
(scroll-like or groove shape as sample RGgxpngg). In
clinical applications, they are typically used without discrimination, but is there a clinical difference? Comparing
the chemical composition of different grades will enable
us to determine the difference between grades and will
help us evaluate whether these differences are significant
in terms of applications. Modern laboratory studies have
focused on HPLC-based fingerprint chromatography
and determination of characteristic components [8–10].
However, evaluating the quality of Cinnamomi Cortex by
modern instruments is time-consuming and inconvenient. Traditionally, the Cinnamomi Cortex of thick size
is thought to be of good quality; but there is no scientific evidence to support this point. In the present study,
various samples of Cinnamomi Cortex of different grades
were collected for tissue-specific chemical analysis combining laser micro-dissected system (LMD) with ultraperformance liquid chromatography quadrupole time of
flight mass spectrometry (UPLC-Q/TOF–MS). Through
this study, the relationship between microscopic features
and active components can be established; this relationship will enable people to evaluate pharmaceutical quality of Cinnamomi Cortex by appearance. The research
also provides helpful information that can guide the cultivating, collecting and processing of Cinnamomi Cortex
for maximum quality in applications.
Experiment section
Plant materials
The plant materials were collected from six major cultivation areas. Table 1 shows the details including sources
and morphological descriptions for each sample. Figure 1
shows the characteristic appearance of a sample. All the
plant materials were identified by Prof. Zhongzhen Zhao,
School of Chinese Medicine, Hong Kong Baptist University. The voucher specimens are deposited in the Bank of
China (Hong Kong) Chinese Medicines Centre of Hong
Kong Baptist University.
Chemicals and reagents
Chemical standards including coumarin, cinnamyl alcohol, cinnamic acid, cinnamaldehyde and 2-methoxycinnamaldehyde were purchased from Shanghai Tauto
Biotech Company (Shanghai, China). The purity of each
standard was over 98%. Acetonitrile and methanol of
HPLC grade were from E. Merck (Darmstadt, Germany),
and formic acid of HPLC grade was from Tedia (Fairfield,
USA). Water was purified using a Milli-Q water system
(Millipore; Bedford, MA, USA).
Page 2 of 9
Materials and instruments
Leica Laser microdissection 7000 system (Leica, Benshein, Germany), Agilent 6540 ultra-performance liquid
chromatography quadrupole time of flight spectrometer
equipped with a mass hunter workstation software (Agilent version B.06.00 series, Agilent Technologies, USA),
Cryotome (Thermo Shandon As620 Cryotome, Cheshire, UK), Ultrasonic instrument (CREST 1875HTAG
Ultrasonic Processor, CREST, Trenton, NJ), Centrifuge
(Centrifuge 5417R, Eppendorf, Hamburg, Germany),
Electronic balance (Mettler Toledo MT5 style), Nonfluorescent polyethylene terephthalate (PET) microscope
steel frame slide (76 × 26 mm, 1.4 μm, Leica Microsystems, Bensheim, Germany), Centrifuge tube (500 μL,
1.5 mL, Leica), HPLC grade vial (1.5 mL, Grace, Hong
Kong), glass insert with plastic bottom spring (400 μL,
Grace, Hong Kong), Acquity UPLC BEH C18 column
(2.1 × 100 mm, 1.7 μm, Waters, USA), C18 pre-column
(2.1 × 5 mm, 1.7 μm, Waters, USA).
Sample solution preparations
The dried medicinal materials were firstly softened by
infiltrating with water-soaked paper. The softened Cinnamomi Cortex was cut into small sections, fixed by cryogen, and then frozen on a − 20 °C cryobar. Serial slices
of 40 μm in thickness were cut at − 10 °C. Each cross-section of tissue was mounted directly to a non-fluorescent
polyethylene terephthalate. The slide was exposed under
a Leica LMD 7000 microscopic system. Microdissection
was conducted by a DPSS laser beam at 349 nm wavelength, aperture of 30, speed of 3, power of 50 μJ and
pulse frequency of 1695 Hz under a Leica LMD system at
6.3 × magnification. Four different target tissues, approximately 1 × 106 μm2 per each, were individually separated.
The microdissected tissues fell into caps of 500 μL micro
centrifuge tubes by gravity. Lastly, the separated tissue
part in each cap was transferred to the bottom of the tube
by centrifuging for 10 min (12,000 rpm, 17 °C). 100 μL
methanol was added into each micro centrifuge tube. The
tube was sonicated for 60 min and then centrifuged again
for 10 min (12,000 rpm, 17 °C). 90 μL of the supernatant
was transferred into a glass insert with plastic bottom
spring in a 1.5 mL brown HPLC grade vial and stored at
4 °C before analysis.
Standard solution preparation
Each standard compound was accurately weighed by
an analytical balance and dissolved in methanol to
produce mixed stock solution with concentrations at
103.05 μg/mL of coumarin, 12.32 μg/mL of cinnamyl
alcohol, 132.7 μg/mL of cinnamic acid, 106.94 μg/mL of
Zhou et al. Chemistry Central Journal (2018) 12:71
Page 3 of 9
Table 1 Sample information of Cinnamomum cassia materials
Sample no. Locality
Grade
Morphological description
Mean
thickness
(mm)
Surface
Cross-section
Proportions
of each tissue
(%)
CK C
PE PH
RGyueaj
Wen’an, Vietnam
Grade A
Externally greyish-white, slightly rough, showing greyish-green streak, internally reddishbrown
Pericycle banded
3.7
6
13
RGyuebj
Wen’an, Vietnam
Grade B
Both externally and internally reddish-brown,
slightly even
Pericycle banded
3.0
–
20 14 66
RGyuecj
Wen’an, Vietnam
Grade C
Externally greyish-brown, slightly rough, showing greyish-white streak, internally reddishbrown
Pericycle banded
3.1
6
17 11 66
RGgxdxjcy
Guangxi, China
Not specific Externally greyish-brown, slightly rough, internally pale brown
Pericycle banded
3.1
7
24 28 41
RGgxpnjcy
Guangxi, China
Not specific Externally brown, slightly rough, internally
brownish-red
Pericycle banded
2.4
4
20 11 65
RGgddqjcy
Guangdong, China Not specific Externally greyish-brown, relatively rough,
internally pale brownish
Pericycle banded
4.1
5
27 28 40
RGgxdxzt
Guangxi, China
Zhong tong Externally greyish-brown, slightly rough, internally dark brown
Pericycle banded
3.7
4
29 25 42
RGgxpnzt
Guangxi, China
Zhong tong Externally pale brown, slightly rough, internally
dark brown
Pericycle scattered 5.9
5
32 38 25
RGgddqzt
Guangdong, China Zhong tong Externally greyish-brown, slightly rough, internally brownish-red
Pericycle scattered 4.7
10
17 24 49
RGyunaj
Yunnan, China
Grade A
Externally greyish-brown, relatively rough,
showing greyish-white or greyish-green
streak, internally reddish-brown
Pericycle banded
4.1
7
16 10 67
RGyunbj
Yunnan, China
Grade B
Externally greyish-brown, relatively rough,
showing greyish-white or greyish-green
streak, internally reddish-brown
Pericycle banded
4.3
2
21 38 39
RGyuncj
Yunnan, China
Grade C
Externally greyish-brown, relatively rough,
showing greyish-white or greyish-green
streak, internally reddish-brown
Pericycle scattered 3.8
5
24 26 45
RGgxpnbg
Guangxi, China
Ban gui
Externally dark brown, slightly rough, internally
brownish-red
Pericycle banded
6.0
6
31 21 42
RGgxdxbg
Guangxi, China
Ban gui
Externally greyish-brown, slightly rough, internally dark brownish-red
Pericycle scattered 2.4
5
31 29 35
RGlw
Laos
Not specific Externally greyish-brown, slightly rough, internally dark brown
Pericycle banded
3.0
6
27 34 33
RGgxpngg
Guangxi, China
Guan gui
Pericycle banded
3.6
4
55 16 25
Externally dark brown, slightly rough, internally
pale brown
cinnamaldehyde, 157.6 μg/mL of 2-methoxycinnamaldehyde. A series of mixed standard solutions was prepared
by dilution with methanol.
Method of UPLC‑Q/TOF–MS
The UPLC-Q/TOF–MS analysis was conducted at room
temperature (20 °C). The mobile phase consisted of 0.1%
formic acid–water (A) and 0.1% formic acid-acetonitrile
(B). The gradient program was optimized as follows:
0–8 min, 5–35%B; 8–21 min, 35–65%B; 21–27 min,
65–100%B; 27–31 min, 100%B; 31–31.1 min, 100–5%B;
31.1–35 min, 5%B. The injection volume was 3 μL for
each sample. The flow rate was set at 0.4 mL/min. The
5 76
mass spectra was acquired in positive mode with mass to
charge ratio (m/z) ranging from 100 to 1700. The operation parameters of the mass spectrometer were set as follows: dry gas temperature, 300 °C; dry gas ( N2) flow rate,
8.0 L/min; nebulizer pressure, 40 psi; capillary voltage,
3500 V; nozzle voltage, 500 V; and fragmentor voltage,
120 V. The energies for collision-induced dissociation
(CID) for fragmentation were set at 20 and 35 eV.
Method validation
Linearity, limits of detection (LODs), limits of quantification (LOQs), repeatability, stability, intra-day precision
and inter-day precision were assessed. A series of diluted
Zhou et al. Chemistry Central Journal (2018) 12:71
Page 4 of 9
RGyueaj
RGyuebj
RGyuecj
RGgxpnjcy
RGgddqjcy
RGgxdxzt
RGgddqzt
RGgxpnbg
RGgxdxjcy
RGgxpnzt
RGyunbj
RGyunaj
RGgxdxbg
RGyuncj
RGgxpngg
RGlw
5cm
Fig. 1 The characteristic appearance of cinnamon materials
mixed standard solutions was analyzed subsequently
from low to high concentration for linearity, LODs and
LOQs. The phloem of RGyueaj was selected for validating
the method’s repeatability and stability. Repeatability was
evaluated by six replicated analyses of the phloem at the
similar locations in six tissue slices. Stability was tested
on one sample solution at 0, 12, 24, 36, 48 h. Intra-day
precision was performed by analyzing five replications of
the mixed standard solution in 1 day while inter-day precision was examined by analyzing three replications of
the solution in three consecutive days.
a
b
Cork
Cortex
Pericycle
Results and discussion
Phloem
Microscopic examination and dissection by LMD
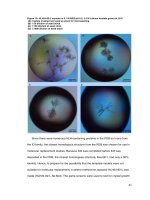
As shown under the normal light and fluorescence mode
(Fig. 2), the transverse section of Cinnamomi Cortex
could be divided into four portions: cork (CK), cortex
(C), pericycle (PE) and phloem (PH). Cork consists of
several layers of cells and emits bluish-grey fluorescence.
Cortex has a scattering of stone cells. Dark brown fluorescence was emitted from cortex to phloem, while a
bright blue color was emitted from the pericycle. Pericycle was arranged in an interrupted ring. Phloem was
broad with rays 1–2 rows of cells wide. Since different
200μm
Fig. 2 Microscopic characteristics of the Cinnamomum cassia
(RGyueaj). a Observed under the light microscopy. b Observed under
the fluorescent microscopy
tissues possessed various features and could be distinguished under fluorescence mode, each separated tissue
was dissected at the size of about 1,000,000 μm2 by LMD.
Zhou et al. Chemistry Central Journal (2018) 12:71
Page 5 of 9
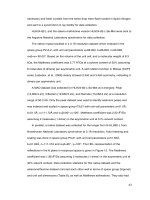
Tissue‑specific chemical profiling
Tissue-specific chemical profiles were obtained as base
peak chromatograms by UPLC-Q/TOF–MS (representative chromatograms are showed in Fig. 3). A total
of 19 peaks were unequivocally or tentatively identified in the chromatogram of the medicinal material
sample RGyuncj by comparing their retention times,
m/z of molecular ions and/or fragment ions with standards or reported references [2, 11–16]. Five peaks were
positively identified. Peaks 11, 13, 14, 15 and 16 were
unambiguously identified as coumarin (147.0438 m/z,
[M + H]+), cinnamic acid (149.0595 m/z, [M
+ H]+),
+
cinnamaldehyde (133.0647 m/z, [M
+ H] ), cinnamyl
alcohol (135.0802 m/z, [M + H]+) and 2-methoxycinnamaldehyde (163.0750 m/z, [M + H]+), respectively. 13
peaks were tentatively identified by comparison of their
molecular ions of [M + H]+ or [M + Na]+ from literature
reports. The detailed results are shown in Table 2.
As seen from Table 3, peak 10 couldn’t be detected
in any tissue of any sample. It can be assumed that the
content of peak 10 is below LOD in herbal tissues. The
totality of chemicals in cortex (5–12 peaks) and phloem
(5–10 peaks) was slightly greater than those in cork (4–8
peaks) and pericycle (5–8 peaks). Peaks 11, 13, 14, 15, 16,
namely coumarin, cinnamic acid, cinnamaldehyde, cinnamyl alcohol and 2-methoxycinnamaldehyde, could be
detected in almost every tissue. Distinctly, the areas of
these peaks were larger than those of other chemicals.
Therefore, further quantitative analysis of them was carried out.
Quantification of essential oils in various tissues
The results of method validation are presented in Table 4.
The regression equation for each compound was calculated in the form of y = ax + b, where y and x were peak
area and amount of compound injected, respectively.
Each calibration curve possessed good linearity with
correlation coefficients (r2) ≥ 0.9953 within the selected
range. The LODs and LOQs were determined at signal-to-noise (S/N) ratios of 3 and 10, respectively. The
repeatability ranged from 5.34 to 27.56%. The RSD value
of stability was less than 11.66%, indicating that the stability of current method in this study was acceptable. The
above assay results indicate that this developed method is
reproducible, precise and sensitive enough for tissue-specific determination of five analytes in Cinnamomi Cortex.
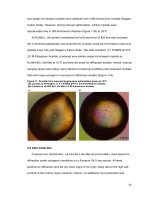
The results of quantitative analysis (Additional file 1:
Table S1 and Fig. 4) demonstrated that the content of cinnamaldehyde was much higher than other chemicals.
Cinnamaldehyde was concentrated in phloem except for
sample RGlw, where it was most abundant in the pericycle. 2-methoxycinnamaldehyde showed the same pattern
Blank
10, 11
1, 2
7
12
RGyuncj
13
15, 16
14
17
18
RGyuncj-CK
11
RGyuncj-C
11
RGyuncj-PE
11
RGyuncj-PH
11
12
13
15, 16
Fig. 3 Representative UPLC-Q/TOF–MS base peak chromatograms of medicinal material sample and various tissues from Cinnamomum cassia
Zhou et al. Chemistry Central Journal (2018) 12:71
Page 6 of 9
Table 2 Chemical characterization of medicinal material sample of RGyuncj by UPLC-Q/TOF–MS
Peak
no.
Identification
tR (min) Molecular
formular
Measured
mass (m/z)
Theoretical
mass (m/z)
Mass
accuracy
(ppm)
Ion type
MS/MS (m/z)
1
Fructosea
0.71
C6H12O6
203.0522
203.0532
− 4.92
[M + Na]+
185[M+Na-H2O]+, 157[M+Na-CH2O2]+,
136[M+H-CHO2]+
2
Sucrosea
3
(+)-Catechina
0.71
C12H22O11
3.33
C15H14O6
365.1048
365.1060
− 3.29
[M + Na]+
351[M+Na-CH2]+, 203[M+Na-C6H10O5]+
291.0856
291.0863
− 2.40
[M + H]+
4
Procyanidin B1
or B2a
3.34
185[M+H-C3H6O4]+, 123[M+H-C12H8O]+
C30H26O12
579.1484
579.1497
− 2.24
[M + H]+
409[M+H-C8H10O4]+, 309[M+HC9H18O9]+, 123[M+H-C27H19O7]+
5
B-type procyanidin
trimera
3.92
C45H38O18
867.2116
867.2131
− 1.73
[M + H]+
579[M+H-C13H20O7]+, 439[M+HC16H28O13]+, 377[M+H-C17H30O16]+,
344[M+H-C18H35O17]+, 123[M+HC42H31O13]+
6
Procyanidin B1
or B2a
3.92
C30H26O12
579.1487
579.1497
− 1.73
[M + H]+
439[M+H-C7H8O3]+, 344[M+HC7H13O8]+, 289[M+H-C12H18O8]+
123[M+H-C27H19O7]+
7
B-type procyanidin
tetramera
4.10
C60H50O24
1155.2741
1155.2765
− 2.08
[M + H]+
867[M+H-C8H18O9]+, 579[M+HC22H40O17]+, 483[M+H-C45H20O7]+,
351[M+H-C46H28O14]+, 171[M+HC52H40O20]+
8
Cinnzeylanola
4.67
C20H32O7
407.2037
407.2046
− 2.21
[M + Na]+
349[M+H-C2H2O2]+, 331[M+H-C6H4]+,
123[M+H-C17H25O2]+
9
Cinnacasside Ea
5.20
C25H38O11
537.2297
537.2312
− 2.79
[M + Na]+
303[M+H-C9H14O7]+, 123[M+HC22H31O6]+
10
Guiacola
6.23
C7H8O2
147.0438
147.0422
10.88
[M + Na]+
118[M+Na-CHO]+, 103[M+Na-C2H4O]+
11
Coumarinb
6.23
C9H6O2
147.0438
147.0440
− 1.36
[M + H]+
103[M+H–CO2]+, 91[M+H-C3H4O]+,
77[M+H-C3H2O2]+
65[M+H-C4H2O2]+
12
2-Hydroxycinnamaldehydea
6.40
C9H8O2
149.0592
149.0597
− 3.35
[M + H]+
131[M+H-H2O]+, 121[M+H-CO]+,
103[M+H-CH2O2]+
93[M+H-C3H4O]+, 91[M+H-C2H2O2]+,
77[M+H-C3H4O2]+
65[M+H-C4H4O2]+, 55[M+H-C5H2O2]+
13
Cinnamic acidb
7.79
C9H8O2
149.0595
149.0597
− 1.34
[M + H]+
131[M+H-H2O]+, 123[M+H-C2H2]+,
103[M+H-CH2O2]+
14
(E)-Cinnamaldehydeb
8.28
C9H8O
133.0647
133.0648
− 0.75
[M + H]+
115[M+H-H2O]+, 105[M+H-CO]+,
103[M+H-CH2O]+
91[M+H-C2H2O]+, 79[M+H-C3H2O]+,
77[M+H-C3H4O]+
55[M+H-C6H6]+
15
Cinnamyl alcoholb
9.39
C9H10O
135.0802
135.0804
− 1.48
[M + H]+
117[M+H-H2O]+, 91[M+H-C2H4O]+,
55[M+H-C6H8]+
16
2-Methoxycinnamaldehydeb
9.39
C10H10O2
163.0750
163.0754
− 2.45
[M + H]+
145[M+H-H2O]+, 135[M+H-CO]+,
115[M+H-CH5O2]+
107[M+H-C3H4O]+, 105[M+H-C2H2O2]+,
91[M+H-C3H4O2]+
79[M+H-C4H4O2]+, 77[M+H-C4H6O2]+,
57[M+H-C7H6O]+
55[M+H-C7H8O]+
17
Unknown
13.00
C15H24O2
237.1829
237.1849
− 8.43
[M + H]+
71[M+H-C10H13O2]+, 81[M+H-C11H8O]+,
89[M+H-C10H12O]+
93[M+H-C10H8O]+, 105[M+H-C9H8O]+,
149[M + H-C4H8O2]+
219[M+H-H2O]+
18
Dehydro-sesquiterpene oxidea
16.56
C15H22O
219.1741
219.1743
− 0.91
[M + H]+
150[M+H-C4H5O]+, 135[M+H-C5H8O]+,
121[M+H-C6H10O]+
19
Dehydro-sesquiterpenea
18.54
C15H22
203.1791
203.1794
− 1.48
[M + H]+
185[M+Na-C3H5]+, 150[M+H-C4H5]+,
136[M+H-C5H7]+
123[M+H-C6H8]+, 103[M+H-C7H16]+
a
Identified by previous literature reports
b
Identified by standards
Zhou et al. Chemistry Central Journal (2018) 12:71
Page 7 of 9
Table 3 The chromatographic peaks found in the chromatograms of each tissue in different specifications of cinnamon
Sample no.
Tissues/peak no. (T: totality)
CK
T
C
T
PE
T
PH
T
RGyueaj
1, 2, 11, 12, 13, 14, 15, 16
8
1, 2, 5, 9, 11, 12, 13, 14, 15, 16, 19
11
1, 2, 11, 13, 14, 15, 16
7
1, 2, 11, 13, 14, 15, 16
7
RGyuebj
1, 2, 11, 12, 13, 14, 15, 16
8
1, 2, 3, 4, 6, 9, 11, 13, 14, 16
10
1, 2, 4, 11, 14, 16
6
1, 2, 4, 9, 11, 13, 14, 15, 16
9
11
RGyuecj
1, 2, 11, 13, 14, 15, 16
7
1, 2, 4, 5, 7, 9, 11, 13, 14, 15, 16
RGgxdxjcy
8, 11, 14, 16
4
2, 4, 8, 11, 13, 14
6
1, 2, 11, 13, 14, 15, 16
7
1, 2, 11, 12, 13, 14, 15, 16
8
2, 8, 9, 11, 13, 14, 15, 16
8
2, 8, 11, 13, 14, 16
6
RGgxpnjcy
11, 13, 14, 15, 16
5
11, 13, 14, 15, 16
5
11, 13, 14, 15, 16
5
11, 13, 14, 15, 16
5
RGgddqjcy
11, 13, 14, 15, 16
5
11, 13, 14, 15, 16
5
11, 13, 14, 15, 16
5
11, 13, 14, 15, 16
5
RGgxdxzt
2, 11, 13, 14, 15, 16
6
2, 4, 6, 8, 11, 13, 14, 15, 16
9
2, 11, 13, 14, 15, 16
6
2, 11, 13, 14, 15, 16
6
RGgxpnzt
2, 11, 13, 14, 15, 16
6
2, 3, 5, 6, 8, 11, 13, 14, 15, 16
10
2, 11, 13, 14, 15, 16
6
2, 11, 13, 14, 15, 16
6
RGgddqzt
1, 11, 13, 14, 15, 16
6
1, 4, 5, 7, 8, 11, 13, 14, 15, 16
10
1, 2, 11, 13, 14, 15, 16
7
1, 2, 4, 5, 8, 11, 13, 14, 15, 16
RGyunaj
11, 13, 14, 15, 16
5
4, 5, 7, 11, 12, 13, 14, 15, 16
9
11, 13, 14, 15, 16
5
2, 11, 13, 14, 15, 16
6
RGyunbj
1, 4, 11, 13, 14, 15, 16
6
1, 4, 5, 11, 13, 14, 15, 16
8
1, 2, 11, 13, 14, 15, 16
7
1, 2, 11, 12, 13, 14, 15, 16
8
12
10
RGyuncj
1, 11, 13, 14, 15, 16
6
1, 2, 4, 5, 7, 8, 9, 11, 13, 14, 15, 16
1, 11, 12, 13, 14, 15, 16
7
1, 11, 12, 13, 14, 15, 16, 18
8
RGgxpnbg
11, 13, 14, 15, 16
5
11, 13, 14, 15, 16
5
11, 13, 14, 15, 16
5
11, 13, 14, 15, 16
5
RGgxdxbg
11, 12, 13, 14, 15, 16
6
11, 13, 14, 15, 16
5
11, 13, 14, 15, 16
5
11, 13, 14, 15, 16
5
RGlw
2, 8, 11, 12, 13, 14, 15, 16
8
2, 8, 9, 11, 12, 13, 14, 15, 16
9
2, 11, 12, 13, 14, 15, 16
7
1, 2, 8, 11, 13, 14, 15, 16
8
RGgxpngg
11, 13, 14, 15, 16
5
2, 4, 11, 13, 14, 15, 16
7
2, 11, 13, 14, 15, 16
6
2, 11, 13, 14, 15, 16
6
Table 4 Method validation results
Analyte
Calibration curve
Linear range
(ng/mL)
r2
LODs (ng/ LOQs
mL)
(ng/mL)
Repeatability Stability
(n = 6, RSD, %) (n = 5, RSD,
%)
Precision RSD (%)
Intra-day
(n = 5)
Inter-day
(n = 3)
Coumarin
y = 905852x − 26008 51.525–1030.5 0.9981
19.1
56.1
17.43
5.99
3.17
2.81
Cinnamyl
alcohol
y = 1486.4x − 350.23
29.0
147.3
27.56
2.03
6.13
32.66
267.6–11339
0.9970
Cinnamic acid
y = 66690x − 2038
66.35–1327
0.9982
159.3
334.2
5.34
7.34
4.31
5.27
Cinnamaldehyde
y = 539.3x + 833.7
2615.6–
111058
0.9996
513.2
1053.0
10.37
3.40
2.45
30.50
39.4–394
0.9953
9.3
52.7
9.26
11.66
23.97
28.40
2-Methoxycin- y = 1*106x − 5380.3
namaldehyde
of occurrence as cinnamaldehyde. Cinnamic acid was
enriched in pericycle of sample RGgxdxjcy and in cork of
samples RGgxpnzt and RGlw as well as in phloem of other
samples. For all samples, phloem contained the highest
amount of coumarin. Cinnamyl alcohol showed the highest content in phloem of one sample, in pericycle of six
samples and in cork of others; thus, for this component,
the pattern of distribution was difficult to determine. The
irregularity may be due to its low content and/or its tendence to esterify easily.
Conclusions
In the present study, an approach using LMD combined
with UPLC-Q/TOF–MS was established to map the distribution of essential oils in tissues of various specifications of Cinnamomi Cortex. It is the first report with
Zhou et al. Chemistry Central Journal (2018) 12:71
PH
1
CK
C
Tissues
125
al
25
ac
5
de
C
PE
PH
me
al
25
ac
5
de
PH
me
ng/1x106μm2
ng/1x106μm2
125
125
al
25
ac
5
de
1
CK
al
25
ac
5
de
PH
me
ng/1x106μm2
ng/1x106μm2
125
Tissues
PE
me
25
ac
5
de
C
PE
PH
al
ac
10
de
CK
C
me
125
al
25
ac
5
de
C
PE
PH
me
co
al
100
ac
10
1
de
CK
C
al
25
ac
5
de
C
PE
PH
PH
me
me
Tissues
al
100
ac
10
de
C
PE
me
co
1000
al
100
ac
10
1
de
CK
C
PE
PH
me
RGgxpngg
co
CK
PH
Tissues
1000
1
PE
RGyuncj
co
CK
me
Tissues
125
1
PH
1000
RGlw
co
CK
PE
PE
RGgxpnzt
100
1
C
Tissues
Tissues
625
1
de
CK
RGyunbj
al
CK
me
ac
Tissues
125
1
PH
co
RGgxdxbg
co
PE
PH
co
RGgxpnbg
C
PE
C
1000
Tissues
625
CK
C
625
Tissues
1
CK
RGyunaj
co
PE
1
al
RGgxdxzt
co
RGgddqzt
C
de
Tissues
625
CK
5
co
64
32
16
8
4
2
1
Tissues
625
Tissues
1
me
ac
RGgddqjcy
co
ng/1x106μm2
ng/1x106μm2
RGgxpnjcy
CK
PH
25
Tissues
625
1
PE
al
ng/1x106μm2
me
de
125
ng/1x106μm2
PE
5
ng/1x106μm2
C
ac
ng/1x106μm2
CK
25
ng/1x106μm2
1
de
al
co
ng/1x106μm2
ac
10
125
RGgxdxjcy
625
PH
me
ng/1x106μm2
al
100
RGyuecj
co
625
ng/1x106μm2
RGyuebj
co
1000
ng/1x106μm2
ng/1x106μm2
RGyueaj
Page 8 of 9
co
1000
al
100
ac
10
1
de
CK
Tissues
C
PE
PH
me
Tissues
Fig. 4 The contents of coumarin (co), cinnamyl alcohol (al), cinnamic acid (ac), 2-methoxycinnamaldehyde (me), cinnamaldehyde (de) in the tissue
samples
respect to tissue-specific metabolites in the cortex of an
herb. This histochemical study identified Cinnamomi
Cortex phloem as the tissue richest in essential oils.
Thus, it would be logical to deduce that Cinnamomi
Cortex with thick phloem is of better quality as it contains more active constituents. In fact, this is consistent
with the traditional processing method of removing the
outer bark. Our analytical method provides references
for evaluating the quality and classifying the grades of
Cinnamomi Cortex by thickness of phloem. Further
studies can be conducted to explore the factors affecting phloem thickness. Therefore, this research can be of
great importance in the cultivation, harvesting, processing and clinical application of Cinnamomi Cortex.
Additional file
Additional file 1: Table s1. Contents of essential oils in various tissues of
the samples.
Authors’ contributions
WZ and ZL initiated and all authors designed the study. WZ carried out the
histochemical experiment and drafted the manuscript. PL and ZZ provided
technical support. All authors contributed to the data analysis and to finalizing
the manuscript. ZZ has made his intellectual contributions in authenticating
the materials. JC contributed her intellectual content for revising the manuscript. All authors read and approved the final manuscript.
Acknowledgements
This work was supported by the National Natural Science Foundation of China
(NSFC) (Project No. 11475248). We acknowledge Mr. Alan Ho from the School
of Chinese Medicine, Hong Kong Baptist University, for his technical assistance.
We also acknowledge Shenzhen Tsumura Co. Ltd for the help in sample
collection.
Competing interests
The authors declare that they have no competing interests.
Ethics approval and consent to participate
Not applicable.
Publisher’s Note
Springer Nature remains neutral with regard to jurisdictional claims in published maps and institutional affiliations.
Received: 21 June 2017 Accepted: 5 June 2018
References
1. Zhang GZ, Zhang SN, Meng QH, Wang XD (2009) GC-MS analysis on
chemical components of Cortex Cinnamomi and Guipi. Chin J Pharm
Anal 29:1256–1259
Zhou et al. Chemistry Central Journal (2018) 12:71
2. Chen PY, Yu JW, Lu FL, Lin MC, Cheng HF (2016) Differentiating parts of
Cinnamomum cassia using LC-qTOF-MS in conjunction with principal
components analysis. Biomed Chromatogr 30:1449–1457
3. Yuan PF, Shang MY, Cai SQ (2012) Study on fingerprints of chemical
constituents of Cinnamomi ramulus and Cinnamomi cortex. Chin J Chin
Mater Med 37:2917–2921
4. Mathew S, Abraham TE (2006) Studies on the antioxidant activities of
cinnamon (Cinnamonum verum) bark extracts, through various in vitro
models. Food Chem 94:520–528
5. Subash Babu P, Prabuseenivasan S, Ignacimuthu S (2007) Cinnamaldehyde: a potential antidiabetic agent. Phymed 14:15–22
6. An FL, Zhang Z, Xiang CK, Kang LF (2009) Component analysis of
essential oils from Cinnamon and their inhibition action against platelet
aggregation. Chin Pharm 18:25–27
7. Giordani R, Regli P, Kaloustian J, Portugal H (2006) Potentiation of antifungal activity of amphotericin B by essential oil from Cinnamomum cassia.
Phytother Res 20:58–61
8. Ding Y, Wu EQ, Liang C, Chen JB, Tran MN, Hong CH, Jang Y, Park KL, Bae K,
Kim YH, Kang JS (2011) Discrimination of cinnamon bark and cinnamon
twig samples sourced from various countries using HPLC-based fingerprint analysis. Food Chem 127:755–760
9. He ZD, Qiao CF, Han QB, Cheng CL, Xu HX, Jiang RW, But PH, Shaw PC
(2005) Authentication and quantitative analysis on the chemical profile of
cassia bark (Cortex Cinnamomi) by high-pressure liquid chromatography.
J Agric Food Chem 53:2424–2428
10. Huang YT, Pan T, Wen J, Tang XY, Sun YS, Chi L, Peng P, Shi RB (2015)
Quality representation and correlation analysis of the characteristic
spectrum of Rougui based on drug system. J Beijing Univ Tradit Chin Med
38:344–350
Page 9 of 9
11. Wei L, Song YL, Guo XY, Tu PF, Jiang Y (2014) Habitat differentiation
and degradation characterization of Cinnamomi Cortex by 1H NMR
spectroscopy coupled with multivariate statistical analysis. Food Res Int
67:155–162
12. Shan B, Cai YZ, Brooks JD, Corke H (2007) Antibacterial properties and
major bioactive components of Cinnamon Stick (Cinnamomum burmannii): activity against foodborne pathogenic bacteria. J Agric Food Chem
55:5484–5490
13. Chen P, Sun JH, Ford P (2014) Differentiation of the four major species of
cinnamons (C. burmannii, C. verum, C. cassia, and C. loureiroi) using a flow
injection mass spectrometric (FIMS) fingerprinting method. J Agric Food
Chem 62:2516–2521
14. Liao SG, Yuan T, Zhang C, Yang SP, Wu Y, Yue JM (2009) Cinnacassides A-E,
five geranylphenylacetate glycosides from Cinnamomum cassia. Tetrahedron 65:883–887
15. Anderson RA, Broadhurst CL, Polansky MM, Schmidt WF, Khan A, Flanagan
VP, Schoene NW, Graves DJ (2004) isolation and characterization of
polyphenol type-A polymers from cinnamon with insulin-like biological
activity. J Agric Food Chem 52:65–70
16. Avula B, Smilliea TJ, Wang YH, Zweigenbaum J, Khan IA (2014) Authentication of true cinnamon (Cinnamomi Cortex verum) utilising direct analysis
in real time (DART)-QToF-MS. Food Addit Contam 32:1–8