Nghiên cứu ứng ảnh hưởng của chất điều hòa sinh trưởng thực vật brassinolide đến khả năng chịu mặn của lúa cao sản vùng đồng bằng sông cửu long tt tiếng anbh
Bạn đang xem bản rút gọn của tài liệu. Xem và tải ngay bản đầy đủ của tài liệu tại đây (541.39 KB, 27 trang )
MINISTRY OF EDUCATION AND TRAINING
CAN THO UNIVERSITY
SUMMARY OF DOCTORAL THESIS
Specialization: Crop Science
Code: 62 62 01 10
LE KIEU HIEU
EFECTS OF BRASSINOLIDE PLANT
GROWTH REGULATOR ON SALINE
TOLERANCE OF HIGH YIELD RICE
IN THE MEKONG DELTA
Can Tho, 2020
THE THESIS HAS BEEN COMPLETED AT CAN
THO UNIVERSITY
Instructor 1: Prof. Dr. Nguyen Bao Ve
Instructor 2: Assoc. Prof. Dr. Pham Phuoc Nhan
The thesis is defended in front of the University
Examination Council in Can Tho University.
Place:....................................................................................
Time:…………..……………Date:…………….…….…....
Reviewer 1:..........................................................................
Reviewer 2:..........................................................................
Further information of the thesis could be found at:
1. Learning Resource Center of Can Tho University
2. National library of Vietnam
LIST OF PUBLISHED PAPERS
1. Le Kieu Hieu, Nguyen Bao Ve and Pham Phuoc Nhan.
2019. Effects of brassinolide on the restriction of salinity
damage on rice plants under nethouse conditions. Vietnam
Agricultural Science and Technology Journal, No. 1: 32-39.
2. Le Kieu Hieu. Pham Phuoc Nhan and Nguyen Bao Ve.
2019. Effects of brassinolide on physiological and
biochemical characteristics of salinity tolerant rice (6‰)
in the seedling stage. Vietnam Agricultural Science and
Technology Journal, No. 2: 44-49.
3. Le Kieu Hieu, Nguyen Bao Ve and Pham Phuoc Nhan.
2019. Effects of brassinolide on restriction of salt
harmfulness on field rice in Bac Lieu province. Vietnam
Agricultural Science and Technology Journal, No. 8: 62-66.
CHAPTER 1: INTRODUCTION
1.1 The urgency of the thesis
In recent years, the saline intrusion has become more and more complicated. In
some coastal provinces of the Mekong Delta, saline water deeply penetrated into the
paddy rice fields, disturbed seriously people livelihood and crop production activities.
Especially, in the first quarter of 2016, saltwater intrusion in the Mekong Delta was
evaluated to be the most serious in the past 100 years and was forecasted to be worse in
the following years (Luong Xuan Dinh et al., 2016). According to Tanwar (2003), the
salinity tolerance threshold of rice was 3.0 mS/cm of soil and 2.0 mS/cm for irrigation
water, the rice yield will plummet when the salinity exceeds this value. Rice is very
susceptible to salinity at the seedling, tillering and panicle initiating stage. At repening,
most of rice cultivars are less sensitive to salinity (Lauchli and Grattan, 2007).
Currently, there are some strategies that could enhance rice tolerance to salinity
such as using resistant varieties, cultivation techniques or using brassinosteroids – a
plant growth regulator, which have currently been studied and applied. Many results
showed that brassinolide (BL) (C28H48O6 - a natural lactone steroid discovered in 1979,
belonging to brassinosteroids) could increase salinity tolerance of plant by stimulating
growth (El-Feky and Abo-Hamad, 2014), accumulating proline (Vardhini, 2012;
Nguyen Van Bo et al., 2014), stabilizing chlorophyll (Nithila et al., 2013), increasing
activity of antioxidant enzymes (El-Mashad and Mohamed, 2012), ... on some upland
crops. However, there are limited studies on effects of this substance on the
biochemical and physiological characteristics, growth and productivity of rice in saline
areas of the Mekong Delta.
Based on practical needs of rice production in this region and BL application
could improve potentially rice tolerance and reduce yield loss under saline condition, the
thesis titled "Effects of brassinolide on saline tolerance of high yield rice in the
Mekong delta" was conducted.
1.2 Aims of the thesis
Determine the effects of brassinolide applications on physiological and
biochemical characteristics of high yield rice under salt-stressed condition; Find out the
effectiveness of brassinolide treatments at seedling, tilling, panicle initiating, and
flowering stage when rice grown under salt stress in the Mekong Delta.
1.3 Content of the thesis
The content of the thesis includes investigation of some biochemical and
physiological characteristics of rice treated with brassinolide and effects of brassinolide
treatments on rice at different stages of rice grown in net house and application of the
most effective brassinolide-treated level on field trials.
1.4 The new findings of the dissertation
- When growing rice under saline condition treated with brassinolide
contributed to increase proline, photosynthetic pigments, protease, catalase activity,
content of total nitrogen, phosphorous and sodium in shoots which enhanced rice
tolerance to salinity.
1
- The thesis has determined the concentrations of brassinolide treatment
when rice grown under saline condition as follows: (1) At the 3 ‰-salted condition:
Growing rice treated with brassinolide of 0,05 mg/L at the seedling or tillering stage
improved rice yield, while at stages of panicle initiating and flowering, brassinolide of
0,10 mg/L should be used. (2) At salinity of 6 ‰, application of brassinolide of 0,05
mg/L improved rice yield, in contrast brassinolide of 0,10 mg/L should be applied at
stages of tilling or panicle initiating and flowering.
- In the natural-salted field (3.2‰ and 4.82‰) in Bac Lieu province, 3 times
brassinolide application of 0,05 mg/L at the seedling stage and of 0,10 mg/L at the
tilling stage and panicle initiating improved growth and rice yield from 21% to 29%.
1.5 Meaning of the thesis
- The scientific significance of thesis: Determine the effects of brassinolide
applications on physiological - biochemical characteristics, rice growth and yield under
salt-stressed condition.
- The practice of thesis: Help farmers reduce rice yield loss in salted condition.
CHAPTER 3: RESEARCH METHOD
3.2 Research materials and facilities
- The thesis was conducted from 2015 to 2018. The experiments were carried
out in the laboratory of biochemistry, in net house at College of Agriculture, Can Tho
University and trials on the paddy rice field in Phuoc Long district and Gia Rai town,
Bac Lieu province.
- Main experimental materials: Rice varieties: OM2517 and OM5451; Brassinolide
(BL) plant growth regulator produced by the Merck company; Sodium chloride was the
substance used to create a saline environment in the laboratory and net house.
3.3 Research methods
3.3.1 The effects of brassinolide applications on some physiological and
biochemical characteristics of rice seedlings
3.3.1.1 Experiment 1: Effects of BL applications on physiological and biochemical
characteristics of rice seedlings under 3‰ salt-stressed condition
a) Design of experiment: Experiment was completely randomized design, one
factor, 5 treatments. The brassinolide concentrations of 0; 0.05; 0.10; 0.20; 0.40 mg/L
were used for the experiments at laboratory. Each treatment included 3 replications, 4
growing trays for each replication.
b) Experimental procedure
- Preparation of growing tools: Holed foam sheet (10 holes in a row and 10 rows per
sheet) was floating inside the rectangular plastic tray containing nutrient solution. Three
germinated rice seeds were planted in each hole. The underside of the foam sheet was
covered with a net to keep the rice from falling into the growing solution.
- Treatment of rice seeds and sowing: seeds of OM2517 variety was soaked in water
for 24 hours and then incubated. When the seeds just cracked, depending on the
2
treatments, spray BL solution at the concentrations described above. Continue
incubating the seeds until germination and then sowed (3 seeds per hole). For the first 3
days, distilled water was used as growing solution.
- Salinization of nutrient solutions: The Yoshida nutrient solution (Yoshida et al.,
1976) was salted by dissolving 3 g of NaCl in 1 liter of nutrient solution. The salinity of
solution was measured by machine. Each tray contained 3 liters of salted nutrient solution.
- Saline treatment: After 3 days when seedlings grew well, replaced distilled
water by 3‰-salted nutrient solution. The growing soltuions were renewed with the
interval of 4 days.
c) Data recording: Experimental data were collected at 8 days after salt treatment
as following: chlorophyll content in leaves (Wellburn, 1994), proline content (Bates et al.,
1973), catalase (Barber, 1980), protease (Kunit, 1974), total N, P, K, Ca, Mg, Na content in
plants (Ngo Ngoc Hung et al., 2004). Some growth parameters were also recorded
including plant height, root length, fresh weight and dry weight according to the method of
the Ministry of Agriculture and Rural Development (2011).
3.3.1.2 Experiment 2: Effects of BL applications on physiological and biochemical
characteristics of rice seedlings under 6‰ salt-stressed condition
The same experiment procedure was applied but replacing 3‰ saline nutrient
solution by 6‰ saline nutrient solution.
3.3.2. Effects of brassinolide applications on growth and yield of rice in net
house condition
There were several independent experiments were carried out.
3.3.2.1. Effects of applied BL applications on rice growth and yield
a) Experiment 3: Effects of BL applications on rice growth and yield under 3‰ saltstressed condition in net house
* Design of experiment: Experiment was completely randomized design, one
factor, included 5 treatment and the brassinolide concentrations of 0; 0.05; 0.10; 0.20;
0.40 mg/L were used for the experiments in net house. Each treatment included 5
replications, each replication included 1 pot.
* Experimental procedure
- Soil preparation: Coastal rice soil was taken at a depth of 0-20 cm, dried naturally
in the air. Each pot contained 5 kg of crushed soil. After being submerged for 14 days, the
pots were drained and 15 germinated rice seeds were sown into each pot. Rice cultivar
OM2517 was used in this experiment.
- Brassinolide application: germinated rice seeds were incubated with BL
solutions 1 day before sowing.
- Saline treatment: Fresh water in pots were drained before sowing. After sowing,
3‰-salted water was filled into pots. Salt water was applied once for crop season.
3
- Fertilization: The formula of 100N - 60P2O5 - 30K2O kg/ha was applied in the
experiment. The amount of fertilizers per pot was calculated equivalently to 3 million kg
of dry soil/ha. At 15 days after sowing, 5 plants per pot were left to grow until harvest.
The water level in the pot was maintained stably about 5 -7 cm from the ground.
* Data recording: Growth parameters and yield components were followed the
evaluation method of the Ministry of Agriculture and Rural Development (2011), proline
content in rice after 5 days of salt treatment (Bates et al., 1973).
b) Experiment 4: Effects of BL applications on rice growth and yield under 6‰ saltstressed condition in net house
The experiment was conducted in the same procedures of experiment 3 but the
salinity was 6‰-salted water.
3.3.2.2. Brassinolide application at tillering stage
a) Experiment 5: Effects of brassinolide treatments on rice growth and yield
under 3‰-salt-stressed condition at tillering stage in net house
* Design of experiment: Similar to experiment 3 (Section 3.3.2.1).
* Experimental procedure: The same procedures as above description. The
differences were as followed:
- Brassinolide application: BL was sprayed 1 day before salinity treated to rice
plants (at 18 days after sowing).
- Saline treatment: Saltwater (1 liter) was filled into pots once at tillering stage (at 19
days after sowing). Before being flooded with with 3‰ salt water, pots were drained to
remove remaining fresh water in each pot.
* Data recording: Similar to experiment 3 (Section 3.3.2.1).
b) Experiment 6: Effects of brassinolide treatments on rice growth and yield
under 6‰-salt-stressed condition at tillering stage in net house
Experiment 6 was carried out in the same way as experiment 5 but the salt level of
6‰ was applied.
3.3.2.3. Brassinolide application at panicle initiating stage
a) Experiment 7: Effects of brassinolide treatments on rice growth and yield
under 3‰-salt-stressed condition at panicle initiating stage in net house
* Design experiment: Similar to experiment 3 (Section 3.3.2.1).
* Experimental procedure: The same procedures as above description. The
differences were as followed:
- Brassinolide application: BL was sprayed 1 day before salinity treated to rice
plants (at 48 days after sowing).
- Saline treatment: Saltwater (1 liter) was filled into pots once at tillering stage (at 49
days after sowing). Before being flooded with with 3‰ salt water, pots were drained to
remove remaining fresh water in each pot.
* Data recording: Similar to experiment 3 (Section 3.3.2.1).
4
b) Experiment 8: Effects of brassinolide treatments on rice growth
and yield under 6‰-salt-stressed condition at panicle initiating stage in net house
Experiment 8 was carried out in the same way as experiment 7, excepting for the
salt level of 6‰.
3.3.2.4. Brassinolide application at flowering stage
a) Experiment 9: Effects of brassinolide treatments on rice growth and yield
3‰-salt-stressed condition at flowering stage in net house
* Design of experiment: Similar to experiment 3 (Section 3.3.2.1).
* Experimental procedure: The same procedures as above description. The
differences were as followed:
- Brassinolide application: BL was sprayed 1 day before salinity treated to rice
plants (at 60 days after sowing).
- Saline treatment: Saltwater (1 liter) was filled into pots once at tillering stage (at
61 days after sowing). Before being flooded with with 3‰ salt water, pots were drained to
remove remaining fresh water in each pot.
* Data recording: Similar to experiment 3 (Section 3.3.2.1).
b) Experiment 10: Effects of brassinolide treatments on rice growth and yield
under 6‰-salt-stressed condition at flowering stage in net house
Experiment 10 was carried out in the same way as experiment 9, excepting for the
salt level of 6‰.
3.3.3. Effects of brassinolide treatments on rice growth and yield under saltstressed condition on the paddy rice field
Using the BL levels had most effective to eliminate salt stress for rice at each
growth stage (from experiments in net houses - Section 3.3.2).
3.3.3.1 The experiment in Phuoc Long district, Bac Lieu province
Experiment 11: Effects of BL applications by spraying on rice growth and
yield under 4.82‰-salt-stressed in Phuoc Long district, Bac Lieu province
Experiment was laid out in randomized complete block design including 5
treatments and 3 replications (Table 3.1). The area of each replicate was 20 m2.
Table 3.1: Different treatment on the field condition
Treatment
1
2
3
4
5
Time points of BL spraying
Control untreated (spraying with water)
Treatment of rice varieties (seedling)
Seedling + tillering
Seedling + tillering + panicle initiating
Seedling + tillering + panicle initiating + flowering
Concentration of solution
Seedling: 0.05 mg/L
Tillering: 0.10 mg/L
Panicle initiating: 0.10 mg/L
Flowering: 0.10 mg/L
- The farming techniques of rice cultivation according to local farmers' practices
were as follows: Using rice variety OM2517, sowing density of 120 kg/ha. The
amounts (in kg) of fertilizers for 10.000 m2 were 91.5 N – 73.5P2O5 – 65.5 K2O.
5
- Time points of brassinolide application: Germinated rice seeds were
incubated with BL and spraying BL at tillering (18 days after sowing), at panicle
initiating (41 days after sowing), and at flowering stage (60 days after sowing).
* Data recording: Soil pH and EC were taken by portable pH and EC meter.
Growth parameters and rice yield components were followed the evaluation method of
the Ministry of Agriculture and Rural Development (2011) including plant height, the
number of tillers at 10, 30, 50 and 70 days after sowing, number of spikelets per m 2,
number of spikelets per panicle, the ratio of filled spikelets per panicle, weight of
1000-grain, theoretical yield and actual yield (tons/ha).
3.3.3.2 The experiment in Gia Rai town, Bac Lieu province
Experiment 12: Effects of BL applications by spraying on rice growth and
yield under 3.2‰-salt-stressed in Gia Rai town, Bac Lieu province.
* Design of experiment: Similar to experiment 11 (Section 3.3.3.1).
Treatments in experiment were shown in Table 3.2.
Table 3.2: Different treatment on the field condition
Treatment
1
2
3
4
5
Time points of BL spraying
Control untreated (spraying with water)
Treatment of rice varieties (seedling)
Seedling + tillering
Seedling + tillering + panicle initiating
Seedling + tillering + panicle initiating + flowering
Concentration of solution
Seedling: 0.05 mg/L
Tillering: 0.05 mg/L
Panicle initiating: 0.10 mg/L
Flowering: 0.10 mg/L
- Using rice variety OM5451, sowing density with 120 kg/ha. The amounts (in
kg) of fertilizers for 10.000 m2 were 84 N – 75P2O5 – 51 K2O.
- BL treatment: germinated rice seeds were completely wetted by BL solutions
and incubated at room temperature for 24 hours and BL solutions were sprayed on rice
field at tillering (20 days after sowing), at panicle initiating (45 days after sowing), and
at flowering stage (65 days after sowing).
* Data recording: Similar to experiment 11 (Section 3.3.3.1).
3.4 Data analysis method: Data were analyzed for variance to find differences
between treatments in each experiment. Duncan’s multiple range test at significant
level of 1% or 5% were used to compare the treatment means.
CHAPTER 4: RESULTS AND DISSCUSSION
4.1 The effects of brassinolide treatments on some physiological and
biochemical characteristics of rice seedlings
4.1.1 The proline content
At the 3 or 6‰-salted condition, the proline content of rice stems was improved
under seed incubation with BL 0.2 mg/L (Table 4.1). The same result was also found in
study of Samia et al. (2009) on maize, incubating seeds with BL 0.25 mg/L increased
proline production capacity under 50 mM or 100 mM saline (NaCl) conditions. The
high accumulation of proline in saline crisis condition adjusted osmosis, increasing
6
water absorption, limited the uptake and transport of Na+ from roots to stems,
thereby increasing tolerance in salty conditions.
Table 4.1: Effects of BL treatments on proline content in rice seedlings at 8 days after salt
stressed at 3‰ and 6‰.
Proline (µmol/g FW)
3‰-salted
6‰-salted
34.05 c
38.08 c
35.62 bc
45.96 b
36.48 b
44.69 b
40.65 a
52.02 a
35.79 b
47.84 b
**
**
2.43
3.66
Concentration of BL (mg/L)
Control
0.05
0.10
0.20
0.40
F
CV (%)
Note: In a column, the numbers followed by the same letter(s) were not significantly different at 1% level
(**) by Duncan's multiple range test.
4.1.2 The photosynthetic pigments in leaf
- Experiment at salinity of 3‰: In saline conditions at the seedling stage, incubating
seeds with BL at different concentrations increased the content of photosynthetic pigments,
was significantly higher compared to the control (Table 4.2 and Table 4.3). Particularly,
brassinolide application of 0.20 mg/L showed the highest carotenoids (59.42 µg/g FW). The
similar results were also found in studies of Bera et al. (2006) and Prakash et al. (2007), the
total amount of chlorophylls, soluble proteins were found in high amounts when treated
with BL.
Table 4.2: Effects of BL treatments on chlorophyll a and b (µg/g FW) content in plants 8 days
after saline treatment at 3‰ and 6‰.
Concentration of
BL (mg/L)
Control
0.05
0.10
0.20
0.40
F
CV (%)
Experiment
3‰-salted
Chlorophyll a
Chlorophyll b
127.29 c
43.58 b
170.77 b
56.87 a
189.30 ab
63.28 a
193.64 a
54.32 a
207.76 a
63.67 a
**
**
6.24
9.35
6‰-salted
Chlorophyll a
Chlorophyll b
48.93 b
18.47
45.60 b
18.57
58.36 ab
22.16
72.61 a
25.34
72.77 a
25.28
*
ns
15.78
17.47
Note: In a column, the numbers followed by the same letter(s) were not significantly different at 1% (**) and
5% (*) level, respectively, by Duncan's multiple range test; ns: not significant difference.
- Experiment at salinity 6‰: The results of Table 4.2 and Table 4.3 showed that in the
high salinity (6‰) experiment, the highest content of photosynthetic pigments was found under
0.10-0.40 mg/L of BL treatments and it was significant difference from control and 0.05 mg/L of
BL treatments (higher than 9.43-23.84 µg/g FW and 9.43-23.84 µg/g FW compared to those of
the control, respectively for chlorophyll a and carotenoids).
7
Table 4.3: Effects of BL treatments on total carotenoids (µg/g FW) content in plants 8 days
after saline treatment at 3‰ and 6‰.
Concentration of BL (mg/L)
Control
0.05
0.10
0.20
0.40
F
CV (%)
Experiment
3‰-salted
29.08 c
46.00 b
47.84 ab
59.42 a
52.49 ab
**
13.60
6‰-salted
13.86 b
13.82 b
20.90 a
20.80 a
20.41 a
**
11.11
Note: In a column, the numbers followed by the same letter(s) were not significantly different at 1% level
(**) by Duncan's multiple range test.
4.1.3 Catalase enzyme activity
- Experiment at salinity of 3‰: Incubating seeds with BL at different concentrations
showed that the catalase enzyme content between treatments was not significantly different
by statistical analysis (Table 4.4).
- Experiment at salinity of 6‰: Saline treatment and incubating seeds with BL at
different concentrations at the seedling stage showed that the catalase activity content
between treatments was significantly different by statistical analysis (Table 4.4). Among
them, spraying BL with a concentration of 0.10 – 0.40 mg/L gave the best catalase activity
(increased from 74.06 to 81.33%), and the lowest was found in the control treatment.
According to Gao et al. (2008), under the salted conditions, catalase enzyme was
reported as an adaptive trait related to its ability to enhance plant tolerance to salinity. The BL
promoted the hydrogen peroxide cleavage faster by the catalase-boosting effect of plant cell
peroxisomes (Halliwell, 1977) so that plants could absorb more water under stress conditions.
Table 4.4: Effects of BL treatments on catalase activity (µmol H2O2/minute.mgprotein) in plants
8 days after saline treatment at 3‰ and 6‰
Concentration
of BL (mg/L)
Control
0.05
0.10
0.20
0.40
F
CV(%)
Experiment at 3‰-salted
Enzyme
Increase compared to
activity
control (%)
0
34.56
51.15
48.00
63.35
83.30
96.15
67.79
37.83
9.46
ns
27.98
Experiment at 3‰-salted
Enzyme
Increase compared to
activity
control (%)
36.36 b
0
48.55 b
33.53
65.93 a
81.33
63.65 a
75.06
63.29 a
74.06
*
19.29
Note: In a column, the numbers followed by the same letter were not significantly different at 5% level (*) by
Duncan's multiple range test; ns: not significant difference.
4.1.4 Protease enzyme activity
- Experiment at salinity of 3‰: Experimental results showed that the
protease activity had a statistically significant difference (1%) between the
8
treatments (Table 4.5). At the 3‰-salted condition, spraying BL increased the
protease enzyme activity from 0.081-0.227 Tu/mgprotein, respectively, comparing to
that of the control. Among them, BL application of 0.05 mg/L showed no increase
of protease activity.
- Experiment at salinity of 6‰: The results of the 6‰ salinity experiment
tended to be similar to the 3‰ salinity experiment. When incubating BL treatments
showed that the protease activity was higher (0.031 – 0.062 Tu/mg protein) compared
to the control (Table 4.5). Among them, BL application of 0.05 – 0.20 mg/L
resulted in higher protease activity.
Table 4.5: Effects of BL treatments on protease activity (Tu/mgprotein) in plants 8 days after
saline treatment at 3‰ and 6‰.
Concentration of BL
(mg/L)
Control
0.05
0.10
0.20
0.40
F
CV(%)
Experiment
3‰-salted
0.072 b
0.153 b
0.274 a
0.299 a
0.253 a
**
21.30
6‰-salted
0.058 b
0.115 a
0.103 a
0.120 a
0.089 b
*
4.61
Note: In a column, the numbers followed by the same letter were not significantly different at 1% (**) and
5% (*) level, respectively, by Duncan's multiple range test.
4.1.5 Mineral composition in plants
- Experiment at salinity of 3‰: The results of Table 4.6, Table 4.7 and
Table 4.8 showed that at the 3 ‰-salted condition, all analysed elements in plants
were not different among BL treatments.
- Experiment at salinity 6 ‰: When growing rice in 6 ‰-salted condition,
the accumulating mineral content (N, P) in the plants increased significant
difference between the treatments (Table 4.6). Among them, N increased from 5.02
to 10.97% and the best N ts content (3.54% N) was found under 0.10 mg/L of BL
concentration. The incubation of seeds with BL of 0.05 – 0.20 mg/L increased P
content from 32.43 to 45.95% compared to the control.The Na mineral content in
plant (Table 4.8) had a significant decrease and there were statistically significant
differences (1%) between treatments found. When seeds were incubated with BL,
Na content decreased from 9.57 to 15.43% compared to the control. At the same
time, after 8 days of salt treatment, the content of K, Ca and Mg in plant were not
significant difference between treatments (Table 4.7).
9
Table 4.6: Effects of BL treatments on Nts (%N) and Pts (%P2O5) in plants 8 days after
saline treatment at 3‰ and 6‰.
Experiment
Concentration of BL
(mg/L)
Control
0.05
0.10
0.20
0.40
F
CV (%)
3‰-salted
Nts
3.78
3.93
4.07
4.01
3.92
ns
2.78
6‰-salted
Pts
2.19
2.30
2.35
2.36
2.32
ns
4.75
Nts
3.19 b
3.36 ab
3.54 a
3.38 ab
3.35 ab
*
3.26
Pts
1.48 b
2.06 a
2.16 a
1.96 a
1.41 b
**
10.46
Note: In a column, the numbers followed by the same letter(s) were not significantly different at 1% (**) and
5% (*) level, respectively, by Duncan's multiple range test; ns: not significant difference.
Table 4.7: Effects of BL treatments on K (%K2O) and Ca (%Ca) in plants 8 days after saline
treatment at 3‰ and 6‰.
Experiment
Concentration of BL
(mg/L)
Control
0.05
0.10
0.20
0.40
F
CV (%)
3‰-salted
Kts
2.84
3.23
3.44
3.26
2.75
ns
8.76
6‰-salted
Cats
0.20
0.24
0.23
0.25
0.22
ns
0.00
Kts
Cats
2.24
2.72
2.93
2.95
2.64
ns
11.06
0.25
0.27
0.27
0.26
0.26
ns
0.78
Note: ns: not significant difference.
Table 4.8: Effects of BL treatments on Na (%Na) and Mg (%Mg) in plants 8 days after saline
treatment at 3‰ and 6‰.
Concentration of BL
(mg/L)
Control
0.05
0.10
0.20
0.40
F
CV (%)
Experiment
3‰-salted
Nats
1.55
1.58
1.53
1.42
1.55
ns
8.03
Mgts
0.22
0.23
0.23
0.23
0.22
ns
0.00
6‰-salted
Nats
1.88 a
1.66 b
1.59 b
1.63 b
1.70 b
**
3.74
Mgts
0.27
0.27
0.28
0.27
0.26
ns
1.26
Note: In a column, the numbers followed by the same letter were not significantly different at 1% level (**)
by Duncan's multiple range test; ns: not significant difference.
10
4.2 Effects of brassinolide treatments on rice growth and yield
under 3‰ salt-stressed in net house condition
4.2.1 Plant height at harvest
- Experiments at seedling stage: measured height of the plants under salt stress
showed no difference between BL applications at seedling stage (Table 4.14). Other
results that supported what has been shown here, were those by Anuradha (2002),
application of BL in salinity condition could minimize negative effects on rice
germination and growth at seedling stage.
Table 4.14: Effects of BL treatments at 4 different rice growth stages on plant height (cm) at
harvest.
Concentration
of BL (mg/L)
Experiment at
seedling stage
Experiment at
tillering stage
Experiment at panicle
initiating stage
Experiment at
flowering stage
Control
0.05
0.10
0.20
0.40
F
CV(%)
81.95
84.23
85.72
84.61
81.66
ns
4.02
76.53 b
81.84 a
81.40 a
80.80 a
79.49 ab
*
3.46
78.52 c
84.81 a
83.25 ab
80.10 bc
79.80 bc
*
3.7
78.77 b
82.51 a
81.62 a
81.82 a
80.68 ab
*
2.12
Note: In a column, the numbers followed by the same letter(s) were not significantly different at 5% level (*)
by Duncan's multiple range test; ns: not significant difference.
- Experiments at tillering and flowering stage: Results presented in Table 4.14
shown a positive effect of BL in tillering stage. The application of BL concentrations
of 0.05; 0.10; 0.20 mg/L contributed to enhance the plant height (Table 4.14).
- Experiment at panicle initiating stage: It was obvious that there was a positive
effect on the height of rice by BL application. BL Spraying on rice plants at the
concentration of 0.05 mg/L under salted-growing condition showed the highest result
(increased plant height by 8,01% when compared to that of the control).
4.2.4 The numbers of panicle per pot
- Experiments at seedling stage: The results of panicle/pots was significantly
different at 1% level. Usage of different BL concentrations increased the number of
panicles/pot from 4.17 to 8.33% (Table 4.20).
- Experiment at tillering stage: Spraying BL on rice plants under salt stress at
tillering stage showed that the number of panicles/pot between treatments were
statistically significant differences at 1% level (Table 4.20). One of the studies that
supported these results also, was a study by Nguyen Minh Chon et al. (2010), applying
BL could increase cell division through inducing chlorophyll accumulation and the
transport of photosynthetic products would be stimulating for the treated plants in
tillering stage.
11
Table 4.20: Effects of BL treatments at 4 different rice growth stages on number of
panicle/pot at harvest.
Concentration
of BL (mg/L)
Experiment at
seedling stage
Experiment at
tillering stage
Experiment at panicle
initiating stage
Experiment at
flowering stage
Control
0.05
0.10
0.20
0.40
F
CV(%)
19.20 c
20.80 a
20.2 ab
20.2 ab
20.0 b
**
2.66
17.00 c
20.00 a
19.80 a
19.00 ab
17.60 bc
**
7.05
20.00 c
21.60 ab
22.40 a
21.20 b
19.20 c
**
3.66
25.60
26.00
27.60
27.80
25.60
ns
6.83
Note: In a column, the numbers followed by the same letter(s) were not significantly different at 1% level
(**) by Duncan's multiple range test; ns: not significant difference.
- Experiment at panicle initiating stage: The number of panicles/pot varied and the
difference was statistically significant at 1% level between treatments. In particular, using
BL 0.10 mg/L was mostly effective in increasing the number of panicles/pots (22.40
panicles/pot), 12% higher when compared to the control. When rice plants at panicle initiating
being stressed by salt, their production would be affected, especially the degradation of flower
buds and reduction number of branches on panicles (Counce et al., 2000).
- Experiments at flowering stage: At the flowering stage, the number of effective
shoots were not much variation, so spraying BL at this stage did not affect to the
number of panicles/pot (Table 4.20).
4.2.6 The number of filled spikelets per panicle
- Experiment at seedling stage: Under salinity condition, incubating rice with
BL showed no change in the number of filled spikelets. In this period, rice plants had
the ability to recover after salinity was lower, so the BL treatments did not affect to the
number of filled grains/panicle at harvest (Table 4.22).
Table 4.22: Effects of BL treatments at 4 different rice growth stages on the number of filled
spikelet/panicle at harvest
Concentration
of BL (mg/L)
Experiment at
seedling stage
Experiment at
tillering stage
Control
0.05
0.10
0.20
0.40
F
CV(%)
45.24
44.45
46.30
46.18
45.51
ns
2.15
39.92 b
44.48 a
44.14 a
44.20 a
42.40 ab
*
4.90
Experiment at
panicle initiating
stage
25.68 c
32.07 ab
34.16 a
33.73 ab
31.81 b
**
5.04
Experiment at
flowering stage
28.22 c
34.38 b
37.76 ab
38.18 a
37.40 ab
**
7.27
Note: In a column, the numbers followed by the same letter(s) were not significantly different at 1% level
(**) and 5% (*) level, respectively, by Duncan's multiple range test; ns: not significant difference.
12
- Experiment at tillering stage: The number of filled spikelets/panicle in the
BL treatments by spraying at different concentrations increased the number of filled
spikelets/panicle (ranging from 6.21 to 11.42%) and significant difference at 5% level
by statistical analysis (Table 4.22). More precisely, spraying BL at the concentration of
0.05 mg/L showed the highest number of filled spikelets/panicle (44,48 filled
spikelets/panicle).
- Experiment at panicle initiating stage: The number of filled spikelets/panicle
in the BL-applying treatments at different concentrations increased the number of filled
spikelets/panicle, it was significant increase from 23.87 to 33.02% compared to those of
the control plants (Table 4.22).
- Experiment at flowering stage: The result presented in Table 4.22 showed that
BL spraying enhanced the number of filled spikelets/panicle from 23.60 to 35.29%, it
was significant difference when BL used at the concentration of 0.20 mg/L, which
improved the number of seeds on the panicles most effectively.
Regardless to salt stress at different growing stages such as tillering, panicle
initiating or flowering, rice plants treated with BL at appropriate concentrations led to
improve the number of filled spikelets/panicle. These results were in agreement with the
report of Fujii and Saka (2002), brassinosteroids play a vital role in increasing of starch
accumulation in seeds, contributing to increase the percentage of filled grains on the crop,
through increasing the size of the mature leaves and inducing the transport of
carbohydrates to the seed.
4.2.7 The weight of 1000 grains
The weight of 1000 grains in the experiments did not show any significant
differences (Table 4.23). According to Yoshida (1981), the weight of 1000 grains was
mainly determined by the genetic characteristics of varieties and the grain size was strictly
controlled by the husk.
Table 4.23: Effects of BL treatments at 4 different rice growth stages on the weight of 1000
grains at harvest
Concentration Experiment at
of BL (mg/L) seedling stage
Control
0.05
0.10
0.20
0.40
F
CV(%)
Experiment at
tillering stage
Experiment at panicle
initiating stage
Experiment at
flowering stage
26.38
26.13
26.59
26.56
26.23
ns
1.98
26.09
26.02
26.02
26.10
26.14
ns
2.12
26.53
25.86
26.62
26.63
26.56
ns
3.03
26.01
26.66
26.61
26.75
26.10
ns
2.10
Note: ns: not significant difference.
4.2.8 The rice yield per pot
The effects of BL treatments on rice plants at different development stages
peresented in Table 4.24 showed that:
13
- At seedling stage: The rice yield/pot in BL treatments were higher than
those of the control (increasing from 5.23 to 10.50%) and were statistically significant
differences at 1% level.
- At tillering stage: The weight of grain/pot had statistical significance (1%)
between treatments. Treating BL (concentration of 0.05; 0.10; 0.20 mg/L) increased the
weight of grain/pot from 29.58 to 30.02% compared with control plants.
Table 4.24: Effects of BL treatments at 4 different rice growth stages on rice yield (g/pot)
Concentration Experiment at
of BL (mg/L) seedling stage
Control
0.05
0.10
0.20
0.40
F
CV(%)
22.58 b
24.65 a
24.89 a
24.95 a
23.76 ab
**
3.76
Experiment at
tillering stage
Experiment at panicle
initiating stage
Experiment at
flowering stage
17.92 b
23.22 a
23.24 a
23.30 a
19.61 b
**
9.09
13.40 d
18.00 b
19.90 a
18.64 b
15.94 c
**
4.30
19.16 d
23.10 c
27.71 a
28.26 a
25.24 b
**
6.36
Note: In a column, the numbers followed by the same letter(s) were not significantly different at 1% level
(**) by Duncan's multiple range test.
- At panicle initiating and flowering stage: The rice yield/pot when spraying BL
in all treatments were higher than those in the control. At the panicle initiating stage,
the yield were increased from 18.96 to 48.51%; at the flowering stage, the yield
increase ranged from 20.56 to 47.49%. Application of BL concentration at 0.10 mg/L
had the most effective improvement the rice yield/pot at both developmental stages of
panicle initiating and flowering.
Generally, BL application contributed to improve rice yield under salt stress.
Treating BL at appropriate concentrations could help to improve weight of grain/pot at
different growth stages of rice under stress conditions (Das and Shukla, 2011), but not all
the dosages of BL could be effective for rice plant to withstand salinity. Whenever the high
concentration of BL was used, they could be more sensitive for rice plants to grow and yield
under salt stress conditions.
4.2.9 Proline accumulation in rice plant
After 5 days of BL treatmenta, the proline contents were significant differences
(Table 4.25):
- Experiment at seeding, tillering and panicle initiating stage: Applying BL at a
concentration of 0.10 mg/L showed the highest proline content (seedling stage
increased to 58.92%; tillering period increased to 26.43% and the panicle initiating
period increased by 50.81% compared to the control).
- Experiment at flowering stage: Proline content in plants increased from 48.97
to 64.98% in BL treatments (concentration of 0.10, 0.20, and 0.40 mg/L) compared to
those of the control. In which, spraying BL concentration of 0,20 mg/L led to induce
the highest proline content in the shoots (12.06 µmol/g).
14
Other studies supporting these results including those of Phap (2006),
brassinosteroids in salty environment enhanced proline accumulation in leaf cells as an
adaptive trait of rice related to stress tolerance.
Table 4.25: Effects of BL treatments at 4 different rice growth stages on proline accumulation
(µmol/g) in plant
Concentration
of BL (mg/L)
Control
0.05
0.10
0.20
0.40
F
CV(%)
Experiment at
seedling stage
Experiment at
tillering stage
Experiment at panicle
initiating stage
Experiment at
flowering stage
6.11 c
8.73 b
9.71 a
9.46 a
6.03 c
**
5.03
8.59 c
10.01 b
10.86 a
9.76 b
8.81 c
**
4.29
6.20 c
8.03 b
9.35 a
9.54 a
7.47 b
**
7.15
7.31 c
7.05 c
10.96 b
12.06 a
10.89 b
**
7.83
Note: In a column, the numbers followed by the same letter were not significantly different at 1% level (**)
by Duncan's multiple range test.
4.3 Effects of brassinolide treatments on rice growth and yield under 6‰
salt-stressed condition in net house
4.3.1 Plant height at harvest
- Experiment at seedling stage: Similarly to 3‰-salinity, when BL applications
for rice grown under 6‰ salt-stressed condition at the seedling stage did not affect on the
height at the harvest (Table 4. 26).
Table 4.26. Effects of BL treatments at 4 different rice growth stages on plant height (cm) at
harvest
Concentration Experiment at
of BL (mg/L) seedling stage
0
0.05
0.10
0.20
0.40
F
CV (%)
77.88
79.57
79.08
82.66
78.51
ns
4.36
Experiment at
tillering stage
Experiment at panicle
initiating stage
Experiment at
flowering stage
76.53 b
81.84 a
81.40 a
80.80 a
79.49 ab
*
3.46
71.28
75.33
75.39
78.25
74.14
ns
4.47
78.87
79.90
81.46
80.62
78.96
ns
3.82
Note: In a column, the numbers followed by the same letter were not significantly different at 5% level (*) by
Duncan's multiple range test; ns: not significant difference.
- Experiment at tillering stage: Treatment of BL at this growing stage showed that
plant height between different treatments had statistically significant differences at 5%
level at harvest. Spraying rice with BL concentration of 0.05; 0.10; 0.20 mg/L at tillering
stage improved the height of the plants under saline condition. If BL was used at higher
concentration (0.4 mg/L), the height of rice plant at harvest was inhibited (Table 4.26).
15
- Experiments at panicle initiating and flowering stage: The plant height in BL
sprayed treatments tended to be higher than the control, but statistically significant
difference was not found (Table 4.26). According to Nguyen Van Bo et al. (2016), when
rice affected by salinity at 45-60 days after transplanting, the difference in height at
harvest would be insignificant.
4.3.4 The number of panicles per pot
- Experiments at seeding and flowering stage: under saline condition rice treated
with BL at these two stages showed an increase in the number of panicles/pot from 1.0 to
1.2 panicles/pot and from 1.0 to 1.6 panicles/pot, respectively in comparison to the
control, but the differences were not statistically significant (Table 4.32). When saline
water was applied to rice at later stages (from panicle initiating stage and onward) there
would be little or no effect on number of panicles. However, salt-stressed occurrence at
the panicle initiating stage, rice would delay flowering time (Choi et al., 2003) and
prolong the growth time of about 5 - 10 days (Phap, 2006).
- Experiment at tillering stage: Saline treatment and BL spraying when rice entered
the tillering stage showed that the number of panicles/pot had a statistically significant
change at 1% level between treatments. Spraying BL for rice at the concentration of 0.05;
0.10; 0.20 mg/L gave the best number of panicles/pot (Table 4. 32).
- Experiment at panicle initiating stage: The number of panicle/pot had a
statistically significant difference at 1% level between treatments (Table 4.32). The
number of panicles was lower at high salinity caused by accumulating less anabolism in
the reproductive system (Hasamuzzaman et al., 2009). Although, BL had a role in
increasing the number of effective tillers (Abe, 1989), there was no increase or difference
between treatments when BL applications at 50 or 55 days after sowing.
Table 4.32. Effects of BL treatments at 4 different rice growth stages on number of panicle/pot
at harvest
Concentration Experiment at
of BL (mg/L) seedling stage
0
0.05
0.10
0.20
0.40
F
CV (%)
17.80
18.80
19.20
19.00
18.80
ns
7.85
Experiment at
tillering stage
Experiment at panicle
initiating stage
Experiment at
flowering stage
15.60 b
17.40 a
17.20 a
17.20 a
16.00 b
**
4.96
18.20 c
21.20 b
21.80 ab
22.80 a
21.20 b
**
4.29
26.40
27.40
27.20
28.00
27.00
ns
3.34
Note: In a column, the numbers followed by the same letter(s) were not significantly different at 1% level
(**) by Duncan's multiple range test; ns: not significant difference.
4.3.5 The number of filled spikelets per panicle
- Experiment at seeding stage: germinated rice seeds incubated with BL and sown
under saline condition resulted in no change the number of filled spikelets/panicle at
harvest (Table 4.33). Due to the short-term saline effect at this growing time, the rice
16
plants had ability to recover, therefore BL spraying with did not affect the number of
filled spikelets/panicle.
Table 4.33. Effects of BL treatments at 4 different rice growth stages on the number of filled
spikelet/panicle at harvest
Concentration
of BL (mg/L)
Experiment at
seedling stage
Experiment at
tillering stage
Experiment at panicle
initiating stage
Experiment at
flowering stage
0
0,05
0,10
0,20
0,40
F
CV (%)
37.80
39.09
39.36
40.55
39.01
ns
3.25
36.36 c
38.53 abc
40.34 ab
41.52 a
37.76 bc
*
6.64
21.74 c
23.35 b
28.39 a
25.48 b
23.72 bc
**
7.46
20.01 d
24.83 c
28.54 a
26.80 b
26.81 b
**
4.11
Note: In a column, the numbers followed by the same letter(s) were not significantly different at 1% level
(**) and 5% (*) level, respectively, by Duncan's multiple range test; ns: not significant difference.
- Experiment at tillering stage: The number of filled spikelets per panicle in the
sprayed BL treatments increased number of filled spikelets per panicle (3.85–14.19%)
when comparing to the control and the difference was statistically significant at 5%
level (Table 4.33). Among them, spraying rice with BL concentration of 0.20 mg/L
gave the highest number of filled spikelets per panicle (41.52 number of filled
spikelets/panicle).
- Experiments at panicle initiating and flowering stage: rice plants under high
salinity conditions (6‰) in combination with BL applications, both experiments resulted
in significant increases of the number of filled spikelets per panicle in contrast to those of
the controls (Table 4.33). When rice salt-stressed at panicle initiating and at flowering
stage treated with brassinolide of 0.10 mg/L showed the most effective on number of
filled spikelets per panicle. According to Arteca (1995), rice treated with BL contributed
to increase number of filled spikelets per panicle. This improvement could cause by the
better leaf size which promoted the transport of carbohydrates to the seeds
4.3.6 The weight of 1000 grains
- Experiments at seedling, tillering and panicle initiating stage: The weight of 1000
grains was not statistically different between the treatments in all three experiments (Table 4.34).
- Experiment at flowering stage: Saline treatment and spraying brassinolide at
flowering stage showed statistically significant difference in the weight of 1000-grain at
1% level between treatments (Table 4.34). Among them, BL applications at 0.10 and 0.
20 mg/L gave the best weights of 1000-grain, the lowest value was found in the control
treatment (25.51g). According to Anuradha and Rao (2003), BL had the effect on
increasing the cell division rate in the chloroplasts of leaves, increasing the ability to
accumulate chlorophyll, maintaining the leaf green index, which was one of the
significances for a better photosynthetic ability of rice after flowering, thereby improving
weight of grain under saline condition.
17
Table 4.34. Effects of BL treatments at 4 different rice growth stages on the weight of
1000 grains at harvest
Concentration Experiment at
of BL (mg/L) seedling stage
0
0.05
0.10
0.20
0.40
F
CV (%)
26.15
26.55
26.40
26.22
26.05
ns
1.82
Experiment at
tillering stage
Experiment at panicle
initiating stage
Experiment at
flowering stage
25.27
25.83
26.00
26.64
25.99
ns
2.85
25.72
25.71
26.19
26.38
25.96
ns
1.69
25.51 b
25.52 b
26.88 a
26.85 a
26.62 ab
*
3.28
Note: In a column, the numbers followed by the same letter(s) were not significantly different at 5% (*) level,
by Duncan's multiple range test; ns: not significant difference.
4.3.7 The rice yield
- Experiment at seedling stage: There was no statistically significant difference found in
rice yield between treatments when rice grown under 6‰-salted condition and BL application at
this stage (Table 4.35). The early stressed occurrence and good farming practices would help rice
to recover completely at later stages of growth and development.
- Experiment at tillering stage: The rice yield per pot was statistically significant
difference at 1% level between treatments (Table 4.35). Among them, BL application at 0.10 and
0.20 mg/L showed the most improvement on rice yield.
- Experiment at panicle initiating stage: When growing rice in salted condition and
treated plants with BL of 0.10 or 0.20 mg/L at the panicle initiating stage improved effectively on
rice yield per pot (Table 4.35).
- Experiment at flowering stage: Treatments in which BL applied, rice yield per
pot was higher than the untreated control (increased from 28.88 to 54.79%) (Table 4.35).
Among them, BL application of 0.10 mg/L resulted in the best rice yield (20.85 g/pot).
Table 4.35. Effects of BL treatments at 4 different rice growth stages on rice yield (g/pot)
Concentration Experiment at
of BL (mg/L) seedling stage
0
0.05
0.10
0.20
0.40
F
CV (%)
17.58
19.50
19.94
20.19
19.10
ns
7.75
Experiment at
tillering stage
14.34 c
17.38 ab
18.03 a
19.04 a
15.72 bc
**
9.66
Experiment at panicle
initiating stage
10.19 c
13.80 b
16.20 a
15.29 a
13.04 b
**
7.30
Experiment at
flowering stage
13.47 d
17.36 c
20.85 a
20.14 ab
19.25 b
**
4.76
Note: In a column, the numbers followed by the same letter(s) were not significantly different at 1% level
(**) by Duncan's multiple range test; ns: not significant difference.
18
4.3.8 Proline accumulation
Experimental results (Table 4.36) showed that proline contents between treatments had
significant differences.
- Experiment at seedling stage: BL application at 0.05 – 0.20 mg/L increased
effectively on proline content (improvement from 44.41 to 59.21% when comparing to
those of the controls).
- Experiment at tillering stage: Similar to other experiments, BL application at 0.05
mg/L to rice at seedling stage showed the highest proline content (15.58 µmol/g fresh weight).
- Experiment at panicle initiating stage: Proline accumulation in rice plants
increased significantly at 1% level between treatments. Among them, the treatments
sprayed with BL at 0.10 – 0.20 mg/L showed the highest proline content (increased 77.67 –
92.40%, respectively in contrast to those of the controls).
Table 4.36. Effects of BL treatments at 4 different rice growth stages on proline accumulation
(µmol/g) in plant
Concentration Experiment at
of BL (mg/L) seedling stage
0
0.05
0.10
0.20
0.40
F
CV (%)
16.01 b
23.59 a
23.12 a
25.49 a
14.58 b
**
9.68
Experiment at
tillering stage
Experiment at panicle
initiating stage
Experiment at
flowering stage
11.40 c
15.58 a
15.20 ab
15.31 ab
13.50 b
**
9.76
8.42 c
10.57 bc
14.96 a
16.20 a
11.48 b
**
14.25
9.29 c
10.00 bc
12.96 a
12.21 ab
11.95 ab
*
14.08
Note: In a column, the numbers followed by the same letter(s) were not significantly different at 1% (**) and
5% (*) level, respectively, by Duncan's multiple range test.
- Experiment at flowering stage: BL application at 0.10 mg/L showed the highest
proline content (12.96 µmol/g fresh weight). Experimental results showed that
appropriate BL applications might play a role in increasing proline accumulation to help
rice tolerate better to salinity. According to Phap (2006), brassinosteroids enhanced the
proline accumulation in leaf cells as an adaptive trait for rice in relation to stress
tolerance under saline condition.
4.4. Effects of brassinolide treatments on rice growth and yield under saltstressed condition on the paddy rice field in Phuoc Long district, Bac Lieu province
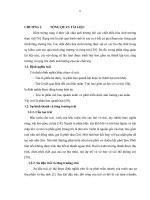
4.4.1 pH and EC changes in soil solution
The soil pH values in the experiment at Figure 4.1 showed that pH values were
relatively stable and ranged from 4.6 to 5.6. According to Ngo Ngoc Hung et al.
(2004), pH value ranging from 6.0 – 7.5 considered as the best pH range for the growth
and development of rice plants.
19
Soil EC values at the experimental time reached the highest point (7.5
mS/cm) from the beginning of cultivating season and decreased gradually to
harvest time (Figure 4.1).
Figure 4.1: pH and EC changing in the soil during rice cropping season.
4.4.3.1 The number of panicle/m2
The results in Table 4.39 showed that the number of panicle/m2 fluctuated from 412
– 473 panicles/m2 in treatments and had a statistically significant difference at 5% level.
Table 4.39 Effects of BL application on panicles/m2 and filled spikelets/panicle in the field
experiment in Phuoc Long district, Bac Lieu province
Concentration
The increase
The increase
Weight of
Number of
Number of
of BL
compared to
compared to
1000 grains
2
panicles/m
spikelet/panicle
(mg/L)
control (%)
control (%)
(g)
1
412 b
0
58.43 c
0
26.27
2
416 b
0.97
61.27 bc
4.60
25.07
3
432 ab
4.85
63.77 abc
9.14
25.67
4
463 a
12.38
69.93 a
19.68
26.25
5
473 a
14.81
67.67 ab
15.81
26.09
F
*
*
ns
CV (%)
5.01
6.25
3.15
Note: In a column, the numbers followed by the same letter(s) were not significantly different at 5% (*) level,
by Duncan's multiple range test; ns: not significant difference.
Treatments in which BL sprayed at seedling and at flowering stage had the
highest number of panicles (473 panicles/m 2, increased 14.81% in comparison to that
of the control treatment), no significant difference with treatments in which BL sprayed
two times at seedling and at panicle initiation stage (463 panicles/m2, increasing
12.38% compared to the control treatment). The number of panciles in the control
treatment without spraying BL was lowest in this research (412 panicles/m2).
According to Grattan et al. (2002) had revealed that salinity had significant effects on
panicles generated. The stress of rice plant in saline condition lead to slower
20
development in the height of rice plant and dramatically decrease the number of
effective tillers.
4.4.3.2 The number of filled spikelets per panicle
The results (Table 4.39) showed that the number of filled spikelets/panicle
fluctuated from 58.43 to 69.93 filled spikelets/panicle and had a significant difference
at 5% by statistical analysis among treatments. The number of filled spikelets/panicle
was lowest in control treatment (58.43 filled spikelets/panicle). According to Abdulah
et al. (2001), the accumulation of high concentration Na + on rice flowers led to the
decrease of pollen vitality and incompleted of seed formation; Treatments in which BL
spraying at seedling and at tillering stages produced the highest number of filled
spikelets/panicle (69.93 filled spikelets/panicle, increased 19.68% and 14.13%
compared to control and seedling stage treatment, respectively). According to
Hasamuzzaaman et al. (2009), the number of filled spikelets/panicle decreased
significantly when salinity increased. The number of filled spikelets/panicle decreased
at a salinity of 3.4 mS/cm (equivalent to 2.18‰) or higher (Zeng and Shannon, 2000).
4.4.3.3 The ratio of filled spikelet per panicle
Data in Table 4.41 showed that the ratio of filled spikelet/panicle varied from
60.97 to 70.50% and was statistically significant difference at 1% level between
treatments. While the lowest ratio of filled spikelet was observed in the control
treatment (non-treated BL), the highest percentage was obtained in treatment with BL
applied at germination and at flowering stage. Yoshida (1981) stated that the ratio of
filled spikelet was determined by the capacity of carbohydrate reception and the
transportation of other compounds from leaves to seeds. Mohammadi et al. (2010)
reported that unfilled spikelet ratio was greatly affected by the environment and saline
condition. Effect of BL as growth regulator supported plants to increase leaf size and
maintain leaf colour to maximize light efficiency, leading to an increase of filled
spikelet ratio.
4.4.3.4. The weight of 1000-grain
The weight of 1000-grain among treatments varied from 25.07 – 26.27 gram and
were insignificant difference by statistical analysis (Table 4.40). The decrease in
weight of 1000 grains because of the limitation of photosynthetic capacity led to less
accumulation of carbohydrate and other components (Hasamuzzaman et al., 2009).
Khatun and Flowers (1995) reported that the decrease of 1000-grain weight coincides
with the increase of salinity level.
4.3.3.6 Rice yield
Actual rice yield fluctuated from 3.59 to 5.5 tons/ha (Table 4.41) and statistically
significant differences at 5% level were found between treatments. Maintaining the growth
ability of rice plants by spraying BL at seedling and at flowering stage had the highest
actual yield (5.5 tons/ha, increasing 53.20% compared to the control treatment. Similarly,
twice of BL spraying at seedling and at panicle initiation period led to relatively good result
(5.34 ton/ha, increasing 48.75% compared to that of the control). The control treatment
was lowest in actual yield, only 3.59 tons/ha, and was insignificant difference from the
treatment in which BL applied once at the seedling stage. According to Singh (2006),
21
when rice plants cultivated continuously in saline conditions, salinity affected the
formation of panicle, pollen germination, and flower fertilization, consequently,
leading to increase the number of unfertilized panicles. The effects of BL showed that
this hormone, which stimulates the increase of leaf area and leaf age, increased the
ability of photosynthesis and assimilation of nutrients to transport starch into seed.
Especially, when BL sprayed at the flowering stage enhanced rice growth and vitality
of pollens, increasing the number of branch on rice panicle (Nguyen Minh Chon,
2005), and the increase of formation of filled spikelets.
Table 4.41 Effects of BL application on filled spikelet ratio (%) and rice yield (ton/ha) in the
field experiment in Phuoc Long district, Bac Lieu province
Concentration
Filled spikelet
of BL
ratio (%)
(mg/L)
1
60.97 c
2
63.95 bc
3
66.55 ab
4
67.52 ab
5
70.50 a
F
**
CV (%)
3.18
The increase
compared with
control (%)
0
4.89
9.15
10.74
15.63
Actual yield
(ton/ha)
3.59 c
3.77 bc
4.35 b
5.34 a
5.50 a
**
8.41
The increase
compared with
control (%)
0
5.01
21.17
48.75
53.20
Note: Means in the same column followed by the same letter are not significantly different by Duncan test,
ns: non-significant difference, (**): significant difference at the 1% level.
4.5 Effects of brassinolide treatments on rice growth and yield under saltstressed condition on the paddy rice field in Gia Rai town, Bac Lieu province
4.5.1.1 pH and EC changes in soil solution
Table 4.42 showed that EC value in experimental soil fluctuated from 2.65 mS/cm
to 5.02 mS/cm. The highest value of EC was recorded from the beginning day and 20
days after sowing, indicating its effect on rice plant growth and development, while at
harvesting time EC value on the field was the lowest. EC values tended to reduce
gradually because of increasing precipitation to dilute the salinity of experimental soil.
Table 4.42 Soil pH and EC value at the different stages of rice growth
Time point
Data recording
pH
EC (mS/cm)
Before
sowing
5.24
5.02
20 DAS
40 DAS
60 DAS
The harvest
5.40
5.48
5.70
5.84
4.58
3.15
2.97
2.65
pH values in soil solution was between 5.24 and 5.84 with the highest value at
harvest time (Table 4.42). This range of pH was normal for rice growth and
development (Ngo Ngoc Hung et al., 2004).
22