Using Third-Party Tools and Having Fun with RS.
Bạn đang xem bản rút gọn của tài liệu. Xem và tải ngay bản đầy đủ của tài liệu tại đây (707.81 KB, 22 trang )
Using Third-Party Tools and
Having Fun with RS
I
n past chapters, we used the capabilities provided by RS to create a variety of reports, and
you’ve seen how we can take advantage of different clients to deliver reports. So are we fin-
ished with RS now? Well, there is always room for improvements and new ideas keep popping
up for making use of this wonderful tool.
I decided to add this chapter to cover what else can be done with RS. Before this chapter,
we used different features of client-side RS to develop reports, and in the majority of cases, we
managed to do the job without any major concerns or issues. Now, if I ask you to develop a
report to print a barcode as part of the report output, what then? We don’t have any report
item called barcode that comes with RS. So, what can be done here? Well, not to worry, third-
party tools will come to the rescue.
How about making use of RS for fun? Well, why not? If you recall, in the introduction of
this book, I promised to create a personal information dashboard using RS. Well, the time is
right for me to fulfill that promise and show you how you can get to your own personal infor-
mation dashboard.
This chapter will cover
• Integrating third-party tools with RS
• Reporting for fun—a personal dashboard
Integrating Third-Party Tools with RS
Simply out, third-party tools extend your existing tool set. For example, if you want more
sophisticated graphs and charting capabilities, you can buy these from Dundas Software
(
/>I’m confident that I don’t need to give you an introduction to barcodes. After all, we deal
with barcodes all the time. Used in tasks from buying groceries to filing important paperwork,
bar
codes are commonly used unique identifiers of products or services. Therefore, I thought it
would be useful to demonstrate the integration of third-party tools by developing a report that
has barcodes in it.
385
CHAPTER 13
8547ch13final.qxd 8/30/07 3:38 PM Page 385
Barcode Professional from Neodynamic
After I decided to make use of a barcode report, I started the search for a third party that pro-
vides the barcode component. My search ended with Neodynamic. The folks at Neodynamic
a
re generous enough to allow me to showcase their Barcode Professional component for this
chapter. You can find more information about them here:
.
To demonstrate the use of this component, we’ll create a Barcode Product List report.
This report will show the barcode representation of a
ProductID, together with the name and
the product description.
Where do I get this barcode control? How do you use it? Well, before we start developing
the report using this control, I’ll show you how to get this tool up and running.
I’m using the trial download of this tool, which stands at version 4.0. It is quite possible
that by the time the book reaches you, Neodynamic might release an update to this version.
Nevertheless, our example should work with current and future versions. If you are not using
version 4.0, I’d advise you to consult the Neodynamic web site for the most current informa-
tion. You can download of the trial version here (you have to send a request to Neodynamic):
/>After you get the trial copy, installation is very simple. It is similar to a typical Windows
production installation with a wizard-based interface. Please complete the installation
according to the instructions provided by the wizard.
The next important step is to register the Neodynamic Barcode assembly to the GAC. In
case you’ve never heard of the GAC before, it’s the global assembly cache—a machinewide
storage location used to hold assemblies that are intended to be shared by several applica-
tions on the machine. You can learn more about the GAC here:
/>Why do we have to register the assembly related to this tool into the GAC? Well, since
we will make reference to its functionality from within the report, the report will look for it
in the GAC.
So, how do we register this assembly into the GAC? It is simple; you need to start by click-
ing Start
➤
All Programs
➤
Microsoft Visual Studio 2005
➤
Visual Studio Tools
➤
Visual Studio
2005 Command Prompt. At the prompt, please type a command like the following one:
C:\Program Files\Microsoft Visual Studio 8\VC>gacutil
➥
/i "C:\Program Files\Neody namic\Barcode Professional for Reporting Services\
➥
v4.0\Bin\For SSRS 2005\Neodynamic.ReportingServices.Barcode.dll"
An alternate method is to drag and drop the assembly from the file system to the GAC. As
you will notice, the utility that does the job of registering is called
gacutil, and it takes /i and
the path to the assembly name as command-line inputs. This code will work for you if you
selected all default options during the installation of the tool. If you have selected any other
path, make sur
e y
ou make change to the command pr
ompt appr
opriately. All right, we have
enough information to go ahead and
dev
elop the bar
code r
eport.
Creating the Barcode Product List Report
Y
ou
’
r
e wor
king for AdventureWorks, Incorporated as a developer. You have the task of devel-
oping a Product List Barcode report. The report should be the graphical representation of
CHAPTER 13
■
USING THIRD-PARTY TOOLS AND HAVING FUN WITH RS386
8547ch13final.qxd 8/30/07 3:38 PM Page 386
data stored as product ID and provide interactive sorting capabilities for the user on the
P
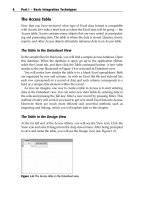
roduct Name column. The report should meet all the characteristics described in
Table 13-1, and the report output should match Figure 13-1.
Table 13-1. Report Characteristics
Characteristics Value
Report title Barcode Product List
Company title AdventureWorks Inc.
Logo No
Data source
tblBarcode
Page size Letter
Page orientation Portrait
Layout design Header and body sections
Figure 13-1. Output of the Barcode Product List report
Business Case
A bar
code
is most commonly used in areas that make use of 12-digit UPCs (Univ
ersal P
roduct
Codes). The UPC is assigned to retail merchandise to identify both the product and the vendor
who sells it.
Typing this rather long 12-digit number to identify every item is surely more effort
than letting a scanner do the job
. B
ar
codes conv
er
t the UPC to machine-readable format.
CHAPTER 13
■
USING THIRD-PARTY TOOLS AND HAVING FUN WITH RS 387
8547ch13final.qxd 8/30/07 3:38 PM Page 387
Barcodes consist of black lines such that the width of each black line and the white space
b
etween lines coincides with the numbers of the UPC. In this report, the UPC is the data con-
tained inside the
ProductID column from table RealWorld.tblBarcode.
Creating a Windows Forms Project
Please open Visual Studio, and use the following steps, illustrated in Figure 13-2, to create a
Windows application project:
1. Click File
➤
New
➤
Project, or press the hot keys Ctrl+Shift+N.
2. In the “Project types” pane of the New Project dialog box, select Visual C#
➤
Windows.
3. In the Templates pane, select Windows Application.
4. Please give the application a name; I’ve called the project Barcode. You may choose a
different location for storing the application files according to your preference.
5. Click the OK button to finish the process. After you click OK, Visual Studio will create a
new Windows application project. You’ll also notice that a new form with the name
Form1 is part of the project.
Figure 13-2. Create a new
W
indo
ws application.
If you face difficulty creating the Windows forms application project, then I’d advise
you to revisit Chapter 4 for detailed instructions. Let’s move on and add the dataset and
ReportViewer to the project. Let’s start by selecting the project in Solution Explorer, right-
clicking it, and selecting Add
➤
New Item
➤
DataSet. Please name the dataset dsBarcode.
CHAPTER 13
■
USING THIRD-PARTY TOOLS AND HAVING FUN WITH RS388
8547ch13final.qxd 8/30/07 3:38 PM Page 388
Before you add the ReportViewer, please make sure Form1 is open in the designer. Now, let’s
add the ReportViewer to the project by dragging Data
➤
ReportViewer from the toolbox and
dropping it onto the form.
Please make sure you set the properties in Table 13-2. After you specify all the properties,
your
Form1 should look similar to Figure 13-3.
Table 13-2. Property Settings for the Barcode Project
Object Property Value
Form1
Text
Barcode third-party control example
Form1
Size
790, 500
reportViewer1
Dock
Fill
Figure 13-3. The project after adding the dataset and ReportViewer
Step 1: Creating a Data Table
Since we already have the dataset in the project, it’s time to add a data table to it. Please use
the following steps to add a data table inside the dataset:
1. Y
ou can go to the dataset designer in two ways: double-click
dsBarcode inside S
olution
Explorer, or right-click the
dsBarcode node and select View Designer.
2. Let’s add the data table by right-clicking the design surface and selecting Add
➤
DataTable.
CHAPTER 13
■
USING THIRD-PARTY TOOLS AND HAVING FUN WITH RS 389
8547ch13final.qxd 8/30/07 3:38 PM Page 389
3. Click the header of the newly created data table, and name it dtBarcode. Let’s start adding
columns to
dtBarcode by right-clicking the data table and selecting Add
➤
Column.
4. Please add the following columns into the data table, which should then look similar
to Figure 13-4:
•
ProductID (System.Int32)
•
Name (System.String)
•
Description (System.String)
Figure 13-4. Final look of the data table dtBarcode
Step 2: Designing the Report Layout
Let’s take a moment to analyze the report layout shown in Figure 13-1. The report lists infor-
mation in three different columns. What makes this report interesting is the first column;
instead of a numeric
ProductID, we will see sophisticated barcode. The second interesting
feature of this report is the interactive sorting ability on Product Name column.
We’re all set to start working on designing the report layout. Let’s add the report by select-
ing the project in Solution Explorer, right-clicking it, and selecting Add
➤
New Item. Next,
select Report from the Add New Item dialog box
. Please name the report rptBarcode.rdlc.
Click the Add button to complete the process and make a new report part of the project.
Adding the Header
Let’s add the Header to the report. As usual, adding a header is as simple as right-clicking the
open area inside the report designer and selecting Page Header
. After completing the action
your report design surface should look similar to the one shown in Figure 13-5.
Figure 13-5. The report designer with header and body sections
CHAPTER 13
■
USING THIRD-PARTY TOOLS AND HAVING FUN WITH RS390
8547ch13final.qxd 8/30/07 3:38 PM Page 390
Setting Up the Page
According to the business case needs, let’s set up the page. We need to make sure the report is
l
etter sized and has portrait page orientation. Right-click the open area inside the design sur-
face, and select Properties; you may wish to put your name in the Author field and add infor-
mation to the Description field.
Designing the Page Header
Now, we have the header and the body sections added to our report. Though you may decide
to work on any of them first, as we always do, let’s start with the header. Please drag and drop
the following report items from the toolbox and drop them inside the header section:
• TextBox item for the report title
• TextBox item for the report date
Recall that report item properties are changed by right-clicking the report item and
selecting Properties or by accessing the general properties toolbox. Let’s change the properties
now; after selecting each text box, specify the value for each according to Table 13-3.
Table 13-3. Report Item Properties for the Header
Report Item Property Value
textbox1
Name
txtReportTitle
Value
Barcode Product List Report
Font
Italic, Arial, 10pt, Bold
textbox2
Name
txtDate
Value
= "Print Date: " & Today
Designing the Body Section
Let’s start working on the body section by dragging Report Items
➤
Table from the toolbox
and dropping it inside the body section on the report designer. A new table item is part of the
r
eport no
w
, and it has the default name of
table1. S
ince we hav
e thr
ee columns in this table,
which are added by default, we don’t need to add additional columns for this report.
As usual, you can take care of mapping data table columns to text boxes by typing an
expr
ession or dr
agging and dr
opping fr
om the data source. Let’s select Data Source
➤
dsBarcode
➤
ProductName and drag and drop it inside the second column of the table’s detail
section. Please repeat this step to fill the Description column. I know what you are thinking,
“
What happened to first column?” W
ell, I want you to drag Image from Toolbox
➤
R
eport
Items and drop it into the first column. Please make sure your report design surface looks
similar to the one shown in Figure 13-6.
CHAPTER 13
■
USING THIRD-PARTY TOOLS AND HAVING FUN WITH RS 391
8547ch13final.qxd 8/30/07 3:38 PM Page 391
Figure 13-6. The report designer after adding the header and body and table
You are probably thinking, “What is this image item doing inside the first column of
table1?” Well, since a barcode is nothing but an image generated by Neodynamic’s tool, we
need the image item to display the equivalent of
ProductID as that barcode image. It might
sound complex to you now, but wait until you see the property settings and code involved.
You’ll be amazed at how simple it is to generate barcodes.
Before we proceed, set the properties of the image item according to Table 13-4.
Table 13-4. Image Item Properties for the First Column (ProductID)
Property Value
Source
Database
Sizing
AutoSize
MIMEType
Image/Png
Value
=Code.GetBarcode(Fields!ProductID.Value.ToString)
So, you might be wondering what this MIMEType property is. The barcode tool generates
results in different graphical formats. For this report, we’re going to use the
.png image format.
To display the barcode correctly, we have to tell the image item to handle graphics of this type.
The Value property is a call to the Neodynamic assembly that takes our
ProductID as input and
returns its barcode equivalent.
All right, are we ready to write some C# code now? Well, not yet. We still have to perform
one important setting. That is, to make reference to the Neodynamic assembly and write a
GetBarcode function.
Adding reference to the barcode assembly is easy; see Figure 13-7 for an illustration of
the steps:
CHAPTER 13
■
USING THIRD-PARTY TOOLS AND HAVING FUN WITH RS392
8547ch13final.qxd 8/30/07 3:38 PM Page 392