Silencing of miR-182 is associated with modulation of tumorigenesis through apoptosis induction in an experimental model of colorectal cancer
Bạn đang xem bản rút gọn của tài liệu. Xem và tải ngay bản đầy đủ của tài liệu tại đây (2.83 MB, 13 trang )
Perilli et al. BMC Cancer
(2019) 19:821
/>
RESEARCH ARTICLE
Open Access
Silencing of miR-182 is associated with
modulation of tumorigenesis through
apoptosis induction in an experimental
model of colorectal cancer
Lisa Perilli1, Sofia Tessarollo2, Laura Albertoni3, Matteo Curtarello1, Anna Pastò1, Efrem Brunetti4, Matteo Fassan3,
Massimo Rugge3, Stefano Indraccolo1, Alberto Amadori1,4, Stefania Bortoluzzi5 and Paola Zanovello1,4*
Abstract
Background: miR-182-5p (miR-182) is an oncogenic microRNA (miRNA) found in different tumor types and one of
the most up-regulated miRNA in colorectal cancer (CRC). Although this microRNA is expressed in the early steps of
tumor development, its role in driving tumorigenesis is unclear.
Methods: The effects of miR-182 silencing on transcriptomic profile were investigated using two CRC cell lines
characterized by different in vivo biological behavior, the MICOL-14h-tert cell line (dormant upon transfer into
immunodeficient hosts) and its tumorigenic variant, MICOL-14tum. Apoptosis was studied by annexin/PI staining and
cleaved Caspase-3/PARP analysis. The effect of miR-182 silencing on the tumorigenic potential was addressed in a
xenogeneic model of MICOL-14tum transplant.
Results: Endogenous miR-182 expression was higher in MICOL-14tum than in MICOL-14h-tert cells. Interestingly, miR182 silencing had a strong impact on gene expression profile, and the positive regulation of apoptotic process was
one of the most affected pathways. Accordingly, annexin/PI staining and caspase-3/PARP activation demonstrated
that miR-182 treatment significantly increased apoptosis, with a prominent effect in MICOL-14tum cells. Moreover, a
significant modulation of the cell cycle profile was exerted by anti-miR-182 treatment only in MICOL-14tum cells,
where a significant increase in the fraction of cells in G0/G1 phases was observed. Accordingly, a significant growth
reduction and a less aggressive histological aspect were observed in tumor masses generated by in vivo transfer of
anti-miR-182-treated MICOL-14tum cells into immunodeficient hosts.
Conclusions: Altogether, these data indicate that increased miR-182 expression may promote cell proliferation,
suppress the apoptotic pathway and ultimately confer aggressive traits on CRC cells.
Keywords: Colorectal cancer, microRNA, Apoptosis, Cell proliferation, Tumorigenesis
Background
MicroRNAs (miRNAs) regulate fundamental cellular processes, such as proliferation, differentiation, migration,
angiogenesis and apoptosis, by repressing translation or inducing cleavage of their targets. MiRNAs are also involved
in cancer development and progression, where they act as
* Correspondence:
1
Immunology and Molecular Oncology Unit, Veneto Institute of Oncology
IOV – IRCCS, Padua, Italy
4
Department of Surgery, Oncology and Gastroenterology, Immunology &
Oncology Section, University of Padova, Padua, Italy
Full list of author information is available at the end of the article
oncogenes or tumor suppressors [1]. A large variety of
miRNAs have been shown to be involved, either as single
elements or in combination [2], in the regulation of
multiple tumorigenic processes and neoplastic phenotypes.
In colorectal cancer (CRC), specific miRNA expression patterns were associated with tumor stage and other clinical
parameters [3]. For instance, increased miR-21 expression
in tumor tissue has been linked to decreased disease-free
survival [4], and high miR-21 levels in plasma may be considered as a potential biomarker for the diagnosis of CRC
[5]. Furthermore, up-regulation of miR-185, miR-221, miR-
© The Author(s). 2019 Open Access This article is distributed under the terms of the Creative Commons Attribution 4.0
International License ( which permits unrestricted use, distribution, and
reproduction in any medium, provided you give appropriate credit to the original author(s) and the source, provide a link to
the Creative Commons license, and indicate if changes were made. The Creative Commons Public Domain Dedication waiver
( applies to the data made available in this article, unless otherwise stated.
Perilli et al. BMC Cancer
(2019) 19:821
182, miR-17-3p, miR-34a, miR-106a, and down-regulation
of miR-133b, miR-150, miR-378 (and combinations
thereof), have been associated with cancer progression, recurrence and poor survival [6–12]. Moreover, miR-10b,
miR-885-5p, miR-210, and miR-155 may provide predictive biomarkers of metastasis and recurrence [13, 14]. Differential response to chemotherapy has also been linked
to miR-21, miR-320a, miR-150 and miR-129 expression
levels [15–18].
In reference to CRC development, we identified miR182-5p (miR-182) as one of the most up-regulated miRNAs
in primary tumors compared to normal colon mucosa, thus
suggesting its potential impact on target genes de-regulated
in CRC [19]. A significant miR-182 increase is observed in
the early phases of tumor development and is maintained
in the metastatic process [20, 21]. Plasma miR-182 concentrations were higher in CRC patients at stage IV than in
controls, and significantly decreased 1 month after radical
hepatic metastasectomy, indicating that evaluation of circulating miR-182 may integrate the array of non-invasive
blood-based monitoring and screening biomarkers [20].
miR-182 has been described as an oncogenic miRNA
implicated in the development of various malignant
histotypes by several studies (reviewed in [22]). In CRC,
available evidence collectively indicates that miR-182 is
one of the major players involved in the acquisition of
malignant properties and it is associated with pro-proliferative signaling pathways and tumor invasion [23–25].
Nevertheless, the mechanisms underlying the ability of
miR-182 to promote the tumorigenic process are not yet
clarified. To fill this gap, we investigated the impact of
miR-182 silencing in two human CRC cell lines
endowed with different tumorigenic potential. Analysis
of transcriptomic and in vitro readouts of miR-182 silencing indicated that this miRNA counteracts apoptosis
and affects cell proliferation. In addition, the in vivo
results showed that miR-182 sustains tumor growth by
altering tumor cell cycle dynamics and morphology.
Methods
Cell lines and patients
HT-29, Caco2 and LoVo cells were obtained from the
American Type Culture Collection (ATCC HTB-38,
ATCC HTB-37, ATCC CCL-229). The CG-705, MICOLS and MICOL-14h-tert cell lines have been previously described [26] and were kindly provided by Dr. P. Dalerba
(Columbia University, NY). Briefly, the CG-705 cell line
was derived from a primary tumor of the right colon;
MICOL-S cell line was derived from the hepatic metastasis of a primary right colon cancer; the MICOL-14h-tert cell
line was derived from a lymph-node metastasis of a patient with rectal cancer. MICOL-S and MICOL-14h-tert
cell lines have similar in vitro morphology and express the
same differentiation markers, but they were derived from
Page 2 of 13
individuals with different primary cancer locations, as reported in Table 1 of the above quoted paper [26]. Both cell
lines were unstable in vitro (i.e. they undergo growth arrest after a few in vitro passages) and were immortalized
by h-TERT cDNA gene transfer. The MICOL-14h-tert cell
line behaves as non-tumorigenic in immunodeficient mice
[27]. However, we demonstrated that the subcutaneous
(s.c.) injection of MICOL-14h-tert cell line into non-obese
diabetic severe combined immunodeficient (NOD/SCID)
mice in combination with angiogenic factors translated
into the acquisition of an in vivo tumorigenic phenotype
[27, 28]. This property was consistently maintained thereafter, and in vivo tumorigenesis experiments confirmed
that MICOL-14h-tert cells behaved as dormant, whereas
NOD/SCID mice injected with the tumorigenic variant
MICOL-14tum developed aggressive tumors within 6
weeks (not shown). Authentication of specific genetic fingerprint by short tandem repeat (STR) DNA profile analysis showed that the two cell lines presented exactly the
same loci number profile, and confirmed their genetic
identity (data not shown); moreover, these cell lines were
tested and scored negative for mycoplasma contamination
when experiments were performed. All cell lines were
grown in RPMI-1640 medium (Invitrogen, Milan, Italy)
supplemented with 10% fetal bovine serum (FBS; Gibco,
Invitrogen), L-glutamine, Pen/Strep and HEPES, and used
within 6 months of thawing and resuscitation. The cells
were harvested with trypsin-EDTA in their exponentially
growing phase, and maintained in a humidified incubator
at 37 °C with 5% CO2 in air. For this study, 5 patients with
sporadic stage IV CRC were also selected [19], and their
tumor tissue and normal mucosa samples were analyzed
by qRT-PCR. The Ethics Committee of the University
Hospital of Padova approved the study, and all patients
provided written informed consent.
RNA extraction, reverse transcription and quantitative RTPCR analysis
RNA was extracted from cells 24, 48 and 72 h after
their transfection using Trizol reagent (Thermo Fisher
Scientific, MA), according to manufacturer’s instructions. RNA concentration and purity were measured
with Nanodrop (Bio-Tek Instruments, Winooski, VT)
and Agilent (Agilent Technologies, Santa Clara, CA).
Reverse transcription and qRT-PCR experiments were
conducted as previously described [19] using Taqman
Gene Expression Assay (Applied Biosystem by
Thermo Fisher Scientific). Expression data were normalized using as a reference RNU44 for miRNAs, and
HPRT1 for transcripts.
miRNA silencing by transient in vitro transfection
Cells were seeded in 6- or 24-well plates in complete
RPMI medium for 24 h. The medium was then replaced
Perilli et al. BMC Cancer
(2019) 19:821
with Opti-MEM® I Reduced Serum Medium (Thermo
Fisher Scientific) and specific hsa-miR-182 mirVana™
miRNA inhibitor (Ambion by Thermo Fisher Scientific)
was added to a total of 150 pmol/well; to allow cell transfection, Lipofectamine RNAiMAX transfection reagent
(Invitrogen) was mixed with the miRNA inhibitor, according to protocol instructions. The mixture was incubated in
the dark for 5 min at room temperature and then added to
each well. In parallel, an equal number of cells were treated
with an anti-miR-NC (mirVana™ miRNA inhibitor
Negative Control #1; Ambion), as a control for data
normalization of anti-mir-182-independent transfection effects. Cells plated in the medium used for the transfection,
but without treatment, provided an additional control.
Moreover, to monitor inhibitor uptake efficiency by
flow cytometry analysis, the same number of cells
were transfected with a carboxyfluorescein-labeled
RNA oligonucleotide (FAM™-labeled Anti-miR™ Negative Control; Ambion). After overnight incubation, the
Opti-MEM medium supplemented with miRNA inhibitor or control was replaced with complete RPMI,
and miRNA silencing was evaluated by qRT-PCR at
different time points. At each time point, cells were
also harvested to perform the experiments for miRNA
function investigation. In all silencing experiments,
transfection efficiency consistently exceeded 80%, and
miRNA expression levels were decreased > 70% in
transfected cells compared to controls.
Apoptosis and cell cycle assay
To detect cell death, the Annexin-V-FLUOS staining kit
(Roche, Mannheim, Germany) was used according to
manufacturer’s instructions. For cell cycle analysis, cells
were fixed with cold ethanol, stained with anti-human
Ki67 (BD Biosciences, Franklin Lakes, NJ, USA) and
then incubated for 1 h in a DAPI/RNAse solution. Cytofluorimetric analysis was performed on a FACS Calibur
flow cytometer (Becton-Dickinson Immunocytometry
Systems, NJ; excitation/emission wavelengths of 488/525
and 488/675 nm for Annexin-V and PI, respectively).
Western blot analysis
Cell lysates were obtained in RIPA buffer containing protease inhibitor, and protein contents were quantified using
Quantum Micro Protein Assay Kit (Euroclone, Milan,
Italy). Experiments were conducted as previously described
[29] using the following primary antibodies: rabbit antiCleaved Caspase-3 (1:1000; Cell Signaling Technology,
MA), rabbit anti-PARP (1:1000; Cell Signaling Technology)
and mouse anti-β-actin (1:1000; Santa Cruz Biotechnologies, CA). The following secondary antibodies were used:
goat anti-rabbit (1∶5000; Bioss Antibodies, MA) or goat
anti-mouse (1∶5000; Calbiochem MerckMillipore, Darmstadt, Germany) conjugated to horseradish peroxidase and
Page 3 of 13
visualized using Supersignal West Pico Chemiluminescent
Substrate Kit (Thermo Fisher Scientific) with the Chemidoc XRS System and Quantity One 4.6.9 software (both
from Bio-Rad, Hercules, CA). Densitometric analysis was
performed with the ImageJ software (NIH).
In vivo tumorigenesis assay
Non obese diabetic/severe combined immune deficiency
(NOD/SCID) mice were bred in our SPF animal facility.
All procedures involving animals and their care conformed to institutional guidelines that comply with national and international laws and policies (EEC Council
Directive 86/609, OJ L 358, 12 December 1987). Before in
vivo transfer, the tumorigenic MICOL-14tum cells were
treated with miR-182 inhibitor or anti-miR-NC as a control. For tumor establishment, 7 to 9-week-old mice were
s.c. injected into both dorsolateral flanks with exponentially growing untreated or miR-182 silenced MICOL14tum cells (0.5 × 10⁶ cells in a 100 μl volume containing
Matrigel). After 1 week, mirVana™ miR-182 inhibitor in
vivo ready (Life Technologies by Thermo Fisher Scientific)
or negative control were combined with Invivofectamine
2.0 Reagent (Life Technologies) and used for intratumoral
injection to maintain in vivo miRNA silencing. The resulting tumor masses were inspected and measured as previously described [28]. In all experiments, the mice survived
until the experimental endpoint, when they were sacrificed
by cervical dislocation. Tumors were harvested by dissection, and either snap-frozen or fixed in formalin and embedded in paraffin for further analysis. Isofluran
anaesthetic was used prior to injecting mice with tumor
cells and before sacrifice.
CRC grading and mitotic index evaluation
The tumor sections were evaluated by Hematoxylin and
Eosin (H&E) staining for CRC grading and mitotic index
evaluation. The 2010 WHO scoring for CRC Grading,
based upon the percentage of gland formation (> 75%; 35–
75% and < 35%, respectively), is as follows: G1 well differentiated cancer, G2 moderately differentiated cancer and
G3 poorly differentiated cancer, and is. Main growth patterns were from less to more aggressive: glandular, trabecular and solid. The mitotic index, mirroring the ratio
between the number of cells in a population undergoing
and not undergoing mitosis, was calculated by counting
the number of mitosis in 10 fields at 40X magnification.
Gene expression analysis
Expression data were generated using the Affymetrix GeneChip PrimeView Human Gene Expression Array (Affymetrix by Thermo Fisher Scientific) using total RNA isolated
from MICOL-14h-tert and MICOL-14tum cells transfected
with either anti-miR-182 or anti-miR-NC. Raw data quality
control was performed using the R package ‘affyQCreport’
Perilli et al. BMC Cancer
(2019) 19:821
[30]. Expression matrix reconstruction was obtained by
‘affy’ package [31] using RMA for data summarization and
normalization. Transcript-level annotation of probesets,
based on Ensembl (release 88), was obtained with R package ‘primeviewcdf’. Differential expression tests were conducted using Limma package [32], setting significance
threshold to 0.05 for p-value, adjusted using FDR method
for multiple testing correction.
Pathway enrichment analysis of differentially expressed
genes was conducted using DAVID (Database for Annotation, Visualization and Integration Discovery, release
6.8) [33]. Significant GO terms, PIR keywords, and
KEGG and Reactome pathways were selected considering adjusted p-values (Benjamini-Hochberg) at most
0.05. Experimentally validated and predicted miR-182
target transcripts were downloaded from MirTarBase
(release 6.0) [34] and from TargetScanHuman (release
7.1) [35], respectively.
Statistical analysis
Results were expressed as mean values ± SD. Two-tail
Student’s t-test was performed on parametric groups.
Values were considered significant at *p ≤ 0.05 and
**p ≤ 0.01. All analyses were performed with SigmaPlot
(Systat Software Inc. San Jose, CA).
Results
miR-182 is up-regulated in CRC cell lines and can be
efficiently silenced in tumorigenic and non-tumorigenic
cell lines
miR-182 expression levels were evaluated by qRT-PCR
in normal colon mucosa samples as a reference, and in a
panel of seven CRC cell lines. Significant miR-182 upregulation was observed in all the analyzed cancer cell
lines (Fig. 1A), strengthening the evidence that increased
miR-182 expression is a shared feature of CRC [19].
Highest miR-182 expression levels were measured in
MICOL-14tum cells followed by parental MICOL-14h-tert
cells. Based on these results, we focused subsequent experiments of miR-182 silencing in MICOL-14tum and
MICOL-14h-tert cells, as a model of two cell lines which
share the STR DNA profile but differ in key phenotypic
properties such as the ability to generate tumors in immunodeficient recipients.
Treatment with anti-miR-182 effectively inhibited
miR-182 expression in both cell lines. In particular, 24 h
after treatment, the miR-182 expression resulted significantly repressed by a factor of 0.55 (p = 0.0034) and 0.17
(p = 0.0008) in MICOL-14h-tert and MICOL-14tum, respectively. Silencing was maintained at all the time
points considered and lasted for over 72 h in both cell
lines (Fig. 1b).
Page 4 of 13
miR-182 silencing strongly increases apoptosis and
affects cell cycle
We next wondered whether miR-182 silencing could
affect some key properties of MICOL-14h-tert and
MICOL-14tum cells lines, such as apoptosis and cell cycle
dynamics. Judging from annexin/PI staining, miR-182
inhibition was associated with a significant increase in
apoptosis in both cell lines, compared to untreated cells
(NT) and control anti-miR-NC treated cells (Fig. 2a). At
24 h post-treatment, the increase in apoptosis was comparable in MICOL-14h-tert and MICOL-14tum cells,
whereas at later time points (48 and 72 h), apoptosis
levels were significantly increased in the tumorigenic cell
line compared to the dormant counterpart.
Western blot analysis of cleaved PARP and Caspase-3
proteins, performed 48 h post-treatment, confirmed the
above results. Indeed, as shown in Fig. 2b, a decrease in
total PARP and an eventual increase in cleaved PARP
was observed in both MICOL-14h-tert and MICOL-14tum
cells, compared to the cells treated with control antimiR-NC. However, the ratio between total and cleaved
PARP was lower in MICOL-14tum cells, indicating that
the complex machinery regulating apoptotic phenomena
was preferentially affected by miR-182 silencing in the
tumorigenic cell line.
The involvement of miR-182 in cell cycle progression
was supported by proliferation rate analysis. While
MICOL-14h-tert cells only disclosed minimal changes in
cell cycle profile after anti-miR-182 treatment (Fig. 2c), a
significant increase in the fraction of cells in G0/G1
phases was observed in MICOL-14tum cells, associated
with a corresponding decrease in the S and G2 phases
(Fig. 2c). These data indicated that miR-182 inhibition in
MICOL-14tum cells may modulate cell proliferation rate
and strongly induce apoptosis.
miR-182 silencing significantly affects gene expression
profile of MICOL-14h-tert and MICOL-14tum cells
To explore the complex biological processes involved in
the above-described functional changes, transcript and
gene expression profiling was performed on MICOL14h-tert and MICOL-14tum 24 h after treatment with antimiR-182 or anti-miR-NC. Four replicates for cell type
and condition were tested. Expression profiles of 49,293
probesets, corresponding to 41,532 transcripts and to 19,
942 individual genes, in the 16 samples considered, were
acquired.
Unsupervised Principal Component Analysis (PCA)
of transcript expression profiles showed that samples
separated first for cell line, indicating that the two
cell lines display highly different expression profiles,
and then by treatment, underlying the effect of miR182 inhibition on expression profiles of both lines
(Fig. 3a). Accordingly, expression data informed on
Perilli et al. BMC Cancer
(2019) 19:821
Page 5 of 13
a
b
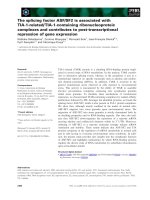
Fig. 1 Expression of miR-182 in healthy colon mucosa and a panel of CRC cell lines. a The CRC cell lines were investigated by qRT-PCR for miR182 expression levels compared to a pool of normal colon mucosa samples. All cell lines showed high levels of miR-182, and in particular in the
tumorigenic variant MICOL-14tum compared to MICOL14h-tert. Colon N, pool of normal colon mucosa. nRQ, normalized Relative Quantity. Mean
values ± SD of 3 consecutive experiments are shown. *p < 0.01. b mir-182 inhibition in MICOL-14h-tert and MICOL-14tum cells. The evaluation of
miR-182 expression levels was performed by qRT-PCR at 24, 48, and 72 h after the treatment. Data analysis was performed by ΔΔCt method, and
the control groups (NT and anti-miR-NC treated cells) were used as a sample reference at each time point. Data were expressed as mean value ±
SD of 3 independent experiments. nRQ, normalized Relative Quantity. *p < 0.01
differential expression between the dormant and the
tumorigenic cell lines and, more importantly, on expression changes determined by miR-182 silencing in
each cell line.
Comparing anti-miR-182 vs anti-miR-NC, significant
differential expression was detected in both cell lines
(Fig. 3b), with a more marked impact of miR-182 silencing in MICOL-14tum (3472 differentially expressed
transcripts from 1382 genes, 40% up-regulated), than in
MICOL-14h-tert cells (669 transcripts from 243 genes,
73% up-regulated). Genes differentially expressed after
miR-182 silencing are expected to include both direct
miRNA targets, likely enriched with those up-regulated
after miRNA silencing, and indirectly regulated genes
due to miR-182 impact on transcriptional and post-transcriptional regulators in complex regulatory circuits.
According to our data, 759 genes had transcripts
(1825 in total) significantly up-regulated after miR-182
Perilli et al. BMC Cancer
(2019) 19:821
a
b
c
Fig. 2 (See legend on next page.)
Page 6 of 13
Perilli et al. BMC Cancer
(2019) 19:821
Page 7 of 13
(See figure on previous page.)
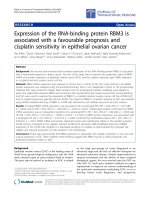
Fig. 2 Effect of anti-miR-182 treatment on apoptosis and cell cycle progression of MICOL-14h-tert and MICOL-14tum cell lines. a miR-182 silencing
was associated with increased sensitivity of cells to apoptosis in both MICOL-14h-tert and MICOL-14tum cell lines, as determined by Annexin V/PI
staining at different time points following treatment. The results of three independent experiments in triplicate were expressed as mean fold
change ± SD over the baseline apoptosis. b Western blot analysis (left panel) of cleaved Caspase-3 and PARP in MICOL-14h-tert and MICOL-14tum
cell lines non-transfected (NT) and transfected with anti-miR-182 or control vector (miR-NC). The right panel shows the densitometric analysis of
the ratio between cleaved and total PARP. β-actin was used as a loading control. The WB image is representative of three independent
experiments; mean values ± SD of 3 consecutive experiments are shown in the right panel. c The cell cycle analysis was performed in MICOL14h-tert and MICOL-14tum cell lines 48 h after treatment using Ki67 and DAPI staining. The control populations (NT and anti-miR-NC cells) were
used as references at each time point. *p < 0.05
inhibition in one or both cell lines. Notably, 15 of these
genes (ATF1, PNISR, ANKRD36, ARRDC3, NR3C1,
ZFP36L1, RGS2, DDAH1, SESN2, FLOT1, FAM193A,
BRWD1, RBM12, QSER1, TNRC6A) were already validated as canonical miR-182 targets according to miRTarBase. Upregulated transcripts from additional 234
genes were TargetScan-predicted miR-182 targets (Additional file 1: Table S1). Of the 158 genes with transcripts differentially expressed after miR-182 inhibition
in both cell lines, a vast majority (153) showed expression changes in the same direction in the two cell lines,
prevalently (103) up-regulation.
Functional Gene Ontology (GO) terms and significantly enriched pathways were detected considering
genes differentially expressed after miR-182 inhibition in
each cell line Additional files 2 and 3: Tables S2-S3) and
in both cell lines (Table 1). According to in vitro data on
the impact of miR-182 silencing on the apoptotic
process, “positive regulation of apoptotic process” was
the most enriched biological process among genes
a
differentially expressed in both cell lines after miR-182
inhibition. Moreover, an enrichment of p53 signaling
and FoxO signaling pathways, both multifunctional processes in the cross-talk with apoptosis regulation
through common genes and proteins [36], was also
observed.
The significant upregulation after miR-182 silencing of
miR-182 predicted target transcripts of HIST1H2BH,
NABP1, RND3, and TRIO genes (all encoding proteins
with potential role in DNA-damage response and invasion) was confirmed by transcript-specific qRT-PCR assay
(Fig. 4a-b, and Additional file 4: Table S4). In particular,
the NABP1 gene, which is involved in the GO “DNA
repair” pathway taking part in the apoptotic process, was
significantly enriched in the anti-miR-182-treated tumorigenic cell line. Interestingly, a significant NABP1 expression decrease was observed in a pool of primary CRC
samples, in which increased miR-182 levels were previously assessed [21], compared to matched normal colon
mucosa (Fig. 4c).
b
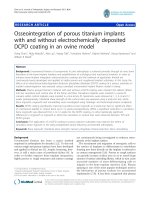
Fig. 3 Gene expression profiles changes associated with miR-182 silencing in MICOL-14h-tert and MICOL-14tum cells. A. Principal Component
Analysis (PCA) of samples according to transcript expression profiles measured by Primeview array analysis indicates differences among control
samples of different cell lines and more importantly, for each cell line, a clear separation of anti-miR-182 treated and control samples pointed
toward the readout of miR-182 silencing. B. Number of significantly up- or down-regulated transcripts differentially expressed is compared
between anti-miR-182-treated and control samples in MICOL-14h-tert and MICOL-14tum cells
Perilli et al. BMC Cancer
(2019) 19:821
Page 8 of 13
Table 1 Gene Ontology (GO) functional terms and KEGG pathways significantly enriched considering 158 genes differentially
expressed after miR-182 inhibition in both cell lines. BP, Biological Process; CC, Cellular Component; MF, Molecular Function
Functional
category
Term/Pathway
GO BP
Regulation of transcription, ITGB3BP, EID3, SRSF10, EID2B, PPHLN1, ZNF557, SPTY2D1, NR3C1,
DNA-templated
ZNF638, ZNF655, ZNF165, ZFP36L1, SRRT, SFSWAP, ZNF181, ZNF226,
HIF1A, PNRC2, THAP1, TCF3, NFIA, ZNF267, ZNF101
23
2.52
0.027
Positive regulation
of apoptotic process
ITGB3BP, HIF1A, SQSTM1, TRIO, GADD45B, VAV2, GADD45A, LATS1,
BCL2L11, IP6K2, PHLDA1
11
5.21
0.0333
Nucleus
ITGB3BP, TUBB2A, EID2B, CLK1, HIST2H4A, TCEAL1, CAMKK2, NFATC2IP,
FUBP1, SFSWAP, CCNE1, ZNF181, BLZF1, CLK4, ANKRD11, NSMCE2, AKIRIN1,
IP6K2, ZNF101, TIGD1, RELB, CCNL1, NABP1, HIF1A, MSANTD4, CUX1, GADD45B,
GADD45A, SRSF10, SLF2, ZNF557, NR3C1, ZNF655, PXK, SESN2, TSPYL4, ZFP36L1,
SFR1, VRK2, ZNF226, HIST1H4E, THAP1, TCF3, ZNF267, FKTN, TKT, ZNF165, RERG,
CDKN1A, ATF3, ZBED4, PNRC2, RNPC3, PDCD6, PPP2R3C, NFIA
56
1.53
0.0202
Nucleoplasm
ITGB3BP, EID3, SRSF10, NR3C1, ZNF638, HIST2H4A, TCEAL1, FUBP1, CCNE1, SRRT,
BLZF1, SQSTM1, ANKRD11, HIST1H4E, NSMCE2, AKIRIN1, TCF3, AKT3, IP6K2, NQO2,
PPP4R3B, PPHLN1, RELB, TKT, TRNT1, NABP1, CDKN1A, ATF3, HIF1A, SMARCC1,
MAPK9, RNPC3, SCAF8, CUX1, GADD45A, NFIA
36
1.94
0.0127
GO MF
Protein binding
ITGB3BP, TUBB2A, CLK1, HIST2H4A, LATS1, RSRC2, FUBP1, SFSWAP, CCNE1, BLZF1,
91
CLK4, ARL14, RABGEF1, NSMCE2, AKIRIN1, AKT3, ZNF101, NQO2, IP6K2, RAP2A,
TTC32, RELB, CCNL1, RBKS, CCT6A, C8ORF44-SGK3, MRM1, BCL2L11, NABP1, HIF1A,
NUCB2, USO1, MAPK9, G0S2, MAPRE2, GADD45B, SCAF8, GADD45A, EID3, SRSF10,
SLC38A9, SNX5, CALD1, SLF2, RPS15A, FAM122A, FKBP1A, NR3C1, C6ORF226, ZNF655,
TSPYL4, PPCDC, SESN2, ZFC3H1, ZFP36L1, SRRT, SFR1, VRK2, C1ORF50, KLC1, SQSTM1,
HIST1H4E, LETMD1, THAP1, TCF3, INPP5A, PHLDA1, CCNB1IP1, RBM12B, PPHLN1, ASXL1,
TRIO, TKT, RCAN3, VAV2, SGTB, ATG3, RPL28, ZNF165, PPIF, CDKN1A, C1ORF116, ATF3,
SMARCC1, PNRC2, ZBED4, RIT1, AGR2, PDCD6, ALG13, PPP2R3C
1.46
1.05E05
KEGG
FoxO signaling pathway
CDKN1A, MAPK9, GADD45B, C8ORF44-SGK3, GADD45A, AKT3, BCL2L11
7
8.31
0.0185
p53 signaling pathway
CCNE1, CDKN1A, GADD45B, SESN2, GADD45A
5
11.86
0.0434
GO CC
Gene symbol
miR-182 inhibition in MICOL-14tum xenografts impairs in
vivo tumor growth and is associated with morphological
and histological changes
In vitro analyses and gene expression profiles strongly
supported a role of miR-182 in the MICOL-14tum cells
tumorigenic phenotype. Thus, we investigated whether
miR-182 silencing could also affect the in vivo tumor
growth of MICOL-14tum cells in a xenogeneic model of
tumorigenesis. To this end, MICOL-14tum cells were
treated with ant-miR-182 or the appropriate control,
and injected s.c into NOD/SCID mice. Although the in
vitro silencing effect of anti-miR-182 was still present in
MICOL-14tum cells several days after treatment (see Fig.
1b, and data not shown), 1 week after cell transfer an
intra-tumor injection of anti-miR-182 was performed to
buttress in vivo miR-182 silencing (Fig. 5a). The mice inoculated with control MICOL-14tum cells developed significantly larger tumors, compared to mice injected with
anti-miR-182-treated cells (Fig. 5b). Interestingly, miR182 inhibition was associated with a significant reduction in tumor size 3 weeks after injection (p = 1.56 × 10−
5
), and 5 weeks later the volume of tumor masses was
still significantly different (Fig. 5b; p = 0.037).
Notably, miR-182 inhibition was associated with
evident histological and morphological changes in the
tumor tissue harvested from immunodeficient recipients
(Fig. 5c). In fact, the tumor masses generated by
MICOL-14tum control cells consistently showed
Genes Fold
Adj.
Enrich. p-value
moderately to poorly differentiated adenocarcinoma with
bulky appearance, trabecular-solid pattern, minimal fibrosis and pushing borders. In contrast, the tumor
masses developed after inoculation of anti-miR-182treated MICOL-14tum cells showed mainly moderately
differentiated adenocarcinoma with mild fibrosis within
(Fig. 5c). Moreover, the average mitotic index of tumor
masses was significantly higher in control mice than in
animals injected with anti-miR-182-treated cells (Fig.
5d), indicating that miR-182 inhibition also impairs cell
proliferation in vivo.
Discussion
miR-182 deregulation has been reported in several human cancer types, including CRC. We previously observed that miR-182 overexpression is already present in
the transition from normal colonic mucosa to tubular
adenoma and is stably maintained in primary CRC
tumor and liver metastases. This seems to indicate that
the miR-182 upregulation occurs in early premalignant
development and is associated with the maintenance of
the malignant phenotype [19]. Furthermore, we also
demonstrated that high expression levels of miR-182 do
not characterize mucosa samples from patients with inflammatory bowel disease, thus suggesting that its deregulation is not a mere consequence of the chronic
inflammatory process [21]. Interestingly, in a large functional miRNA screening, Cekaite et al. found that miR-
Perilli et al. BMC Cancer
(2019) 19:821
Page 9 of 13
a
b
c
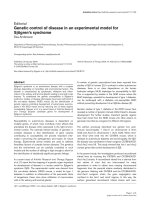
Fig. 4 Description and qRT-PCR evaluation of predicted transcript targets after miR-182 silencing. a Microarray analysis in MICOL-14 h-tert and
MICOL-14tum cell lines showed upregulation of miR-182 target gene transcripts after miR-182 inhibition (positive logFC comparing anti-miR-182
vs anti-miR-NC). b qRT-PCR evaluation of the transcript expression levels of selected genes in MICOL-14h-tert and MICOL-14tum cell lines. Data
analysis was performed by ΔΔCt method, and the control groups (NT and anti-miR-NC treated cells) were used as sample references in cell lines.
Data were expressed as mean values ± SD of three independent experiments. nRQ, normalized Relative Quantity. *p < 0.05 **p < 0.01. c NABP1
levels were compared in a pool of primary CRC samples (T), in which increased miR-182 levels were known, and matched normal colon
mucosa (N)
Perilli et al. BMC Cancer
(2019) 19:821
Page 10 of 13
a
b
c
d
Fig. 5 Effect of miR-182 silencing on tumor outgrowth and histological features of MICOL-14tum xenografts. a Experimental layout for the study
of the effects of miR-182 silencing on the ability of MICOL-14tum cells to generate tumors upon injection into immunodeficient hosts. MICOL14tum cells were treated with anti-miR-182 or anti-miR-NC, and after 24 h they were s.c. injected into NOD/SCID mice. A week later, an
intratumoral injection of in vivo ready anti-miR-182 and Invivofectamine was performed to sustain miR-182 knockdown. b Tumor outgrowth was
measured 3 and 5 weeks after inoculation of MICOL-14tum. The control group (anti-miR-NC treated cells) was used as a reference at each time
point. Center lines of box plots show the medians; box limits indicate the 25th and 75th percentiles, as determined by R software. *p < 0.05,
**p < 0.01. c Reduction of tumor growth and changes of the morphological features of miR-182-silenced MICOL-14tum xenografts. H&E staining of
tumor sections is shown at the bottom. Magnification 20X. The control groups (NT and anti-miR-NC treated cells) were used as a reference. d
Mitotic index and grading in tumor masses obtained from anti-miR-182-treated MICOL-14tum. Control cells (NT and anti-miR-NC) mostly grew as
G2/G3 or G3 adenocarcinomas, whereas anti-miR-182 masses mainly showed a moderately differentiated adenocarcinoma profile (G2 and G2/G3)
Perilli et al. BMC Cancer
(2019) 19:821
182 gene, a component of miRNA cluster miR-183-96182 located in 7q32 genomic region, is amplified in
26% of primary CRC and 30% of liver metastases
[25]. In the same large-scale analysis, a link between
reduced apoptosis and deregulation of a combined set
of miRNAs, namely miR-9, − 31, and − 182, was also
reported in two independent CRC cell lines, suggesting
that miR-182 is involved in CRC development and progression by promoting cell survival. Thus, the impact of
miR-182 on apoptosis, proliferation and invasion as well
as on chemo-resistance has recently been addressed in
search for a link between its high expression and the acquisition of functional properties favorable to tumor development [37–39].
In the present study, the impact of miR-182 silencing on
the biological properties of MICOL-14h-tert and MICOL14tum cell lines was investigated in vitro and in vivo, demonstrating that miR down-regulation strongly increases
apoptosis and affects cell cycle dynamics in both cell lines,
with a more pronounced and long-lasting effect in the
tumorigenic cell line compared to the dormant counterpart. Evidence that anti-miR-182 treatment impairs the
tumorigenic potential of the MICOL-14tum cell line after
the xenogenic transplant in immunodeficient mice was
also provided. However, miR-182 silencing was associated
with a delay in the generation of tumors by the MICOL14tum cell line and did not abrogate its tumorigenic potential. Reactivation of miR-182 a few weeks after silencing in
some transduced cells, and their eventual outgrowth, or
the presence within the transferred population of a few
cells with ineffective silencing could explain this finding.
miRNAs are highly pleiotropic and a single miRNA
can influence many genes. Thereby deregulation of a
single miRNA can deeply affect cellular phenotypes. Indeed, tumor masses generated by miR-182 silenced
MICOL-14tum cells showed histological features compatible with less aggressive carcinomas, compared to untreated tumors. This could suggest that miR-182 may
play a role in apoptosis as well as in other processes, including cell survival and differentiation. On the other
hand, gene expression profiling showed that miR-182 silencing affects the expression of a large number of genes
in both MICOL-14h-tert and MICOL-14tum cells, with a
stronger impact in the tumorigenic cell line. The two
cell lines were endowed with different gene expression
profiles and in response to anti-miR-182 treatment, behaved differently. Nevertheless, 158 genes were differentially expressed in both cell lines and pointed to three
significantly enriched pathways correlated with cellular
survival: “positive regulation of apoptotic process”, “p53
signaling” and “FoxO signaling”. These pathways shared
two interesting components of the Gadd gene family,
Gadd 45A/B. Gadd protein expression can be induced,
in a p53-dependent or –independent way, by DNA
Page 11 of 13
damage and other stress signals associated with growth
arrest and apoptosis [40]. These proteins have been implicated in a variety of responses to cell injury, including
the control of cell cycle checkpoints, apoptosis, and
DNA repair. We confirmed by qRT-PCR assay the significant upregulation after miR-182 silencing of two
genes, HIST1H2BH and NABP1. HIST1H2BH is a member of a large histone gene family, histones H2A, H2B,
H3 and H4. Two heterodimers of H2A/H2B and one
H3/H4 tetramer, associated with DNA, form the compact structure of chromatin in nucleosome. Interestingly,
H2A/H2B plays an important role in processes that
allow for transcription, DNA replication and DNA repair
[41]. NABP1, also known as SSBP2, encodes a component of the single-strand DNA binding complex, whose
role in the maintenance of genomic stability has only recently emerged [42]. NABP1 influences diverse endpoints in the cellular DNA damage response, including
cell cycle checkpoint activation. We demonstrated in a
pool of primary CRC samples the significant decrease of
NABP1 mRNA levels in tumor tissue compared to normal mucosa, strengthening observations on gene expression. Our findings are in line with data by Krishnan et
al. in breast cancer [37], and specifically support the idea
that, in CRC as well, miR-182-mediated deregulation of
the DNA damage response pathway could translate into
impaired DNA repair with downstream effects on genetic stability and cellular transformation.
Conclusions
Altogether, our data highlight the relevance of miR-182
dysregulation in CRC tumorigenesis and provide evidence that this miRNA controls apoptosis and proliferation, clearly pointing to specific components of
apoptosis and DNA repair processes highly represented
in the network of miR-182 validated or predicted target
genes.
Additional files
Additional file 1: Table S1. Predicted and validated miR-182 targets
upregulated after miR-182 silencing in one or both cell lines. Only
transcripts with average expression at least 3, significantly up-regulated
with a log FC > 0.3 are reported (val, validated target according to
MiRTarBase; pre, TargetScan predicted target). (DOCX 148 kb)
Additional file 2: Table S2. Gene Ontology (GO) functional terms,
KEGG and Reactome pathways significantly enriched considering 242
genes differentially expressed after miR-182 inhibition in MICOL-14h-tert
cells. BP, Biological Process; CC, Cellular Component; MF, Molecular
Function. (DOCX 30 kb)
Additional file 3: Table S3. Gene Ontology (GO) functional pathways
significantly enriched considering 1382 genes differentially expressed
after miR-182 inhibition in MICOL-14tum cells. BP, Biological Process; CC,
Cellular Component; MF, Molecular Function. (DOCX 25 kb)
Additional file 4: Table S4. MiR-182 predicted target transcripts for
which differentially expression in MICOL-14h-tert and/or MICOL-14tum cells
Perilli et al. BMC Cancer
(2019) 19:821
after treatment was confirmed by RT-PCR. The table showed the
transcripts and the correspondinggenes, probesets and Taqman Assay ID
used for experimental qRT-PCR validation. For each probeset and cell line,
the expression variation observed according to Primeview Microarray
data analysis is shown as LogFC of the anti-miR-182 vs anti-miR-NC
comparison; values corresponding to a stastistically significant differential
expression are in bold. (DOCX 19 kb)
Abbreviations
CRC: Colorectal cancer; miRNA: microRNA; NOD/SCID: Non obese diabetic/
severe combined immune deficiency; s.c.: Subcutaneous
Acknowledgements
We thank C. Drace for English language editing.
Authors’ contributions
Study conception and design: LP and PZ; Selection of patients: LA and MF;
Histopathological re-evaluation of tissues: LA, MF and MR; Laboratory experiments and acquisition of data: LP, ST, EB, MC and AP; Analysis and interpretation of data: LP, SI, SB and PZ; Drafting of the manuscript: LP; Revision of
the manuscript: LP, SI, SB, AA and PZ; Study supervision: PZ and SB. All authors have read and approved the final manuscript.
Funding
This study was supported by grants from AIRC (IG 2013 n. 14256), University
of Padova (PRAT CPDA129789) and IOV 5 × 1000 Intramural Research Grant
2015 ‘miR-182 as possible biomarker of CRC progression’ to P. Zanovello.
Funder’s Agencies provided support to cover expenses for personal,
consumables and supplies, and small bench instrumentation, and had no
direct role in conducting research and experiments.
Page 12 of 13
4.
5.
6.
7.
8.
9.
10.
11.
12.
Availability of data and materials
The datasets obtained and/or analyzed during the current study are available
from the corresponding author upon reasonable request.
13.
Ethics approval and consent to participate
All procedures involving animals and their care conformed to institutional
guidelines that comply with national and international laws and policies (EEC
Council Directive 86/609, OJ L 358, 12 December 1987).
The study was approved by the Ethics Committee of the University Hospital
of Padua (n. 57841 December 3rd, 2013) and written informed consent was
obtained from all the patients involved.
14.
15.
16.
Consent for publication
Not applicable.
17.
Competing interests
The authors declare that they have no competing interests.
18.
Author details
1
Immunology and Molecular Oncology Unit, Veneto Institute of Oncology
IOV – IRCCS, Padua, Italy. 2Genetics and Molecular Biology Unit, ULSS 8
Berica, Vicenza, Italy. 3Surgical Pathology and Cytopathology Unit,
Department of Medicine, University of Padova, Padua, Italy. 4Department of
Surgery, Oncology and Gastroenterology, Immunology & Oncology Section,
University of Padova, Padua, Italy. 5Department of Molecular Medicine,
University of Padova, Padua, Italy.
Received: 29 May 2019 Accepted: 26 July 2019
References
1. Ragusa M, Barbagallo C, Statello L, Condorelli AG, Battaglia R, Tamburello L,
Barbagallo D, Di Pietro C, Purrello M. Non-coding landscapes of colorectal
cancer. World J Gastroenterol. 2015;21:11709–39.
2. Ma Y, Liang AJ, Fan YP, Huang YR, Zhao XM, Sun Y, Chen XF. Dysregulation
and functional roles of miR-183-96-182 cluster in cancer cell proliferation,
invasion and metastasis. Oncotarget. 2016;7:42805–25.
3. Slattery ML, Herrick JS, Pellatt DF, Mullany LE, Stevens JR, Wolff E, Hoffman
MD, Wolff RK, Samowitz W. Site-specific associations between miRNA
19.
20.
21.
22.
23.
24.
expression and survival in colorectal cancer cases. Oncotarget. 2016;7:
60193–205.
Nielsen BS, Jorgensen S, Fog JU, Sokilde R, Christensen IJ, Hansen U,
Brunner N, Baker A, Moller S, Nielsen HJ. High levels of microRNA-21
in the stroma of colorectal cancers predict short disease-free survival
in stage II colon cancer patients. Clin Exp Metastasis. 2011;28:27–38.
Carter JV, Galbraith NJ, Yang D, Burton JF, Walker SP, Galandiuk S.
Blood-based microRNAs as biomarkers for the diagnosis of colorectal
cancer: a systematic review and meta-analysis. Br J Cancer. 2017;116:
762–74.
Akcakaya P, Ekelund S, Kolosenko I, Caramuta S, Ozata DM, Xie H,
Lindforss U, Olivecrona H, Lui WO. miR-185 and miR-133b deregulation
is associated with overall survival and metastasis in colorectal cancer.
Int J Oncol. 2011;39:311–8.
Aherne ST, Madden SF, Hughes DJ, Pardini B, Naccarati A, Levy M,
Vodicka P, Neary P, Dowling P, Clynes M. Circulating miRNAs miR-34a
and miR-150 associated with colorectal cancer progression. BMC Cancer.
2015;15:329.
Zhang GJ, Zhou H, Xiao HX, Li Y, Zhou T. MiR-378 is an independent
prognostic factor and inhibits cell growth and invasion in colorectal
cancer. BMC Cancer. 2014;14:109.
Pu XX, Huang GL, Guo HQ, Guo CC, Li H, Ye S, Ling S, Jiang L, Tian Y,
Lin TY. Circulating miR-221 directly amplified from plasma is a potential
diagnostic and prognostic marker of colorectal cancer and is correlated
with p53 expression. J Gastroenterol Hepatol. 2010;25:1674–80.
Rapti SM, Kontos CK, Papadopoulos IN, Scorilas A. Enhanced miR-182
transcription is a predictor of poor overall survival in colorectal
adenocarcinoma patients. Clin Chem Lab Med. 2014;52:1217–27.
Yuan D, Li K, Zhu K, Yan R, Dang C. Plasma miR-183 predicts
recurrence and prognosis in patients with colorectal cancer. Cancer Biol
Ther. 2015;16:268–75.
Li J, Liu Y, Wang C, Deng T, Liang H, Wang Y, Huang D, Fan Q, Wang
X, Ning T, et al. Serum miRNA expression profile as a prognostic
biomarker of stage II/III colorectal adenocarcinoma. Sci Rep. 2015;5:
12921.
Hur K, Toiyama Y, Schetter AJ, Okugawa Y, Harris CC, Boland CR, Goel A.
Identification of a metastasis-specific MicroRNA signature in human
colorectal cancer. J Natl Cancer Inst. 2015;107:1–11.
Chen J, Wang W, Zhang Y, Chen Y, Hu T. Predicting distant metastasis and
chemoresistance using plasma miRNAs. Med Oncol. 2014;31:799.
Liu K, Li G, Fan C, Zhou X, Wu B, Li J. Increased expression of microRNA21and its association with chemotherapeutic response in human colorectal
cancer. J Int Med Res. 2011;39:2288–95.
Perez-Carbonell L, Sinicrope FA, Alberts SR, Oberg AL, Balaguer F, Castells A,
Boland CR, Goel A. MiR-320e is a novel prognostic biomarker in colorectal
cancer. Br J Cancer. 2015;113:83–90.
Ma Y, Zhang P, Wang F, Zhang H, Yang J, Peng J, Liu W, Qin H. miR-150 as
a potential biomarker associated with prognosis and therapeutic outcome
in colorectal cancer. Gut. 2012;61:1447–53.
Karaayvaz M, Zhai H, Ju J. miR-129 promotes apoptosis and enhances
chemosensitivity to 5-fluorouracil in colorectal cancer. Cell Death Dis.
2013;4:e659.
Pizzini S, Bisognin A, Mandruzzato S, Biasiolo M, Facciolli A, Perilli L, Rossi E,
Esposito G, Rugge M, Pilati P, et al. Impact of microRNAs on regulatory
networks and pathways in human colorectal carcinogenesis and
development of metastasis. BMC Genomics. 2013;14:589.
Perilli L, Vicentini C, Agostini M, Pizzini S, Pizzi M, D'Angelo E, Bortoluzzi S,
Mandruzzato S, Mammano E, Rugge M, et al. Circulating miR-182 is a biomarker
of colorectal adenocarcinoma progression. Oncotarget. 2014;5:6611–9.
Grassi A, Perilli L, Albertoni L, Tessarollo S, Mescoli C, Urso EDL, Fassan M,
Rugge M, Zanovello P. A coordinate deregulation of microRNAs expressed
in mucosa adjacent to tumor predicts relapse after resection in localized
colon cancer. Mol Cancer. 2018;17:17.
Wei Q, Lei R, Hu G. Roles of miR-182 in sensory organ development and
cancer. Thorac Cancer. 2015;6:2–9.
Zhang Y, Wang X, Wang Z, Tang H, Fan H, Guo Q. miR-182 promotes cell
growth and invasion by targeting forkhead box F2 transcription factor in
colorectal cancer. Oncol Rep. 2015;33:2592–8.
Yang MH, Yu J, Jiang DM, Li WL, Wang S, Ding YQ. microRNA-182 targets
special AT-rich sequence-binding protein 2 to promote colorectal cancer
proliferation and metastasis. J Transl Med. 2014;12:109.
Perilli et al. BMC Cancer
(2019) 19:821
25. Cekaite L, Rantala JK, Bruun J, Guriby M, Agesen TH, Danielsen SA, Lind GE,
Nesbakken A, Kallioniemi O, Lothe RA, Skotheim RI. MiR-9, −31, and −182
deregulation promote proliferation and tumor cell survival in colon cancer.
Neoplasia. 2012;14:868–79.
26. Dalerba P, Guiducci C, Poliani PL, Cifola I, Parenza M, Frattini M, Gallino G,
Carnevali I, Di Giulio I, Andreola S, et al. Reconstitution of human
telomerase reverse transcriptase expression rescues colorectal carcinoma
cells from in vitro senescence: evidence against immortality as a
constitutive trait of tumor cells. Cancer Res. 2005;65:2321–9.
27. Indraccolo S, Minuzzo S, Masiero M, Pusceddu I, Persano L, Moserle L,
Reboldi A, Favaro E, Mecarozzi M, Di Mario G, et al. Cross-talk between
tumor and endothelial cells involving the Notch3-Dll4 interaction marks
escape from tumor dormancy. Cancer Res. 2009;69:1314–23.
28. Serafin V, Persano L, Moserle L, Esposito G, Ghisi M, Curtarello M, Bonanno L,
Masiero M, Ribatti D, Sturzl M, et al. Notch3 signalling promotes tumour
growth in colorectal cancer. J Pathol. 2011;224:448–60.
29. Pasto A, Serafin V, Pilotto G, Lago C, Bellio C, Trusolino L, Bertotti A, Hoey T,
Plateroti M, Esposito G, et al. NOTCH3 signaling regulates MUSASHI-1
expression in metastatic colorectal cancer cells. Cancer Res. 2014;74:2106–18.
30. affyQCReport: QC Report Generation for affyBatch objects. R package version
1.48.0.
31. Gautier L, Cope L, Bolstad BM, Irizarry RA. Affy--analysis of Affymetrix
GeneChip data at the probe level. Bioinformatics. 2004;20:307–15.
32. Ritchie ME, Phipson B, Wu D, Hu Y, Law CW, Shi W, Smyth GK. Limma
powers differential expression analyses for RNA-sequencing and microarray
studies. Nucleic Acids Res. 2015;43:e47.
33. Huang d W, Sherman BT, Lempicki RA. Systematic and integrative analysis of
large gene lists using DAVID bioinformatics resources. Nat Protoc. 2009;4:44–57.
34. Chou CH, Chang NW, Shrestha S, Hsu SD, Lin YL, Lee WH, Yang CD, Hong HC,
Wei TY, Tu SJ, et al. miRTarBase 2016: updates to the experimentally validated
miRNA-target interactions database. Nucleic Acids Res. 2016;44:D239–47.
35. Agarwal V, Bell GW, Nam JW, Bartel DP. Predicting effective microRNA target
sites in mammalian mRNAs. Elife. 2015;4:1–38.
36. Erol A. Deciphering the intricate regulatory mechanisms for the cellular
choice between cell repair, apoptosis or senescence in response to
damaging signals. Cell Signal. 2011;23:1076–81.
37. Krishnan K, Steptoe AL, Martin HC, Wani S, Nones K, Waddell N,
Mariasegaram M, Simpson PT, Lakhani SR, Gabrielli B, et al. MicroRNA-182-5p
targets a network of genes involved in DNA repair. Rna. 2013;19:230–42.
38. Liu B, Liu Y, Zhao L, Pan Y, Shan Y, Li Y, Jia L. Upregulation of microRNA-135b
and microRNA-182 promotes chemoresistance of colorectal cancer by
targeting ST6GALNAC2 via PI3K/AKT pathway. Mol Carcinog. 2017;56:2669–80.
39. Jia L, Luo S, Ren X, Li Y, Hu J, Liu B, Zhao L, Shan Y, Zhou H. miR-182 and
miR-135b mediate the tumorigenesis and invasiveness of colorectal Cancer
cells via targeting ST6GALNAC2 and PI3K/AKT pathway. Dig Dis Sci. 2017;62:
3447–59.
40. Salvador JM, Brown-Clay JD, Fornace AJ Jr. Gadd45 in stress signaling, cell
cycle control, and apoptosis. Adv Exp Med Biol. 2013;793:1–19.
41. Li X, Tian R, Gao H, Yang Y, Williams BRG, Gantier MP, McMillan NAJ, Xu D,
Hu Y, Gao Y. Identification of a histone family gene signature for predicting
the prognosis of cervical cancer patients. Sci Rep. 2017;7:16495.
42. Huang J, Gong Z, Ghosal G, Chen J. SOSS complexes participate in the
maintenance of genomic stability. Mol Cell. 2009;35:384–93.
Publisher’s Note
Springer Nature remains neutral with regard to jurisdictional claims in
published maps and institutional affiliations.
Page 13 of 13