tiểu luận kinh tế lượng the impact of air pollution indicators and GDP per capita on human’s life expectancy in 2015
Bạn đang xem bản rút gọn của tài liệu. Xem và tải ngay bản đầy đủ của tài liệu tại đây (599.52 KB, 26 trang )
TRƯỜNG ĐẠI HỌC NGOẠI THƯƠNG
ESSAY
ECONOMETRICS
The impact of air pollution indicators and GDP per capita on
human’s life expectancy in 2015
Class: KTEE218 (1-1718).1_LT
Lecturer: PhD. Vũ Thị Phương Mai
Group 10 members
Ngô Minh Ngọc
Student ID
1614450039
Đỗ Minh Ngọc
1614450038
Nguyễn Hồng Nhung
1614450041
Trần Lâm Oanh
1614450043
Hanoi , 2017
1
INDEX
Abstract .............................................................................................................. 4
1
THEORETICAL FRAMEWORK............................................................. 6
1.1 Life expectancy .................................................................................... 6
1.1.1
Definition ..................................................................................... 6
1.1.2
Measure ....................................................................................... 6
1.1.3
Situation ....................................................................................... 6
1.2 GDP (Gross Domestic Product) and GDP per capita ...................... 7
1.2.1
Definition ..................................................................................... 7
1.2.2
Components ................................................................................. 7
1.2.3
The effect of GDP per capita on life expectancy: ....................... 7
1.3 Air pollution ......................................................................................... 9
2
1.3.1
Defintion of pollution ................................................................... 9
1.3.2
Definition of air pollution ............................................................ 9
1.3.3
The situation of air pollution ....................................................... 9
1.3.4
The effect of air pollution on life expectancy ............................ 10
BUILD THE MODEL ............................................................................. 12
2.1 Methodology of the study ................................................................. 12
2.2 Theoretical modeling ........................................................................ 12
2.2.1
Determine the model type .......................................................... 12
2.2.2
Explain the variables ................................................................. 12
2.3 Describe the data ............................................................................... 13
2.3.1
Data source ................................................................................ 13
2.3.2
Statistical description ................................................................ 13
2.3.3
Correlation matrix between variables ....................................... 14
2
3ESTABLISHMENT AND STATISTICAL DIMENSION ..................... 16
3.1 Estimate model ..................................................................................16
3.2 Hypothesis Testing ............................................................................16
3.2.1 Are the results consistent with the theory? ................................16
3.2.2
Are the regression coefficients statistically significant? ...........17
3.2.3
Validation of model ...................................................................17
3.3 Recommendations, Solutions ...........................................................18
CONCLUSION .............................................................................................. 20
REFERENCES............................................................................................... 21
GUIDELINES FOR USING MODEL......................................................... 21
APPENDIX – DATA TABLE (Source: World Bank 2015) ......................22
3
Abstract
Life expectancy is regarded as one of many noteworthy indicators in measuring a
nation’s well-being. Researches in the last decades have presented several factors that
make great impacts on human’s life duration. In the context of highly development in
globalization, industrialization, and the like, GDP per capita and air pollution have proven
to possess significant influence.
It is unavoidable that industrialization and modernization cause environmental
pollution. Air pollution, as a part of it, brings about negative effects on human’s health.
Recently, the air pollution index has witnessed a dramatic increase. As a result, the number
of people catching respiratory diseases rose and the expectation of life changed. Never
before has the need of profound insight about the relationship between air pollution and
life duration been more essential.
In addition, another reason for the change in life expectancy is the fluctuation of
GDP per capita. Although constant efforts of government in health care service are beyond
doubt, healthcare benefits have not yet reached every single individual. On the basis of
variation in personal income, different individuals possess different capabilities of
affording medical care. As a consequence, there exist gaps in people’s mortal ages, which
make impacts on average longevity as a whole. This means that GDP per capita plays a
decisive part in affecting human life expectancy.
Due to justifications mentioned above, it is imperative for us to arm ourselves with
more profound understanding about the influence of air pollution and GDP per capita to
average life expectancy.
In hope of providing a deeper insight, scrutinizing a specific case as well as finding
the most ultimate and radical solutions, the editorial group would like to take the topic
“The impact of air pollution indicators and GDP per capita on human’s life
expectancy in 2015” in thorough consideration. This essay aims at evaluating the impact
of GDP per capita and air pollution levels of 180 random nations all over the world. In the
end, we are bound to achieve an objective look into the issue as well as apply appropriate
measures to make progress in practicing health care tasks.
This
essay includes the following content:
Abstract
Literature review
Research results:
Chapter 1: Theoretical framework
Chapter 2: Building model
Chapter 3: Estimation result and statistical inference
4
Last but not least, due to the limited amount of time as well as some certain limits
in understanding and data collecting, the essay may hardly avoid mistakes. The editorial
group is always willing to receive feedback from readers so as to complete the essay to the
fullest.
Many thanks!
5
1
THEORETICAL FRAMEWORK
1.1 Life expectancy
1.1.1 Definition
Life expectancy is a statistical measure of the average time an organism is expected
to live, based on the year of their birth, their current age and other demographic factors
including sex.
1.1.2 Measure
The most commonly used measure of life expectancy is at birth (LEB), which can
be defined in two ways:
Cohort LEB is the mean length of life of an actual birth cohort (all individuals born
a given year) and can be computed only for cohorts born many decades ago, so that
all their members have died.
Period LEB is the mean length of life of a hypothetical cohort assumed to be
exposed, from birth through death, to the mortality rates observed at a given year.
1.1.3 Situation
Life expectancy at birth reflects the overall mortality level of a population. It
summarizes the mortality pattern that prevails across all age groups in a given year
– children and adolescents, adults and the elderly. Global life expectancy at birth in
2015 was 71.4 years (73.8 years for females and 69.1 years for males), ranging
from 60.0 years in the WHO African Region to 76.8 years in the WHO European
Region, giving a ratio of 1.3 between the two regions. Women live longer than men
all around the world. The gap in life expectancy between the sexes was 4.5 years in
1990 and had remained almost the same by 2015.
Global average life expectancy increased by 5 years between 2000 and 2015, the
fastest increase since the 1960s. Those gains reverse declines during the 1990s,
when life expectancy fell in Africa because of the AIDS epidemic, and in Eastern
Europe following the collapse of the Soviet Union. The 2000-2015 increase was
greatest in the WHO African Region, where life expectancy increased by 9.4 years
to 60 years, driven mainly by improvements in child survival, and expanded access
to antiretrovirals for treatment of HIV.
6
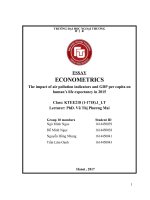
Graph 1: Human life expectancy at birth, measured by region, between 1950 and 2050
1.2 GDP (Gross Domestic Product) and GDP per capita
1.2.1 Definition
Gross domestic product (GDP) is the monetary value of all the finished goods and
services produced within a country's borders in a specific time period.
Per capita GDP is a measure of the total output of a country that takes gross
domestic product (GDP) and divides it by the number of people in the country.
1.2.2 Components
GDP (Y) is the sum of consumption (C), investment (I), government spending (G)
and net exports (X – M).
Y=C+I+G+(X−M)
1.2.3 The effect of GDP per capita on life expectancy:
7
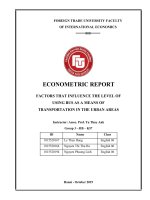
Graph 2: Plot of life expectancy vs. GDP per capita in 2009
The data for this graph is available from the Index Mundi website. The data is from
2003.
The graph shows that life expectancy at birth, increases at a decreasing rate with
respect to GDP per capita (PPP).
The main reason for this non-linear relationship is because people consume both
needs and wants. People consume needs in order to survive. Once a person’s needs are
satisfied, they could then spend the rest of their money on non-necessities. If everyone’s
needs are satisfied, then any increase in GDP per capita would barely affect life
expectancy.
GDP per capita isn't the only thing that affects life expectancy. Government
intervention can also affect it. A nation could be rich, but if its government ignores the
plight of the poor, it could lower the life expectancy.
Another reason for the wide variation in the life expectancies for countries with low
GDP per capita would be due to the level of non-market economic activity. For example, if
there is a lot of subsistence farming, people could be working and have enough food to eat,
but wouldn’t be contributing much to the nation’s GDP because they wouldn’t be buying
the food they eat, or selling the food they grow i.e. no exchange of money.
The relationship between life expectancy and GDP per capita is strong enough to
be the basis of a regression model. Simple functions that increase at a decreasing rate
include multiplicative (hyperbolas) and logarithmic functions.
8
1.3 Air pollution
1.3.1 Defintion of pollution
Pollution is the introduction of contaminants into the natural environment that
causes adverse change. Pollution can take the form of chemical substances or energy, such
noise, heat or light. Pollutants, the components of pollution, can be either foreign
substances/energies or naturally occuring contaminants. Pollution is often classed as point
source or nonpoint source pollution.
A point source of pollution is a single indentifiable source of air, water, thermal,
noise or light pollution. A point source has negligible extent, distinguishing it from other
pollution source geometries. The sources are called point sources because in mathematical
modeling, they can be approximated as a mathematical point to simplify analysis. Pollution
point sources are identical to other physics engineering, optics, and chemistry point
sources and include:
Air pollution from an industrial source
Water pollution from an oil refinery wastewater discharge outlet
Noise pollution form a jet engine
Disruptive seismic vibration from a localized seismic study
Light pollution from an intrusive street light
Thermal pollution from an industrial process outfall
Radio emissions from an interference-producing electrical device
Nonpoint source (NPS) pollution is a term used to describe pollution resulting from
many diffuse sources, in direct contrast to point source pollution which results from a
single source. Nonpoint source pollution generally results from land runoff, precipitation,
atmospheric deposition, drainage, seepage, or hydrological modification (rainfall or
snowmelt) where tracing the pollution back to a single source is difficult.
1.3.2 Definition of air pollution
Air pollution occurs when harmful substances including particulates and biological
molecules are introduced into Earth's atmosphere. It may cause diseases, allergies or death
of humans; it may also cause harm to other living organisms such as animals and food
crops, and may damage the natural or built environment. Human activity and natural
processes can both generate air pollution.
1.3.3 The situation of air pollution
Air pollution is a significant risk factor for a number of pollution-related diseases
and health conditions including respiratory infections, heart disease, stroke and lung
cancer. The health effects caused by air pollution may include difficulty in breathing,
wheezing, coughing, asthma and worsening of existing respiratory and cardiac conditions.
These effects can result in increased medication use, increased doctor or emergency room
visits, more hospital admissions and premature death. The human health effects of poor air
9
quality are far reaching, but principally affect the body's respiratory system and the
cardiovascular system. The most common sources of air pollution include particulates,
ozone, nitrogen dioxide, and sulphur dioxide. Children aged less than five years that live in
developing countries are the most vulnerable population in terms of total deaths
attributable to indoor and outdoor air pollution.
The World Health Organization estimated in 2014 that every year air pollution
causes the premature death of some 7 million people worldwide. India has the highest
death rate due to air pollution. India also has more deaths from asthma than any other
nation according to the World Health Organization. In December 2013 air pollution was
estimated to kill 500,000 people in China each year. There is a positive correlation between
pneumonia-related deaths and air pollution from motor vehicle emissions.
Annual premature European deaths caused by air pollution are estimated at
430,000. An important cause of these deaths is nitrogen dioxide and other nitrogen oxides
emitted by road vehicles. In a 2015 consultation document the UK government disclosed
that nitrogen dioxide is responsible for 23,500 premature UK deaths per annum. Across the
European Union, air pollution is estimated to reduce life expectancy by almost nine
months. Causes of deaths include strokes, heart disease, COPD, lung cancer, and lung
infections.
Urban outdoor air pollution is estimated to cause 1.3 million deaths worldwide per
year. Children are particularly at risk due to the immaturity of their respiratory organ
systems.
Air pollution costs the world economy $5 trillion per year as a result of
productivity losses and degraded quality of life, according to a joint study by the World
Bank and the Institute for Health Metrics and Evaluation (IHME) at the University of
Washington.These productivity losses are caused by deaths due to diseases caused by air
pollution. One out of ten deaths in 2013 was caused by diseases associated with air
pollution and the problem is getting worse. The problem is even more acute in the
developing world. "Children under age 5 in lower-income countries are more than 60 times
as likely to die from exposure to air pollution as children in high-income countries." The
report states that additional economic losses caused by air pollution, including health costs
and the adverse effect on agricultural and other productivity were not calculated in the
report, and thus the actual costs to the world economy are far higher than $5 trillion.
The air pollution effects have been becoming more and more alarming year by year.
Governments and individuals should take drastic measures to mitigate this global
challenge.
1.3.4 The effect of air pollution on life expectancy
10
Graph 3: The Effect of Air Pollution Control on Life Expectancy in the United States: An Analysis
of 545 US counties for the period 2000 to 2007
(Source: />Above is one example of the effect of air pollution control on life expectancy. Data on air
pollution and life expectancy from 545 U.S. counties in 2000 and 2007 show that recent
declines in PM2.5 to relatively low levels continue to prolong life expectancy in the US.
These benefits are largest among the most urban and densely populated counties. These
associations were estimated controlling for socioeconomic and demographic variables as
well proxy variables for and direct measures of smoking prevalence.
11
2
BUILD THE MODEL
2.1 Methodology of the study
First of all, our group sets the hypothesis for the research question, "The impact of
air pollution indicators and GDP per capita on human’s life expectancy in 2015."
Why should this stage require a full review of the scope, nature, substance,
environment and condition of the subject, and relationships in the process of
mobilization?
Build econometric models: From theoretical basis to the mathematical model and
statistical models to find out the most suitable one.
The team collected sample and estimated values based on data from 180
observations in 2015 from 180 countries. For quantitative results, the number of
outputs should be equal to the number of inputs, which is the data collected by the
statistical method. As a result, the team selected information and checked the
statistical significance of the regression coefficients and the suitability of the model
based on the observed observations comparing with the previous research and
similar studies, to find the best results to use for analysis.
During the course of the project, the team used the knowledge of econometrics and
macroeconomics, quantitative methods with the main support of STATA software,
Microsoft Excel, Microsoft Word for synthesis and completion of this essay.
2.2 Theoretical modeling
In order to construct an econometric model, it is first necessary to identify the
factors that are involved in the interaction and description of economic variables. In order
to obtain the results of the computation and analysis of the output, the statistical method
used in the two fields is the estimation and verification of the hypothesis.
Thus, in order to analyze the factors influencing the human’s life expectancy, the
group used the regression analysis model to show the trend of variable in terms of the
average of the sample. With the specimen, the regression function is a function with
specific numerical, computational, and differential values such as derivatives, differential
and direct meaning analysis.
2.2.1 Determine the model type
Dependent variable: LE
Independent variable includes 2 variables: GPC, AP
Regression model:
LE = 0 + 1.GPC + 2.AP + 2.2.2 Explain the variables
12
Variables
Meaning
Unit
LE
Life expectancy
year
GPC
GDP per capita
USD
AP
Air pollution PM2.5, mean
annual exposure
microgram per cubic meter
Based on the sample regression function, the slope indicated in the sample, when the independent
variables GPC and AP were simultaneously 0, the mean dependent
variable LE was
̂̂
β.
0
̂̂
term shows in the sample, where the independent
The slope β
i
variables change by one unit, the mean dependent variable varies βi unit.
̂̂
2.3 Describe the data
2.3.1 Data source
Variables
LE
GPC
AP
Link
/> /> />
2.3.2 Statistical description
Before analyzing the data, the team will describe the data to give the reader the
most general view of the collected data sets. This explains some of the errors encountered
when running the model due to a data error.
As stated in the theoretical part, the data set consists of three variables. The group
will then provide a description of each variable in the model.
Describing data using des, we obtain the following results:
. des
Contains data from C:\Users\Laptop Hp\Desktop\KTL1 GK\Data World Bank 2015.dta
obs:
vars:
size:
180
3
6 Dec 2017 21:18
1,260
storage
display
value
variable name
type
format
label
gpc
float
%8.0g
GPC
ap
le
int
byte
%8.0g
%8.0g
AP
LE
variable label
Sorted by:
13
Continue using the sum statement to describe the data, the “sum” command shows
the number of observations (Obs), the average value (Mean), standard deviation (Std.dev.)
as well as the maximum value (Max) and the minimum value (Min) of the variables.
.
sum le gpc ap
Variable
Obs
Mean
le
180
71.53333
gpc
ap
180
180
12571.48
28.34444
Std. Dev.
Min
Max
8.035814
51
84
17599.25
19.77875
303.7
3
101909.8
107
The standard deviation of variable LE is 8.035814. It can be seen that data with
relatively high standard deviation, high level of dispersion, show that the difference
in life expectancy across countries is relatively high. Rich countries, developed
countries often have a high average life expectancy (over 80 years), mainly in the
Americas and Europe, while those in Asia and Africa are developing countries,
with the average longevity of usually around 60-70 years.
The standard deviation of variable GPC is 17599.25. We can see that the data has a
very high standard deviation, which shows that the gap in average income between
countries is very large. This is understandable because there is a marked difference
in the level of economic development among nations. GDP per capita income of the
Americas and Europe is often much higher than that of Asian and African
countries.
The mean value of 28.34444 indicates that the level of pollution is mild (the safe
level is 25) and the standard deviation is 19.77875. Countries with severe levels of
pollution are often poor, developing countries in Asia, Africa (eg, Qatar: 107,
Buhtan: 56, India: 74, Nigeria: 38, Ethiopia: 36), whereas in developed countries in
Europe and America, pollution levels are very low (USA: 8, Australia: 6, Sweden:
13, New Zealand: 6).
2.3.3 Correlation matrix between variables
Before running the regression model, we consider the correlation between variables
using the “corr” command. We obtained the correlation table between the variables as
follows:
. corr le gpc ap
(obs=180)
le
le
1.0000
gpc
ap
0.6124
-0.3224
gpc
ap
1.0000
-0.2312
1.0000
14
Conclusion:
The variable GPC correlates with LE relatively high. The GPC variable has a
negative correlation coefficient, indicating the opposite effect on the dependent variable.
The AP variable has a positive correlation coefficient, which shows the same effect on the
dependent variable.
The correlation coefficient between the LE and the GPC is 0.6124, showing that
each positive relationship, ie, as the average income increases, the average life expectancy
is also increasing, because when income increases, People will pay more for health care
and health care than before, and as gross national income increases, government will spend
more on public services, especially health services and environmental protection, thereby
limiting the cancer and other health problems to people, improving life expectancy. The
correlation coefficient between LE and GPC was high (0.6124) indicating that each
correlation was quite close between average income and life expectancy.
The correlation coefficient between LE and AP is -0.3224 indicating the inverse
relationship, ie when the level of pollution increases, the average life expectancy
decreases. This is true because the greater the pollution, the higher the cancer rate, leading
to higher mortality, lower life expectancy. In the developing world, the level of pollution is
always high, plus the low level of health care services is the main reason for the low life
expectancy in these countries.
The correlation coefficient between GPC and AP is -0.2312, indicating the opposite
relationship, as the average income increases, the level of pollution increases as well,
which represents the tradeoff between industrial development and environmental pollution.
The relatively small correlation coefficient (-0.1878) indicates that the correlation between
the two variables is relatively small (loosely), because there are many other causes of
environmental pollution.
From the above analysis, it can be seen that independent variables correlate with
the dependent variable, and between the independent variables also correlate. Furthermore,
no correlation coefficients greater than 0.8 were observed, so this model was not affected
by multi-collinearity.
1
5
3
ESTABLISHMENT AND STATISTICAL DIMENSION
3.1 Estimate model
To run the regression model, we execute the “regress” command as follows:
.
regress le gpc ap
Source
Model
Residual
Total
le
gpc
ap
_cons
SS
4733.59357
6825.20643
11558.8
Coef.
df
MS
Number of obs
=
180
F(2, 177)
=
61.38
Prob > F
=
0.0000
R-squared
=
0.4095
Adj R-squared
=
0.4029
179 64.5743017
Root MSE
=
6.2097
Std. Err.
t
P>|t|
[95% Conf. Interval]
2 2366.79679
177 38.5604883
.0002594
.0000271
9.57
0.000
.0002059
.0003129
-.0776155
70.47188
.0241202
.9515858
-3.22
74.06
0.002
0.000
-.1252156
68.59397
-.0300154
72.34979
From the above table, we have the sample regression equation:
LE = 70.47188 + 0.0002594 GPC – 0.0776155 AP
2
The coefficient of determination: R = 0.4095 means that the independent variables
in the model account for 40.95% of the variation in the value of the dependent variable and
the remaining depends on other factors.
Meaning of estimation coefficients:
1
= 0.0002594 > 0 means that when the GPC increases to 1$ USD, the human’s life expectancy will increase to 0.02594% holding other factors constant.
2 = -0.0776155 < 0 means that when air pollution level increases to 1 microgram per cubic meter, the human’s life expectancy will decrease 7.76155%
holding other factors constant.
3.2 Hypothesis Testing
3.2.1 Are the results consistent with the theory?
We can see that following the theory, we have:
- If the GDP per capita increases, the human’s life expectancy will increase.
- If the air pollution increases, the human’s life expectancy will decrease.
Follow the analysis, β1 > 0, β2 < 0. Therefore, all the results are suitable with the theory.
Problem 1: With a significance level of α = 5%, is the regression coefficient of the
GPC variable actually greater than 0?
Hypothetical pair:
H0: βGPC ≤ 0
16
H1: βGPC> 0
p-value (βGPC) = 5.54 x 10⁻⁷ <α should reject H0.
CONCLUSION: With a significance level of α = 5%, the regression coefficient of
the GPC variable is actually greater than 0.
Problem 2: With the significance level α = 5%, is the regression coefficient of the
variable AP actually less than 0?
Hypothetical pair:
H0: βAP ≥ 0
H1: βAP <0
p-value (βAP) = 0.0486 <α should reject H0.
CONCLUSION: With a significance level of α = 5%, the regression coefficient of
the real AP variable is less than 0.
3.2.2 Are the regression coefficients statistically significant?
Based on the p-value of regression coefficients, 1 and 2 were statistically significant (p-value <0.05).
Problem 1: With the significance level α = 5%, is the regression coefficient of the
GPC variable really different from zero?
Hypothetical pair:
H0: βGPC = 0
H1: βGPC ≠ 0
p-value (βGPC) = 5.54 x 10⁻⁷ <α should reject H0.
CONCLUSION: With a significance level of α = 5%, the regression coefficient of
the GPC variable is really different.
Problem 2: With a significance level of α = 5%, is the regression coefficient of the
AP variable really different from zero?
Hypothetical pair:
H0: βAP = 0
H1: βAP ≠ 0
p-value (βAP) = 0.0486 <α should reject H0.
CONCLUSION: With a significance level of α = 5%, the regression coefficient of
the AP variable is actually different.
3.2.3 Validation of model
With a significance level of α = 5%, is the model appropriate?
Hypothetical pair:
H0: βGPC = βAP = 0
2
2
H1: β GPC + β AP ≠ 0
p-value (F (2,47)) = 2.01 x 10⁻⁷ <α should reject H0.
CONCLUSION: With a significance level α = 5%, the model is consistent.
17
3.3 Recommendations, Solutions
In this industrial age, air pollution cannot be eliminated completely, but steps can
be taken to reduce it. The government has developed, and continues to develop, guidelines
for air quality and ordinances to restrict emissions in an effort to control air pollution.
Firtsly, countries should pursue policies to control more effectively air pollution
and particulate matter, from stationary and mobile sources in their countries in order to
achieve environmentally acceptable levels of ambient air quality and deposition of
pollutants.
Secondly, nations should achieve this objective by an appropriate combination of
some or all of the following means:
More efficient use of energy;
The use of less-polluting fossil fuels;
Increased use of non-fossil energy sources, to the extent that these are compatible
with other policy goals;
The use of newer and environmentally more benign combustion technologies;
Stricter control of air pollutant emissions.
Thirdly, that actively encouraging internationally co-ordinated research and
development aimed at a better understanding of atmospheric processes and effects of air
pollution on man and the environment, and at improving technologies for fossil fuel
combustion and control of pollutant emissions is highly recommended.
Moreover, cutting edge technology should be applied into manufacturing and
processing wastes.
There are also many ways to increase GDP per capita.
Enforce the law and make sure courts are independent of the government. Rule of
law provides an indicator of economic development. Investors like to put their
money in countries where the governments protect private property and resolve
legal disputes fairly. It makes it easier to do business if management does not have
to worry that a local government will take over the company, capriciously tax
earnings or arrest the company's employees. Countries put themselves at an
economic disadvantage if they project hostility to foreign investment.
Allow other countries to invest in yours. Many American companies maintain
brand presence all over the world. But the U.S. also tops the list of nations that
others invest in, according to "The World Factbook" of the Central Intelligence
Agency. A comparison of leaders in allowing foreign investment shows that these
countries enjoy strong economies.
Educate the population. The Organization for Economic Cooperation and
Development publishes rankings comparing economic and educational
performance. Most of the top economies, including Japan, Germany and Korea,
also score highest in education, especially for science and math.
Get rid of corruption. Transparency International, an anti-corruption watchdog
group, produces an index of how corrupt countries are, based on perceptions
revealed in extensive polling. Costs associated with corruption, such as bribes and
18
legal fees, increase the cost of doing business. The index counts many of the
world's poorest countries, including Angola and North Korea, among the most
corrupt.
Let people vote, and conduct fair elections. During the 20th century, nearly all of
the most developed nations economically had democratic political systems. China
in the late 20th and early 21st centuries may seem an exception to this, but if we
look at overall quality of life, all of the most prosperous countries are democratic,
according to Joel Kotkin, who writes the "New Geographer" column at "Forbes"
magazine's website.
Education: The quality of education for citizens in a country has a large effect on
GDP, which affects the income per capita. Countries that increase the quality and
availability of education can increase their national economic production. For
example, when a country has a larger population of engineers designing new
products for sale in the technology market, that country's national production
output is greater than a country that relies mainly on rural agriculture and
construction. Highly educated populations contribute more to their economy,
driving GDP and increasing income per capita.
Consumption: Consumer consumption drives the total economic output of a
country, which increases income per capita. National populations that spend more
on goods and services benefit the GDP. To increase income per capita, consumer
spending should be encouraged. For instance, when interest rates are lowered by
the federal government, consumers use their credit to purchase more goods and
services. Any action that encourages spending -- be it discounts, tax breaks or other
incentives -- increases GDP and income per capita.
Exports: Part of the GDP for a country is calculated by adding the total exports for
the year. All products that a country produces for sale to other countries are
considered exports. For instance, Japan exports vehicles for consumers in the
United States to purchase. Every Japanese vehicle purchased by a United States
consumer adds to the GDP of the Japanese economy, which consequently increases
per capita income. Increasing the number of exports directly increases income per
capita.
Government Spending: A government can increase the GDP of its country by
spending more money inside of the country. Any money spent on infrastructure,
government programs or subsidies has the potential to increase GDP and per capita
income. For instance, when the government orders fighter planes for use in the
military, defense and aeronautical contractors receive money for their work,
increasing GDP. Every plane built by a contractor is a product added to national
economic output.
If there were more time, our group would like to research more about how to
increase GDP per capita and human’s life expectancy as well as reduce air pollution
considerably.
19
CONCLUSION
Within the scope of the essay, the team examined the effect of GDP per capita and
the level of air pollution on average life expectancy of people in countries. According to
the model, GDP per capita and the level of air pollution are statistically significant in the
model.
The relation between GDP per capita and average life expectancy is positive. If
GDP per capita increased, the average life expectancy would increase followingly.
The relation between the level of air pollution and life expectancy is negative. If the
level of air pollution increases, the average life expectancy decreases followingly.
This essay is completed under the contribution of members with knowledge gained
from the study, research and study of econometrics. By doing this essay, we can better
understand the process of running the econometric model, analyzing, verifying the fit of
the model and the relationship between variables in the model. In addition, we can apply
the knowledge learned and through the econometric model analysis to draw useful
conclusions about socio-economic problems and phenomena.
We would like to thank Ms Vu Thi Phuong Mai for her guidance and suggestions to
help us understand the problem and analyze in the right direction. However, due to the first
time the essay was made, inevitabley such shortcomings as not being able to survey all
countries in the world have not explained the impact of other variables on life expectancy
(diet, work pressure of each industry, the use of stimulants, the effects of social evils). We
would like to receive your comments and comments to improve the essay.
We sincerely thank you!
20
REFERENCES
Air pollution statistics
/>Brunekreef B. Air pollution and life expectancy: is there a relation? Occupational and
Environmental Medicine. 1997
Damodar N. Gujarati and Dawn C.Porter, Basic Econometrics, 5th edition
Daniel A. Vallero, 2007, Fundamentals of air pollution
Kenneth Wark, Cecil Francis Warner, 1976, Air pollution, its origin and control
Kulkarni S, Lavin-Rector A, Ezzati M, Murray CJ. Falling behind: life expectancy in U.S.
counties from 2000 to 2007 in an international context. Population Health Metrics. 2011
Life expectancy at birth versus GDP per capita (PPP) />
Peng RD, Dominici F. Statistical methods for environmental epidemiology in R: a case study in air
pollution and health. Springer; 2008
Pope CA, III, Ezzati M, Dockery D. Fine-particulate air pollution and life expectancy in the
United States. New England Journal of Medicine. 2009
Pr. Ph.D Nguyen Quang Dong and vPr. Ph.D Nguyen Thi Minh, 2015, Econometrics textbook,
Publisher of National Economics University
Shrestha LB. Life expectancy in the United States. CRS Report for Congress. 2005
The Effect of Air Pollution Control on Life Expectancy in the United States: An Analysis of 545 US
counties for the period 2000 to 2007
/>
GUIDELINES FOR USING MODEL
Des
Sum
Corr le gpc ap
Regress le gpc ap
21
APPENDIX – DATA TABLE (Source: World Bank 2015)
No.
1
2
3
4
5
6
7
8
9
10
11
12
13
14
15
16
17
18
19
20
21
22
23
24
25
26
27
28
29
30
31
32
33
34
35
36
37
Countries
Afghanistan
Albania
Algeria
Angola
Antigua and Barbuda
Argentina
Armenia
Australia
Austria
Azerbaijan
Bahamas, The
Bahrain
Bangladesh
Barbados
Belarus
Belgium
Belize
Benin
Bhutan
Bolivia
Bosnia and Herzegovina
Botswana
Brazil
Brunei Darussalam
Bulgaria
Burkina Faso
Burundi
Cabo Verde
Cambodia
Cameroon
Canada
Central African Republic
Chad
Chile
China
Colombia
Comoros
GDP per capita
584.0
3,954.0
4,132.8
3,695.8
13,566.9
13,467.1
3,609.7
56,554.0
43,665.0
5,500.3
22,888.1
22,688.9
1,210.2
15,557.8
5,949.1
40,356.9
4,850.0
783.9
2,613.6
3,077.0
4,574.1
6,532.1
8,757.2
30,967.9
6,993.5
615.6
303.7
2,954.1
1,163.2
1,244.4
43,315.7
348.4
777.2
13,653.2
8,069.2
6,044.5
727.6
Air pollution
48
18
36
36
14
13
26
6
17
30
14
55
89
15
20
16
27
35
56
28
47
18
11
5
28
40
46
40
29
66
7
46
46
21
58
18
17
Life expectancy
63
78
76
61
76
76
74
82
82
72
75
77
72
76
74
81
70
61
70
69
77
66
75
77
74
60
57
72
68
58
82
51
53
79
76
74
63
22
38
39
40
41
42
43
44
45
46
47
48
49
50
51
52
53
54
55
56
57
58
59
60
61
62
63
64
65
66
67
68
69
70
71
72
73
74
75
76
77
Congo, Dem. Rep.
Congo, Rep.
Costa Rica
Cote d'Ivoire
Croatia
Cuba
Cyprus
Czech Republic
Denmark
Djibouti
Dominican Republic
Ecuador
Egypt, Arab Rep.
El Salvador
Equatorial Guinea
Estonia
Ethiopia
Fiji
Finland
France
Gabon
Gambia, The
Georgia
Germany
Ghana
Greece
Grenada
Guam
Guatemala
Guinea
Guinea-Bissau
Guyana
Haiti
Honduras
Hungary
Iceland
India
Indonesia
Iran, Islamic Rep.
Iraq
474.9
1,712.1
11,406.4
1,420.6
11,579.7
7,602.3
23,075.1
11,556.9
53,014.6
1,862.2
6,468.5
3,547.7
4,127.1
10,347.3
17,074.9
645.5
4,921.9
42,405.4
36,526.8
7,389.0
474.7
3,764.6
3,764.6
41,176.9
1,361.1
18,007.8
9,212.2
35,439.5
3,923.6
554.0
596.9
4,136.7
814.5
2,326.2
12,365.6
50,734.4
1,613.2
3,336.1
4,957.6
4,974.0
46
53
20
24
22
18
18
21
11
52
20
13
105
37
47
9
36
8
7
12
40
61
20
14
23
13
15
7
35
23
33
17
26
38
23
8
74
15
43
52
59
64
80
53
77
80
80
79
81
62
74
76
71
73
58
77
65
70
81
83
66
61
73
81
62
82
73
79
73
59
57
67
63
73
76
83
68
69
76
70
23
78
79
80
81
82
83
84
85
86
87
88
89
90
91
92
93
94
95
96
97
98
99
100
101
102
103
104
105
106
107
108
109
110
111
112
113
114
115
116
117
Ireland
Israel
Italy
Jamaica
Japan
Jordan
Kazakhstan
Kenya
Kiribati
Korea, Rep.
Kuwait
Kyrgyz Republic
Lao PDR
Latvia
Lebanon
Lesotho
Liberia
Lithuania
Luxembourg
Macedonia, FYR
Madagascar
Malawi
Malaysia
Maldives
Mali
Malta
Mauritania
Mauritius
Mexico
Micronesia, Fed. Sts.
Moldova
Mongolia
Montenegro
Morocco
Mozambique
Myanmar
Namibia
Nepal
Netherlands
New Zealand
60,664.1
35,729.4
30,049.1
4,966.0
34,474.1
4,096.1
10,510.0
1,350.0
1,424.5
27,105.1
28,975.4
1,121.1
2,159.4
13,666.6
8,046.6
1,073.8
452.0
14,252.4
101,909.8
4,834.1
401.9
362.7
9,643.6
8,395.8
729.7
23,819.5
1,158.3
9,252.1
9,143.1
3,016.0
1,832.5
3,944.2
6,461.2
2,847.3
528.3
1,194.6
4,737.7
743.8
44,292.9
38,201.9
10
21
20
17
13
39
20
16
3
29
67
17
33
20
33
25
8
19
17
40
20
26
16
29
44
16
85
15
20
8
21
24
23
23
20
54
21
75
15
6
82
82
83
76
84
74
72
67
66
82
75
71
66
74
79
54
62
75
82
76
66
63
75
77
57
82
63
74
77
69
71
69
77
76
58
66
64
70
82
81
24
118
119
120
121
122
123
124
125
126
127
128
129
130
131
132
133
134
135
136
137
138
139
140
141
142
143
144
145
146
147
148
149
150
151
152
153
154
155
156
157
Nicaragua
Niger
Nigeria
Norway
Oman
Pakistan
Panama
Paraguay
Peru
Philippines
Poland
Portugal
Qatar
Romania
Russian Federation
Rwanda
Samoa
Sao Tome and Principe
Saudi Arabia
Senegal
Serbia
Seychelles
Sierra Leone
Singapore
Slovak Republic
Slovenia
Solomon Islands
Somalia
South Africa
South Sudan
Spain
Sri Lanka
St. Lucia
St. Vincent and the Grenadines
Sudan
Suriname
Swaziland
Sweden
Switzerland
Tajikistan
2,096.0
359.0
2,655.2
74,505.2
16,627.4
1,431.2
13,134.0
4,109.4
6,030.3
2,878.3
12,566.0
19,220.0
66,346.5
8,958.8
9,329.3
710.3
4,149.4
1,624.6
20,732.9
908.7
5,237.3
15,390.0
587.5
53,629.7
16,089.7
20,729.9
1,922.0
426.0
5,769.8
758.7
25,683.8
3,844.9
8,076.1
6,739.6
2,513.9
8,819.0
3,136.9
50,585.3
80,989.8
918.7
27
63
38
9
53
65
13
15
28
23
24
10
107
20
17
50
4
14
106
38
21
13
19
19
21
20
7
20
30
32
10
28
14
14
50
18
22
6
13
50
75
60
53
82
77
66
78
73
75
69
78
82
78
75
71
67
75
66
75
67
75
73
51
83
77
81
70
56
62
56
83
75
75
73
64
71
57
83
83
71
25