tiểu luận kinh tế lượng the factors affecting weekly working time in 1975
Bạn đang xem bản rút gọn của tài liệu. Xem và tải ngay bản đầy đủ của tài liệu tại đây (1.51 MB, 41 trang )
CONTENT
CONTENT.......................................................................................................1
INTRODUCTION...........................................................................................5
PART 1: DATA DESCRIPTION....................................................................6
I. GENERAL DATA DESCRIPTION......................................................6
II.
DATA DESCRIPTION IN DETAILS............................................... 8
1. Time worked per week in 1975..........................................................8
2. Age in 1975.......................................................................................... 9
3. Educational level in 1975....................................................................9
4. Health status in 1975........................................................................ 10
5. Gender............................................................................................... 11
6. Marital status in 1975.......................................................................11
7. Time of sleeping per week in 1975...................................................12
PART 2: REGRESSION ANALYSIS..........................................................13
I. THE RELATIONSHIP BETWEEN VARIABLES –
STATISTICAL CORRELATION............................................................ 13
II.
ESTIMATE THE REGRESSION MODEL BY OLS METHOD 14
1. Population regression function........................................................ 14
2. Sample regression function................................................................. 14
3. Analysis of Parameters in the Sample Regression Model.............14
III. MISTAKE TESTS OF THE MODEL............................................ 15
1. Testing multicollinearity...................................................................15
2. Testing heteroskedasticity................................................................ 16
3. Cure for heteroskedasticity..............................................................17
IV.
HYPOTHESES TESTS....................................................................17
1. Testing overall significance of the regression................................. 17
2. Testing significance of the regression coefficients..........................18
3. Testing exclusion restricstions......................................................... 20
PART 3: CONSTRUCTING FINAL REGRESSION MODEL................22
I. ESTIMATE THE REGRESSION MODEL BY OLS METHOD .. 22
1. Population regression function........................................................ 22
1
2. Sample regression function.............................................................. 22
3. Analysis of parameters in the sample regression model................22
II.
MISTAKE TESTS OF THE MODEL............................................ 23
1. Testing multicollinearity...................................................................23
2. Testing heteroskedasticity................................................................ 24
3. Cure for heteroskedasticity..............................................................24
III. HYPOTHESES TESTS....................................................................25
1. Testing the overall significance of regression................................. 25
2. Testing the significance of the regression coefficients....................25
CONCLUSION..............................................................................................27
APPENDIX....................................................................................................28
1. Result of using command ‘tab totwrk75’.........................................28
2. Result of using command ‘tab slpnap75’........................................ 34
2
TABLE OF FIGURES
Figure 1: The result of using command 'des'......................................................................... 6
Figure 2: The result of using command 'des' for variables chosen........................................ 7
Figure 3: The result of using command 'sum'........................................................................8
Figure 4: The result of using command 'tab totwrk75' (full version in appendix)..............8
Figure 5: The result of using command 'tab age75'............................................................... 9
Figure 6: The result of using command 'tab educ75'........................................................... 10
Figure 7: The result of using command 'tab gdhlth75'.........................................................10
Figure 8: The result of using command 'tab male75'...........................................................11
Figure 9: The result of using command 'tab marr75'........................................................... 11
Figure 10: The result of using command 'tab slpnap75' (full version in appendix)..........12
Figure 11: The result of using command ‘corr’ in STATA.................................................. 13
Figure 12: The result of using command 'reg' in STATA (6 variables)................................14
Figure 13: The result of using command 'vif' after using 'reg' in STATA............................15
Figure 14: The result of using 'imtest, white' in STATA......................................................16
Figure 15: The result of using command robust in STATA................................................. 17
Figure 16: The result of command 'test' (after using robust)............................................... 17
Figure 17: The result of using command 'reg' (2 variables).................................................20
Figure 18: The result of using command 'test' for 4 variables above - after robust.............21
Figure 19: The result of using command 'reg' after omitting 4 variables............................ 22
Figure 20: The result of using 'corr' with 3 variables...........................................................23
Figure 21: The result of using command 'vif' after 'reg totwkr75 male slpnap75'...............23
Figure 22: The result of using command ‘imtest, white’ for new function.........................24
Figure 23: The result of using 'reg robust'........................................................................... 24
Figure 24: The result of using command’ test male slnap’..................................................25
3
AKNOWLEDGEMENT
The success and final outcome of this assignment required a lot of support
from others, and we are extremely fortunate to have this all along the completion of
our work. We would like to express our gratitude to Mrs. Dinh Thi Thanh Binh, our
Econometrics lecturer, for excellent expertise and supportive guidance she provided
us throughout the process. Without such help, we might not have been able to
complete this assignment so far.
We are really grateful as we managed to complete the assignment on time,
which could not be done without the effort and co-operation from our group
members. Last but not least, we would like to thank all of our friends for their nice
support and willingness to spend some time helping us finishing the documents.
Group 11
4
INTRODUCTION
Researches have shown that various factors have influences on the working
time of labor. For instance, older workers tend to work less time than younger ones.
The same thing happens to female workers who are married and have a family to
take care of. And for each person, the influences of these factors are different.
Therefore, after taking everything into consideration, we decided to choose
and study the project: “The factors affecting weekly working time in 1975”. Thus
through our project, we analyze the factors that have major impact on the working
time of labor in 1975, using the econometric methods. Econometrics is a social
science in which tools of economic, mathematical, and statistical theories are used
to estimate economic relationships, testing economic theories, and evaluating and
implementing government and business policy. It is based upon the development of
statistical methods to forecast economic issues.
In this paper, we consider six factors that may affect staffs’ weekly working
time: age, educational level, health status (good or poor), gender (male or female),
marital status (married or single), time of sleeping.
Throughout the project, we used STATA as the tool for econometrics analysis
to analyze the data set “11.DTA”.
We hope that arguments and statistics in this project will be helpful for
anyone who is interested in the topic stated.
5
PART 1: DATA DESCRIPTION
I.
GENERAL DATA DESCRIPTION
1. Chosen Variables for Research
We obtained the following result by using command ‘des’
o b s :
v a r s :
2 3 9
2 0
s i z e :
6,214
1 7
s t o r a g e
v a r i a b l e
n a m e
d i s p l a y
v a l u e
l a b e l
A u g
1999
v a r i a b l e
22:56
t y p e
f o r m a t
a g e 7 5
b y t e
% 9 . 0 g
a g e
e d u c 7 5
b y t e
% 9 . 0 g
y e a r s
e d u c
i n
' 7 5
e d u c 8 1
b y t e
% 9 . 0 g
y e a r s
e d u c
i n
' 8 1
g d h l t h 7 5
b y t e
% 9 . 0 g
=
g d h l t h 8 1
b y t e
% 9 . 0 g
= 1
m a l e
b y t e
% 9 . 0 g
= 1
m a r r 7 5
b y t e
% 9 . 0 g
=
m a r r 8 1
b y t e
% 9 . 0 g
= 1
s l p n a p 7 5
i n t
% 9 . 0 g
m i n s
s l p
w k ,
i n c
n a p s ,
' 7 5
s l p n a p 8 1
i n t
% 9 . 0 g
m i n s
s l p
w k ,
i n c
n a p s ,
' 8 1
t o t w r k 7 5
i n t
% 9 . 0 g
m i n u t e s
w o r k e d
p e r w e e k ,
' 7 5
t o t w r k 8 1
i n t
% 9 . 0 g
m i n u t e s
w o r k e d
p e r w e e k ,
' 8 1
y n g k i d 7 5
b y t e
% 9 . 0 g
=
y n g k i d 8 1
b y t e
% 9 . 0 g
= 1
c e d u c
b y t e
% 9 . 0 g
c h a n g e
i n
c g d h l t h
b y t e
% 9 . 0 g
c h a n g e
i n
g d h l t h
c m a r r
b y t e
% 9 . 0 g
c h a n g e
i n
m a r r
c s l p n a p
i n t
% 9 . 0 g
c h a n g e
i n
s l p n a p
c t o t w r k
i n t
% 9 . 0 g
c h a n g e
i n
t o t w r k
c y n g k i d
b y t e
% 9 . 0 g
c h a n g e
i n
y n g k i d
i n
1
i f
g o o d
i f
g o o d
i f
m a l e
1
i f
i f
1
l a b e l
1975
h l t h
h l t h
m a r r i e d
m a r r i e d
i f
i f
c h i l d
c h i l d
i n
i n
i n
<
<
' 7 5
i n ' 8 1
3 ,
3 ,
' 7 5
' 8 1
' 7 5
' 8 1
e d u c
Figure 1: The result of using command 'des'
The data set was created on August 18, 1999, containing 20 variables, 239
observations.
After considering the meaning of variables in file 11.dta, our group decided to
choose following variables as variables in regression model:
Dependent variable: totwrk75
Independent variables: age75, educ75, gdhlth75, male, marr75, slpnap75.
2. General Description of Chosen Data
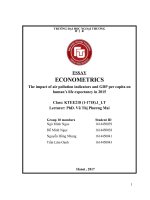
We obtained the following result by using command ‘des’ for variables analyzed:
6
Figure 2: The result of using command 'des' for variables chosen
From the above result, we can see that age75, educ75 and, slpnap75, totwrk75
are quantitative variables and gdhlth75, male, marr75 are qualitative variables.
Here is the variables explanation in detail:
Variables
Display Format
Meaning
Unit
totwrk75
%9.0 g
Time worked per week in 1975
Minute
age75
%9.0 g
Age in 1975
Year
educ75
%9.0 g
Years of education
Year
gdhlth75
%9.0 g
= 1 if in good health in 1975
Male
%9.0 g
= 1 if male
marr75
%9.0 g
= 1 if married in 1975
slpnap75
%9.0 g
Time of sleeping per week, including
naps
Minute
Using command ‘sum totwrk75 age75 educ75 gdhlth75 male marr75 slpnap75’,
we can know the number of observations and the mean, standard deviation, min,
max of each variables (age75, educ75, gdhlth75, male, marr75, slpnap75,
totwrk75)
7
.
sum totwrk75 age75 educ75 gdhlth75 male marr75 slpnap75
Variable
Obs
Mean
Std. Dev.
Min
Max
totwrk75
239
2184.205
922.632
0
4805
age75
educ75
gdhlth75
male
marr75
239
239
239
239
239
39.01255
13.10879
.8828452
.6025105
.748954
11.06683
2.858844
.3222796
.4904058
.4345249
23
1
0
0
0
65
17
1
1
1
slpnap75
239
3369.665
502.8366
2053
6110
Figure 3: The result of using command 'sum'
II.
DATA DESCRIPTION IN DETAILS
To describe variables in details, we used command ‘tab’ for each variable:
1. Time worked per week in 1975
Figure 4: The result of using command 'tab totwrk75' (full version in appendix)
8
Minutes of working time per week starts from 0 to 4805. The most frequent is 0
minute, with 10 observations, accounted for 4.18%. Followed by is 2325 minutes,
with 4 observations, accounted for 1.67%
2. Age in 1975
Figure 5: The result of using command 'tab age75'
Age of workers in 1975 varies from 23 years old to 65 years old. The most
frequent age is 33 years old, with 14 observations, accounted for 5.8%. The least
frequent age are 49, 63, and 64 years old, with only 1 observation for each,
accounted for 0.42%.
3. Educational level in 1975
9
Years of education starts from 1 to 17. Twelve years of education has the highest
number of observations (with 98 observation, accounted for 41%), while 1 year of
education has the lowest (with 1 observation, accounted for 0.42%)
Figure 6: The result of using command 'tab educ75'
4. Health status in 1975
Figure 7: The result of using command 'tab gdhlth75'
-
Variable gdhlth = 1 if good health in 1975 has 211 observations, accounted
for 88.28%
-
Variable gdhlth = 0 if poor health in 1975 has 28 observations, accounted for
11.72%
10
5. Gender
-
Variable male = 1 if male has 144 observations, accounted for 60.25%
-
Variable male = 0 if female has 95 observations, accounted for 39.75%
Figure 8: The result of using command 'tab male75'
6. Marital status in 1975
Figure 9: The result of using command 'tab marr75'
-
Variable marr75 = 1 if maried in 1975 has 179 observations, accounted for
74.9%
-
Variable marr75 = 0 if single in 1975 has 60 observations, accounted for
25.1%
11
7. Time of sleeping per week in 1975
Minutes of sleeping per week, including naps, starts from 2053 to 6110. The most
frequent are 3195, 3353, and 3518 minutes, with 3 observations for each, accounted
for 1.26%.
Figure 10: The result of using command 'tab slpnap75' (full version in appendix)
12
PART 2: REGRESSION ANALYSIS
I.
THE RELATIONSHIP BETWEEN VARIABLES – STATISTICAL
CORRELATION
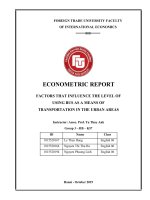
Figure 11: The result of using command ‘corr’ in STATA
The correlation between dependent variable totwrk75 and others independent
variables (age75, educ75, gdhlth75, male, marr75, slpnap75) are different. Its
interval is from |r(totwrk75, slpnap75)| = 0.3538 to |r(totwrk75, slpnap75)| =
0.0813
r(totwrk75, age75) = -0.1327. That means totwrk75 and age75 have negative
correlation. Sign is expected to be negative.
r(totwrk75, educ75) = 0.0813. That means totwk75 and educ75 have positive
correlation. Sign is expected to be positive.
r(totwrk75, gdhlth75) = 0.1555. That means totwk75 and gdhlth75 have
positive correlation. Sign is expected to be positive.
r(totwrk75, male) = 0.3822. That means totwk75 and male have positive
correlation. Sign is expected to be positive.
r(totwrk75, marr75) = 0.1042. That means totwk75 and marr75 have positive
correlation. However, sign is expected to be negative.
r(totwrk75, slpnap75) = -0.3538. That means totwk75 and slpnap75 have
negative correlation. Sign is expected to be negative.
13
II.
ESTIMATE THE REGRESSION MODEL BY OLS METHOD
1. Population regression function
(PRF): totwrk75 =
1
age75 –
2
educ75 +
3
slpnap75 +
gdhlth75 +
0
4
male +
5
marr75 +
6
+u
The variable u, called error term or disturbance in the relationship, represents
factors other than age75, educ75, gdhlth75, male, marr75, slpnap75 that affect
totwrk75.
2. Sample regression function
By using STATA, we have the following result:
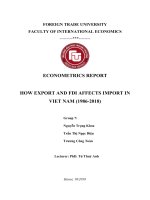
Figure 12: The result of using command 'reg' in STATA (6 variables)
From the above result, we obtain the estimated regression function:
̂
(SRF): = – 8,061648 age75 –19.7368 educ75 + 231.5114 gdhlth75 +
670.8464 male – 25.161marr75 – 0.5949014 slpnap75 + 4172.318
3. Analysis of Parameters in the Sample Regression Model
F (6, 232) = 14.32 and Prob > F = 0.0000 are the evidence that at least one of the
independent variables (age75, educ75, gdhlth75, male, marr75, slpnap75) help
to explain the dependent variable (totwrk75).
14
Coefficient of determination (R-squared = 0.2702) is interpreted as the fraction of
the sample variation in y that is explained by x. In this model, age75, educ75,
gdhlth75, male, marr75, slpnap75 can explain 27.02% of the variation in
totwrk75.
̅̅
Adjusted R-squared (2 = 0.2513) increases when a group of variables is added
R
to a regression if, and only if, the F statistic for joint significance of the new
variables
is
greater
than
unity.
We
use
̅̅2
to
R
decide
whether
a certain
independent variable (or set of variables) should or should not belongs in a model.
Total sum of squares (TSS = 202597441) is a measure of the total sample
variation in the yi.
Explained sum of squares (ESS = 54744508.5) measures sample variation in the
̂̂yi.
Residual sum of squares (RSS = 147852932) measures the sample variation in the ̂ui.
III. MISTAKE TESTS OF THE MODEL
1. Testing multicollinearity
1.1. Correlation matrix
The correlation matrix (image 11) shows that there is no |rij| ( i = 1,6 , j = 1,6 ) greater than 0,8; therefore, multicollineary does not exist.
1.2. Variance inflation factors (VIF) method
Figure 13: The result of using command 'vif' after using 'reg' in STATA
As VIF(i) < 10 ( i= 1,6), we can conclude that multicollineary does not exist.
15
2. Testing heteroskedasticity
Figure 14: The result of using 'imtest, white' in STATA
From the above result, we could reject H0 at = 5% because Prob>chi2 = 0,0127 <
= 0,05; which means heteroskedasticity exists in this model.
16
3. Cure for heteroskedasticity
To deal with heteroskedasticity, we run robust:
Figure 15: The result of using command robust in STATA
IV. HYPOTHESES TESTS
1. Testing overall significance of the regression
:̂= ̂ =̂=̂=̂=̂=
(
= )
Hypothesis: {
Figure 16: The result of command 'test' (after using robust)
Since Prob > F = 0,0000 < α = 0.05, we reject H0, accept H1. There is insufficient
sample evidence to claim that H0 is true, that is, the regression function is relevant.
17
2. Testing significance of the regression coefficients
:
Hypothesis: {
=
:
( = , )
≠
( = , )
If P-value < α = 0.05, reject H 0, accept H1, has statistically significant effect on
time of working per week. The numbers we used on the second column (P > |t|) is
based on image 5 (The result of using robust in STATA).
Coefficients
P > |t|
Conclusion
Reject
̂̂
H0, accept H1, intercept
has statistically significant effect on
totwrk75.
̂̂
̂̂
= 4172.318
0.000 < α = 0.05
= 4172.318 means that the a
0
person’s working time per week is
4172.318 minutes on average if others
independent variables are equal 0,
ceteris paribus.
= – 8.061648
̂̂
0,137 > α = 0,05
Fail to reject H0, age75 does not
have statistically significant effect on
totwrk75.
= – 19.7368
̂̂
0,314> α = 0,05
Fail to reject H0, educ75 does not
have statistically significant effect on
totwrk75.
̂̂
= 231.5114
0,233 > α = 0,05
Fail to reject H0, gdhlth75 does not
have statistically significant effect on
totwrk75.
Reject H0, male has statistically
̂̂
= 670.8464
0,000 < α = 0,05
significant effect on totwrk75.
18
̂̂
4
= 670.8464 means that male’s
working time is 670.8464 minutes on
average higher than female, ceteris
paribus.
̂̂
= – 25.161
0,838 > α = 0,05
Fail to reject H0, marr75 does not
have statistically significant effect on
totwrk75.
Reject H0, slpnap75 has statistically
significant effect on totwrk75.
̂̂
̂̂
= –0.594901
0,000 < α = 0,05
6
= –
additional
0.5949014 means that
minutes of
sleeping
corresponds to a decrease in working
time per week of 0.5949014 minutes,
ceteris paribus.
In conclusion, only male and slnap75 has statistically significant effect on
totwrk75 at 5% level.
19
3. Testing exclusion restricstions
From the above analysis, age75, educ75, gdhlth75, marr75 can be omitted. In
this step, we are testing multiple linear restriction with those variables (q=4). It
means we are constructing a regression function with two variables: slpnap75 and
male.
Figure 17: The result of using command 'reg' (2 variables)
:̂=̂=̂=̂=
Hypothesis: {
Here are the two models we need to consider:
̂
(UR):
= 4172,318 − 8,061648 − 19,7368 + 231,5114 + 670,8464 − 25,161
−
(R):
̂
= 3816,693 + 678,3548
0,5949014
− 0,6057587
When using STATA to test this hypothesis, we see the result:
20
Figure 18: The result of using command 'test' for 4 variables above - after robust
Since F = 1.02 < F0,05(4,232) = 2,41, we cannot reject H0. Therefore, age75, educ75,
gdhlth75, marr75 have no effect on totwrk75 after male and slpnap75 have been
controlled for and therefore should be excluded from the model.
21
PART 3: CONSTRUCTING FINAL
REGRESSION MODEL
I.
ESTIMATE THE REGRESSION MODEL BY OLS METHOD
1. Population regression function
PRF: totwrk75 =
0+
1 male
+
2 slpnap75 +
u
The variable u, called error term or disturbance in the relationship, represents
factors other than male, slpnap75 that affect totwrk75.
2. Sample regression function
By using STATA, we have the following result:
. r e g
t o t w r k 7 5 m a l e
S o u r c e
s l p n a p 7 5
S S
d f
M S
N u m b e r
F (
M o d e l
R e s i d u a l
51587935.2
151009506
t o t w r k 7 5
m a l e
s l p n a p 7 5
_ c o n s
202597441
C o e f .
678.3548
-.6057587
3816.693
2 ,
40.31
0.0000
=
0.2546
R - s q u a r e d =
0.2483
P r o b
2 3 6
639870.787
R - s q u a r e d
S t d .
851249.752
E r r .
t
R o o t
P > | t |
2 3 9
=
25793967.6
2 3 8
o b s =
236) =
2
A d j
T o t a l
o f
>
F
M S E
[95%
=
799.92
C o n f . I n t e r v a l ]
105.9596
6.40
0.000
469.6072
887.1023
.1033402
-5.86
0.000
-.8093457
-.4021717
361.8439
10.55
0.000
3103.837
4529.55
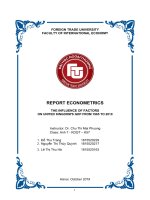
Figure 19: The result of using command 'reg' after omitting 4 variables
From the above result, we obtain the estimated regression function:
SRF:
̂
= 3816.693 + 678.3548
− 0.6057587
3. Analysis of parameters in the sample regression model
F (6, 232) = 40.31 and Prob > F = 0.0000 are the evidence that at least one of the
independent variables (male, slpnap75) help to explain the dependent variable
(totwrk75)
Coefficient of determination (R-squared = 0.2546) is interpreted as the fraction of
the sample variation in y that is explained by x. In this model, male, slpnap75
can explain 25.46% of the variation in totwrk75. New regression model’s Rsquared is smaller than the previous model’s.
22
̅̅
Adjusted R-squared (2 = 0.2483) increases when a group of variables is added
to a regression if, and only if, the F statistic for joint significance of the new
variables is greater than unity. We use
̅̅2
to decide whether a certain
independent variable (or set of variables) should or should not belongs in a model.
Total sum of squares (TSS = 202597441) is a measure of the total sample
variation in the yi.
Explained sum of squares (SSE = 51587935.2) measures sample variation in the
̂.
Residual sum of squares (SSR = 151009506) measures the sample variation in
the ̂ .
II.
MISTAKE TESTS OF THE MODEL
1. Testing multicollinearity
1.1. Correlation matrix
Figure 20: The result of using 'corr' with 3 variables
The above matrix shows that there is no |rij| ( i = 1,3 , j = 1,3 ) greater than 0,8; therefore, multicollineary does not exist.
1.2.
Variance Inflation factors (VIF) method
Figure 21: The result of using command 'vif' after 'reg totwkr75 male slpnap75'
As VIF(i) < 10 ( i= 1,3), we can conclude that multicollineary does not exist.
23
2. Testing heteroskedasticity
Figure 22: The
result of using command ‘imtest, white’ for new function
From the above result, we could reject H0 at = 5% because Prob>chi2=0.0120< =
0.05; which means heteroskedasticity exists in this model.
3. Cure for heteroskedasticity
To deal with heteroskedasticity, we run robust:
Figure 23: The result of using 'reg robust'
24
III. HYPOTHESES TESTS
1. Testing the overall significance of regression
̂
̂
:= =
Hypothesis: {
̂
:∃ ≠
( = , )
Figure 24: The result of using command’ test male slnap’
Since Prob>F = 0,0000 < α = 0.05, we reject H 0, accept H1. There is insufficient
sample evidence to claim that H0 is true, that is, at least one of the independent
variables can help to explain the dependent variable. In conclusion, the regression
has overall significance.
2. Testing the significance of the regression coefficients
:
Hypothesis: {
:
=
≠
If P-value < α = 0.05, reject H 0, accept H1, has statistically significant effect on
time of sleeping per week.
Coefficients
P > |t|
Conclusion
̂̂
Reject H0, accept H1, intercept
statistically
significant
effect
totwrk75.
̂̂
= 3816.693
0.000 < α = 0.05
have
on
̂̂
0= 3816.693
means that the a person’s
working time per week is 3816.693
minutes on average if others independent
variables are equal 0, ceteris paribus.
25