tiểu luận kinh tế lượng ANALYSIS OF THE DETERMINANTS INFLUENCING THE STATISTICS AND PROBABILITY SCORES OF ECONOMICS STUDENTS
Bạn đang xem bản rút gọn của tài liệu. Xem và tải ngay bản đầy đủ của tài liệu tại đây (308.93 KB, 36 trang )
FOREIGN TRADE UNIVERSITY
FACULTY OF INTERNATIONAL ECONOMICS
-------------------------
ECONOMETRICS REPORT
---------------------------------------------
ANALYSIS OF THE DETERMINANTS INFLUENCING
THE STATISTICS AND PROBABILITY SCORES OF
ECONOMICS STUDENTS
Class: Econometrics 1 - KTEE218.1
Lecturer: Dr. Nguyen Thuy Quynh
Group 10 : Tô Vũ Ý Nhi - 1814450061
Triệu Ngọc Mai - 1814450053
Nguyễn Minh Đức - 1814450019
Vũ Nam Khánh - 1814450045
Vũ Minh Hồng - 1816450041
Ha Noi- 09/2019
TABLE OF CONTENT
ABSTRACT
INTRODUCTION
3
4
I. Overview of the topic (Review of economic theories and statement of research
hypotheses)
1.Foundation for variables and model choosing
5
5
1.1Foundation of choosing variables
1.2Foundation of choosing models
2.Definitions
2.1 Statistics and Probability subject.
2.2 Advanced Mathematics in college.
2.3 Self-study.
2.4 Interest.
2.5 Attention focus.
2.6 Class contribution.
II. Model Specification
1.Literature review
5
6
6
6
7
7
7
8
8
8
8
2.Object
3.Constructing economics model
4.Specifying economics model
III. Estimated model and statistical inferences
1.Data overview
2.Estimation of econometrics model
3.Building the experimental model
4.Multicollinearity and heteroskedasticity testing
4.1. Multicollinearity Testing
4.2. Heteroscedasticity
5.Coefficients testing
5.1. P-value
5.2. Confidence Interval
5.3. t-value
SUGGESTION AND RECOMMENDATION
9
9
9
9
10
12
12
14
14
15
17
18
18
19
20
CONCLUSION
23
REFERENCE
24
APPENDIX
27
1
ABSTRACT
Statistics and Probability is a subject with a long history of development. The
subject has been acknowledged as one of the foundation subjects for first-year
economics students around the world because of its immense applicability.
Therefore, our group has decided to conduct in-depth research on the determinants
that influence the Statistics and Probability scores of economics students.
Our study consists of 5 factors that are presumed to shape Statistics and
Probability scores: Advanced Math scores, self-studying time per day, interest in the
subject, classroom participation and attention to the lesson. After analyzing data
running from STATA, it is concluded that only attention to the lesson does not leave
a strong impact on Statistics and Probability scores whereas the four remaining
factors do. At the end of the report, some resolutions and recommendations are
given to further assist in improving economics freshmen's Statistics and Probability
scores.
2
INTRODUCTION
There is a general consensus that leads to the difference in the performance
of economics students. Virtually all accredited business schools require their
students to take one or more courses in both mathematics and business statistics. In
addition, most introductory business statistics courses require one or more math
courses to provide the necessary mathematical foundation for statistics. However,
despite these prerequisite math courses, many students do poorly in their business
and economics statistics (hereafter, business statistics) course. It has even been
alleged that "…Business Statistics is the most hated, most unpopular course in the
business program." Potential reasons cited for poor student performance include
statistics anxiety, inadequate statistics instruction, inadequate math preparation
before matriculation and inadequate math prerequisites prior to taking the statistics
course.
In this study, we focus on the importance of math prerequisites for student
performance in the business statistics course. Specifically, we use an ordered probit
model to examine the relationship between alternative math course sequences and
the grades earned by students the first time they complete the business statistics
course. We then show how imposing a minimum grade requirement of C- for the
prerequisite math course would be expected to affect student performance in
business statistics.
Several studies have previously examined the impacts of mathematics skills
and topics on student performance in business statistics. To our knowledge,
however, this is the first study to examine the effect of alternative prerequisite math
course sequences on student performance. It is also the first study to demonstrate
3
the effect on student success in business statistics of imposing a minimum grade
requirement for the prerequisite math course.
I. Overview of the topic (Review of economic theories and statement of
research hypotheses)
1. Foundation for variables and model choosing
1.1. Foundation of choosing variables
Our assumption is that the Statistical and Probability Scores are affected by
the following variables: Advanced Math scores, self-studying time per day, interest
in the subject, classroom participation and attention to the lesson.
-
Advanced Math Score: Because Advanced Math includes the skills and
knowledge to study Statistics and Probability, we expect that higher scores in
Advanced Math with lead to higher scores in Statistical and Probability
scores
-
Self-study hours per day on Statistics and Probability subject: Self-study is a
great method that students can use to enhance their learning experience.
Using self-study, students can go beyond simply learning what their
textbooks and instructors teach. By practicing self-study, they are encouraged
to explore more topics that interest them, developing stronger research skills.
Therefore, the more time students spend self-study to review and practice the
subject, the higher their score will be.
-
Interested in the topic of Statistics and Probability: Because of interest in the
subject, students make more efforts to study or learn more about this topic.
Therefore, the higher the interest in Statistics and Probability, the higher the
score of this course.
-
Attention in class: It is believed that the more attention students pay for in
the lesson, the higher the score will be.
-
Class contribution: A successful lesson built on student contributions; In
addition, contributing to the lesson by asking questions requires students to
4
think logically and help them understand the lesson deeply. Therefore, the
more contributions a student has to make, the higher the subject score.
1.2.
-
Foundation of choosing models
Multiple regression model: is an extension of simple linear regression. It is
used when we want to predict the value of a variable based on the value of
two or more other variables. The variable we want to predict is called the
dependent variable (or sometimes, the outcome, target or criterion variable).
The variables we are using to predict the value of the dependent variable are
called the independent variables (or sometimes, the predictor, explanatory or
regressor variables) (statistics.laerd.com)
2. Definitions
2.1. Statistics and Probability subject.
Statistics are the study of a wide range of areas, including analysis,
interpretation, presentation and data organization. When applying statistics in
science, industry or social issues, it is usually starting with studying a
statistical overall or a statistical model.
The word probability is derived from the Latin word probate and
means "to prove, to verify". Put simply, probably is one of many words
referring to uncertain facts or knowledge, aimed at defining "ability". These
are two related but separate academic disciplines. Statistical analysis often
uses probability distributions, and the two topics are often studied together.
Learning about the probability we will work with tests, is considered to be
experimental, experimental, and random quantities, real-life random
processes. When solving a problem we often make assumptions, then we
need to see how much the assumption is true, then we have to perform the
test. The testing of such a hypothesis is called a statistical hypothesis test,
whose test results are calculated based on actual, calculated data.
5
2.2.
Advanced Mathematics in college.
Advanced math is a subject with a level of advanced than the type of
high school math that we have ever studied and it is intended for
undergraduate students. It is based on basic knowledge of general
mathematics such as spatial geometry, statistical probability or quantities in
mathematics and upgrades them to other tiers more difficult, so it is called
advanced mathematics. Advanced mathematics is a difficult subject that
requires students to study hard to be able to do their exercises. In fact,
advanced math is often used for business majors such as business
administration, finance goods, accounting …
2.3.
Self-study.
Self-studying is a learning method where students direct their own
studying—outside the classroom and without direct supervision. Since
students are able to take control of what (and how) they are learning, selfstudy can be a very valuable way for many students to learn. these methods
help students learn and retain information better, helping boost
comprehension, grades, and motivation.
Using self-study, students are able to go beyond simply learning what
their class textbooks and instructors teach them. By practicing self-study,
they are encouraged to further explore topics they are interested in,
developing stronger study skills as a result.
2.4.
Interest.
Interest is the state of wanting to know or learn about something or
someone. Interest in Statistics and Probability subject is the feeling of
wanting to pay more attention and time to learn or research about this
subject.
6
2.5.
Attention focus.
Paying attention means to listen to, watch, or consider something or
someone very carefully. That means students focus carefully on the Statistics
and probability lessons.
2.6.
Class contribution.
Class contribution is a combination of a combination of three modes
of assessment: individual assessments (a student's development and progress
during the term), comparative assessments (what members of the same
section, or class, demonstrate is possible), and contextual assessments (what
students whose work have been evaluated over the years suggests about the
full spectrum of class contribution performances). It is also defined as
regularly attending class not just for filling a seat.
II. Model Specification
1. Literature review
The purpose of the present study was to identify factors that may contribute
to economics students who are having difficulty in introductory and advanced
statistics courses.
Probability and statistics, the branches of mathematics concerned with the
laws governing random events, including the collection, analysis, interpretation, and
display of numerical data. Probability has its origin in the study of gambling and
insurance in the 17th century, and it is now an indispensable tool of both social and
natural sciences. Statistics may be said to have its origin in census counts taken
thousands of years ago; as a distinct scientific discipline, however, it was developed
in the early 19th century as the study of populations, economies, and moral actions
and later in that century as the mathematical tool for analyzing such numbers. For
technical information on these subjects, see probability theory and statistics.
7
2. Object
For economics students, countless factors influence the test score in
statistical and probability. Among the factors that stand out is the time to study the
subject yourself, the way you listen to the lectures of the teachers that must be
effective in the learning process and the score of the advanced mathematics.
Sometimes, students think that their self-study time is not suitable for test scores
because there is an injustice between students who have bad self-study and students
who have low self-study. So, we want to ask the question, "Whether or not all the
factors aforementioned affects how the score in Statistics and Probability subject of
economics students"
3. Constructing economics model
spscore =f (amscore, interest, class, study, attention)
in which:
amscore: Scores of the Advanced Math subject
interest: student’s interest in Statistics and Probability subject
class: Contribution to the Statistics and Probability classes
study: Self-study hours per day on Statistics and Probability subject
attention: attention paying to lecturers
4. Specifying economics model
scoreP = β0 + β1amscore + β2interest + β3class + β4study + β5attention + μ
In which β0 : is the intercept of the regression model
β
i
: is the slope coefficient of the independent variable
μ : is the disturbance of the regression model
III. Estimated model and statistical inferences
GPA or score is the biggest goal when a student decides to get the tertiary
level. It requires students to make their efforts in a long time. In the process, there
are the main factors affecting the GPA and their degree including good and bad
8
factors. In modern life, students are often distracted by several external factors
which have adverse affection on their studies. In fact, these factors are constantly
increasing. They affect the six factors mentioned above. However, a lot of
universities manage to avoid such situations. For example, in the period of 20072011 4,22% of students of Pedagogy University (Da Nang University) had average
results. Graduation results of the University of Foreign Language (Da Nang
University) had only 4,8% average students. At Da Nang University of Science and
Technology, course 2006-2011 graduated with 82% of graduates having good
degree or higher. At Duy Tan University, a number of students receiving good or
higher degrees accounted for 94,5%. Another example is the 58th school year
(2008-2012) of Hanoi National University of Education, among 1,547 students,
only 9 students graduated with an average degree (accounting for 0,58%). In
addition, Ho Chi Minh City University of Technology, the number of students
receiving good, excellent degree was 27,6%. As for Van Hien University, at the end
of 2012, graduation ceremony gave degrees to 1155 graduates, only 27 individuals
received excellent degree, 386 students received good, accounting for 36%. It is
clear that the GPA or Statistic and Probability Scores in FTU witnessed the change.
This reported is supposed to clarify this problem.
1. Data overview
-
This set of data is a primary one, as it is collected from our survey. We get
the data from our survey on FTU students and gain 150 qualified
observations after cleaning all sets of data.
-
We use des command to give a general description of the variables. The most
important information obtained after running des command is the meaning of
the variables. Here is the result that our group got when doing a statistic
description about the dependent variable and independent variables, by
running des command expressed as “des spscore amscore interest attention
study class”
9
variable name
storage type
display format value label
spscore
float
%8.0g
amscore
float
%8.0g
interest
byte
%8.0g
attention
byte
%8.0g
study
float
%8.0g
class
byte
%8.0g
variable label
We had a summarizing table based on the above result in the table:
Variables
Explanation
Type of variable
Format
spscore
Score of Statistics
and Probability
subject
Dependent variable
amscore
Scores of the
Advanced Math
subject
Independent variable Quantitative %8.0g
interest
Interest in Statistics
and Probability
classes
Independent variable Qualitative
(Dummy variable)
%8.0g
Class
Contribution to the
Statistics and
Probability Classes
Independent variable Qualitative
(Dummy variable)
%8.0g
study
Self-study hours per Independent variable Quantitative %8.0g
day on Statistics
and Probability
subject
attention
Attention paying on
the lectures
Quantitative %8.0g
Independent variable Qualitative
(Dummy variable)
10
%8.0g
The description: We run Sum command in Stata in order to get statistics
indicators of the variables.
After processing, the result we have:
In which:
Obsis the number of observations
Std.Dev is the standard deviation of the variable
Min is the minimum value of the variable
Max is the maximum value of the variable
variable
Obs
Mean
Std. Dev.
Min
Max
spscore
150
8.03
1.272093
6
10
amscore
150
7.36
1.455284
4
10
interest
150
0.56
0.498099
0
1
class
150
0.5333333
0.500559
0
1
study
150
0.4033333
0.3603534
0
2.5
2. Estimation of econometrics model
According to our hypothesis mentioned above: We expect β, β, β, β, β to
1
2
3
4
5
be positive (+).
3. Building the experimental model
3.1. Checking correlation among variables
First and foremost, we have to analyze the correlation of variables,
determining the correlation coefficients then specifically consider whether there is
multicollinearity among variables in the model. With usingCorrcommand in Stata,
we have:
(obs=150)
spscore
amscore
interest
attention
11
study
class
spscore
1.0000
amscore
0,7464
1.0000
interest
0,7519
0.4422
1.0000
attention
0,5217
0.7190
0.3310
1.0000
study
0,8153
0.6011
0.6028
0.4052
1.0000
class
0,7125
0.4901
0.5976
0.2811
0.5482
1.0000
The table illustrates that:
The correlation coefficient between spscoreand amscoreis: 0,7464
The correlation coefficient between spscoreandinterestis: 0,7519
The correlation coefficient betweenspscoreand attentionis: 0,5217
The correlation coefficient between spscoreand studyis: 0,8153
The correlation coefficient between spscoreand classis: 0,7125
From this statement, It can be easily seen that the correlation among
variables is less than 1 so that there is not a strong correlation among variables in
the model.
3.2. Regression run
With using Reg command in Stata, we have a sample regression model:
Source
SS
df
MS
Number of obs = 150
F(5, 144)
= 197.58
Prob > F
= 0.0000
R-squared
= 0.8728
Adj R-squared = 0.8684
Root MSE
= 0.46154
Model
210.44052
5
42.0881041
Residual
30.6744795
144
0.213017219
Total
241.115
149
1.61822148
Std. Err.
t
P>|t|
spscore
Coef.
[95% Conf. Interval]
amscore
0.2693326
0.0442672
6.08
0.000
0.1818351
0.3568301
interest
0.7293491
0.1044047
6.99
0.000
0.5229854
0.9357129
12
attention
0.0270072
0.1169929
0.23
0.818
-0.2042381
0.2582525
study
1.217141
0.1512262
8.05
0.000
0.918231
1.516051
class
0.5057395
0.1017541
4.97
0.000
0.3046149
0.7068642
_cons
4.869813
0.2761929
17.63
0.000
4.323897
5.415729
Analysis of regression coefficients:
β = 0.2693326: Other determinants are held constant. When the score of Advanced
1
Math (amscore) increases (decreases) by one score, the score of Statistics and
Probability increases (decreases) 0.2693326 score.
β = 0.7293491: Other determinants are held constant. Statistics and Probability
2
scores of students who have interest in this subject is higher by 0.2693326 than
those of students who do not have interest.
β = 1.217141: Other determinants are held constant. When the number of hours for
3
studying Statistics and Probability increases (decreases) by one hour, the score of
statistics and probability (spscore) increases (decreases) by 1.217141 score.
β = 0.3826367: Other determinants are held constant. Statistics and Probability
4
scores of students who pay attention to the lectures in this this subject is higher by
0.3826367 than those of students who do not pay attention.
β = 0.0270072 Ceteris paribus, Statistics and Probability scores of students who
5
contribute to classes in this this subject is higher by 0.0270072 than those of
students who do not contribute.
4. Multicollinearity and heteroskedasticity testing
4.1. Multicollinearity Testing
-
Using corr command:
amscore
amscore
1.0000
interest
0.4422
interest
attention
1.0000
13
study
class
attention
0.7190
0.3310
1.0000
study
0.6011
0.6028
0.4052
1.0000
class
0.4901
0.5976
0.2811
0.5482
1.0000
Based on the result, we can observe that the independent variables do not
correlate strongly with each other and there is no multicollinearity in the model.
-
Variance Inflation Factor (VIF)
Running vif command, we have the result:
Variable
VIF
1/VIF
amscore
2.90
0.344483
attention
2.12
0.471704
study
2.08
0.481412
interest
1.89
0.528741
class
1.81
0.551079
Mean VIF
2.16
Normally, if VIF > 10, there is multicollinearity. On the ground that VIF
value is low (VIF= 2.16 < 10) ->There is no multicollinearity.
4.2. Heteroscedasticity
Step 1:Run regression model
Source
SS
df
MS
Model
210.44052
5
42.0881041
Residual
30.6744795
144
0.21301721
9
Number of obs = 150
F(5, 144)
= 197.58
Prob > F
= 0.0000
R-squared
= 0.8728
Adj R-squared = 0.8684
Root MSE
= 0.46154
14
Total
241.115
149
1.61822148
spscore
Coef.
Std. Err.
t
P>|t|
amscore
0.2693326
0.0442672
6.08
0.000
0.1818351
0.3568301
interest
0.7293491
0.1044047
6.99
0.000
0.5229854
0.9357129
attention
0.0270072
0.1169929
0.23
0.818
-0.2042381
0.2582525
study
1.217141
0.1512262
8.05
0.000
0.918231
1.516051
class
0.5057395
0.1017541
4.97
0.000
0.3046149
0.7068642
_cons
4.869813
0.2761929
17.63
0.000
4.323897
5.415729
[95% Conf. Interval]
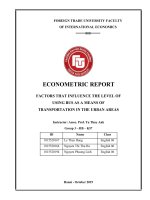
Step 2:Run rvfplot command
Based on the graph, the points do not distribute regularly, which is a sign of
possible Heteroscedasticity.
-
Apply White test:
Run imtest, white command, we have the result as following:
. imtest, white
White's test for Ho: homoskedasticity
against Ha: unrestricted heteroskedasticity
chi2(17) =
120.01
Prob > chi2 =
0.0000
Cameron & Trivedi's decomposition of IM-test
Source
Chi2
df
p
Heteroskedasticity
120.01
17
0.0000
Skewness
57.59
5
0.0000
Kurtosis
0.81
1
0.3684
total
178.41
23
0.0000
15
Prob (>chi2) = 0.0 < α = 0.05 so we do not accept H (homoscedasticity).
0
There is heteroskedasticity in this set of data.
5. Coefficients testing
Test each coefficient to know whether it is meaningful to the model, in other
words, we test the significance of each independent variable on the dependent one
(spscore). Two hypotheses for hypothesis testing:
5.1. P-value
If P-value of an independent variable is smaller than the confidence level, we
reject H0, accept H1 . It means this variable has significance on spscore.
Test for overall significance of β1:
Prob (β1) = 0.000 < 0.05, we cannot reject H0 at level of significance α = 5%.
Therefore, studyis statistically significant on spscore.
Test for overall significance of β2:
Prob (β2) = 0.000 < 0.05, we reject H0 at level of significance α = 5%. Therefore, β2
is statistically significant at 5%.
Test for overall significance of β3 :
Prob (β3) = 0.818 > 0.05, we do not reject H0 at level of significance α = 5%.
Therefore, β3 is not statistically significant at 5%.
Test for overall significance of β4 :
Prob (β4) = 0.000 < 0.05, we reject H0 at level of significance α = 5%. Therefore, β4
is statistically significant at 5%.
Test for overall significance of β5 :
Prob (β5) = 0.000 < 0.05, we reject H0 at level of significance α = 5%. Therefore, β5
is statistically significant at 5%.
In conclusion, attentiondoes not have significant impact on spscore, study,
interest, classand amscorehavesignificant impact on spscore.
5.2. Confidence Interval
16
Variables
Coefficient
Significant Level
Confidence Interval
const
B
0
5%
(4.323897;5.415729)
amscore
B1
5%
(0.1818351;0.3568301)
interest
B2
5%
(0.5229854;0.9357129)
attention
B
3
5%
(-0.2042381;0.2582525)
study
B4
5%
(0.918213;0.7068642)
class
B5
5%
(0.3046149;0.7068642)
For the all the coefficients, 0 doesn’t belong to the confidence interval, so we
reject the hypothesis H in the 5 pairs of hypothesis above. Therefore, the all the
0
coefficients are statistically significant with the confidence level of 95%.
5.3. t-value
Hypothesis Testing:
Variable
Coefficient
t
const
B0
17.63
amscore
interest
attention
study
class
B1
B2
B3
B4
B5
qs
6.08
6.99
0.23
8.05
4.97
t
t150
t150
t150
t150
t150
t150
Conclusion
0.025
0.025
0.025
0.025
0.025
0.025
=1.985
|t qs | > t150
=1.985
|t qs | > t150
=1.985
|t qs | > t150
=1.985
|t qs | > t150
=1.985
|t qs | > t150
=1.985
|t qs | > t150
For the all the coefficients, the result is |t
0.025
0.025
0.025
0.025
0.025
0.025
=1.984
=1.984
=1.984
=1.984
=1.984
=1.984
= 1,985, which means
qs | > t(150)
we reject H0: β i = 0 if i [1;5].
17
0.025
SUGGESTION AND RECOMMENDATION
As we can see from the results of analyzing these independent variables via
Stata application, we can conclude that all the variables exert a positive impact on
the dependent variable "Scores of Statistics and Probability". Therefore, to learn this
subject effectively, we would like to make some suggestions and recommendations
on how to deal with this subject.
Constructivism, a learning theory that asserts that learners construct their
understanding of a topic by building upon their prior knowledge. Implementing
active learning, therefore, means shifting the focus of instruction away from
knowledge transmission to learners' knowledge construction through the creation of
guided tasks, interactions, assignments, and environments that cultivate deep,
meaningful learning. Activities that foster knowledge construction requires students
to use critical and creative thought processes to generate their understanding.
Allowing students some flexibility in the outcomes of their work, and the means
they use to develop these outcomes provides them with opportunities to develop and
practice the thought processes that lead to the construction of knowledge. Virtually
all work in the real world is interdisciplinary, requiring people to blend content
knowledge and concepts from many disciplines to develop applications of
knowledge in new contexts. Interdisciplinary learning activities, therefore, provide
the greatest scope for students to develop the 21st Century competency of
knowledge construction in preparation for their entry into an economy in which
knowledge is a critical commodity.
Research shows that students learn better if they are engaged in, and
motivated to struggle with their learning. For this reason, if no other, students
appear to learn better if they work cooperatively in small groups to solve problems
and learn to argue convincingly for their approach among conflicting ideas and
18
methods. Small-group activities may inclusive groups of three or four students
working in class to solve a problem, discuss a procedure, or analyze a set of data.
Groups may also be used to work on an in-depth project outside of class. Group
activities provide opportunities for students to express their ideas both orally and in
writing, helping them become more involved in their learning. For suggestions on
how to develop and use cooperative learning activities see Johnson, Johnson &
Smith (1991) or Good sell et al. (1992).
Humans are natural learners — and we learn best when we perform the tasks
we are trying to learn. No matter how good your grades were at college, most of
your learning takes place once you enter the workplace and start applying what
you've learned. The practice may mean hands-on activities, activities using
cooperative small groups, or work on the computer. Students also learn better if they
have experience applying ideas in new situations. If they practice only calculating
answers to familiar, well-defined problems, then that is all they are likely to learn.
Students cannot learn to think critically, analyze information, communicate ideas,
make How Students Learn Statistics arguments, tackle novel situations unless they
are allowed and encouraged to do those things over and over in many contexts.
Merely repeating and reviewing tasks is burning to lead to improved skills or deeper
understanding.
Students learn better when activities are structured to help students evaluate
the difference between their own beliefs about chance events and actual empirical
results (delMas & Bart, 1989; Shaughnessy, 1977). If students are first asked to
make guesses or predictions about data and random events, they are more likely to
care about the actual results. When experimental evidence explicitly contradicts
their predictions, they should be helped to evaluate this difference. Unless students
are forced to record and then compare their predictions with actual results, they tend
to see in their data confirming evidence for their misconceptions of probability.
19
Research in physics instruction also points to this method of testing beliefs against
empirical evidence (e.g., Clement, 1987).
Another reason to expand assessment beyond the exclusive use of traditional
tests is that students will only apply themselves to those skills and activities on
which they know they will be evaluated. If students know they will be evaluated on
their ability to critique and communicate statistical information, or to work
collaboratively on a group project, they will be more willing to invest themselves in
improving skills required by these activities. Use of the suggested methods of
teaching will not ensure that all students will learn the material. No method is
perfect and will work with all students. Several research studies in statistics as well
as in other disciplines show that students' misconceptions are often strong and
resilient-they are slow to change, even when students are confronted with evidence
that their beliefs are incorrect. And this is only part of the problem. Another is
whether students are engaged enough to struggle with learning ideas.
A sound curriculum should take into account student motivation toward the
subject. We implemented some of the reform-based principles in a specially
designed unit of work aimed at encouraging students to learn statistics and become
critically thinking consumers of statistical information. This new material is
currently under development and has the following features. The key point of this
specially designed unit of work is motivation. It is considered in the light of using
media reports, examples of misleading statistics and other interesting material about
real-world situations. The goal and challenge of the developed material are to help
students to see the usefulness of statistical knowledge in understanding the world
around them and, hopefully, make them more motivated to engage with the topic.
20
CONCLUSION
Through the analysis of this report, we can show that these factors - time of
self-study, score of the advanced mathematics, attention to the lecturer, … etc - have
positive impacts on the subject of statistics and probability. Obviously, students who
do not take the time to study on their own and review have difficulty achieving the
desired score on the test. Besides, those who do not intend to study statistically
seriously are hard to pass this subject. Therefore, students need to choose an
appropriate way to maximize their ability to study statistics and probability.
The basic understanding of econometrics, together with the external
knowledge, help us to complete this report. This report not only helps us to
understand more about econometrics and improve our testing skills, it also teaches
us about this useful application which helps us complete this report.
However, there are still some shortcomings in this report. First of all, besides
these factors, there are still some other variables that increase the estimated
accuracy of the report on the score of statistics and probability such as attitudes,
social networks, extraordinary activities ... without making some false calculations.
Second, these are just learnings that we may know so there may be some
misinterpretations in this report. Third, we have problems in running vif because
there are some wrong details. In conclusion, we hope Dr. Quynh and readers can
give us helpful comments on the report so that we will do much better on our next
research.
21
REFERENCE
1. Bu.edu.(2018). Why Study Statistics » Statistics » Boston University.
/>cs/
2. Chegg.com. (2018). What is Advanced College Math - Chegg Tutors | Online
/>3. Cran.r-project.org. (2018). />4. Garfield, J. & delMas, R. (1991). Students' conceptions of probability. In
Proceedings of the Third International Conference on Teaching Statistics, D.
Vere-Jones (Ed.). Volume 1. pp. 340-349. Voorburg, The Netherlands:
International Statistical Institute
5. IvyWise. (2018). Self-Studying: What’s the Benefit and How to Do It | IvyWise.
/>ng-whats-the-benefit-and-how-to-do-it/
6. Joan, G.(1987). How Students learn Statistics. 1st ed. [pdf] Mexico:
International Statistical Institute />7. Oxford Dictionaries | English. (2018). self-study | Definition of self-study in
English by Oxford Dictionaries.
/>8. Shaughnessy, J.M. (1992). Research in probability and statistics: Reflections
and directions. In Handbook of Research on Mathematics Teaching and
Learning. D.A. Grouws (Ed.). pp. 465-494. New York: Macmillan.
9. Shaughnessy, J.M. (1977). Misconceptions of probability: An experiment with a
small-group activity-based, model building approach to introductory probability
at the college level. Education Studies in Mathematics, 8,285-316.
10. Svetlana and Gillian, I.(2010). Teaching Strategies to Promote Statistical
Literacy: Review And Implementation. 1st ed. [pdf] United Kingdom: Lancaster
University.
o/8/cd/pdfs/contributed/ICOTS8_C193_TISHKOVSKAY.pdf
11. Sydney.edu.au. (2018). Constructivism - Learning and Teaching - The
University of Sydney.
22
12.
/>uctivism.shtml
/>do
23
INDIVIDUAL ASSESSMENT
Evaluator
Nhi
Mai
Đức
Khánh
Hồng
Nhi
-
9
10
10
10
Mai
10
-
10
9
10
Đức
10
10
-
10
9
Khánh
10
10
9
-
10
Hồng
9
10
10
10
-
Average
score
9.75
9.75
9.75
9.75
9.75
24