Economic growth and balance of payments constraint in Vietnam
Bạn đang xem bản rút gọn của tài liệu. Xem và tải ngay bản đầy đủ của tài liệu tại đây (134.72 KB, 15 trang )
.VEMR.
Economic research
ECONOMIC GROWTH AND BALANCE OF PAYMENTS CONSTRAINT…
Economic Growth and
Balance of Payments Constraint in Vietnam
Pham Sy An*
ABSTRACT
This paper focuses on the question of whether economic growth was constrained by Vietnam’s balance of payments
during the 1990-2004 period, by using the model developed by Thirlwall. Based on quarterly and annual data from the
period, we found that economic growth was indeed constrained by the country’s balance of payments, although deficits
in the trade and current account were partly relieved by external inflows of capital such as foreign direct investment,
official development assistance, and debt. This is evidence that the Vietnamese Government must adopt policies that can
relieve the balance of payments and foster economic growth.
Introduction
Economic growth is usually the primary goal of an economy. To accelerate economic
growth, it is worth billions to identify where the source of economic growth comes from and this
has been the subject of much controversy among economists. On one side, economists such as
Solow (1957), Romer (1986), Lucas (1988), and Krugman (1989) suggest that economic growth
originates from the supply side, such as labor, capital, total factor productivity (TFP), and
research and development (R&D). In their eyes, factors like supply and productivity play a major
role in economic growth and the differences in economic growth among countries are due to
differences in factors like supply and productivity. On the other side, economists such as Keynes
(1936) and Thirlwall (1979) believe that demand will induce or constrain economic growth.
Thirlwall (1979), a post-Keynesian economist, considered demand, especially international trade,
as the principal factor accelerating or constraining growth. He suggests that the dominant
constraint on demand is balance of payments in an open economy and his model, the so-called
Balance of Payments Constrained Economic Growth model, stresses primarily on balance of
payments as a constraint of economic growth.
In the 1998-2001 period, for instance, after the Asian financial crisis, Vietnam experienced
the phenomenon of supply exceeding demand, and the economy fell into stagnation. Growth was
low and deflation and disinflation appeared. In confronting the situation, the government
*
Pham Sy An is a research fellow at the Vietnam Institute of Economics, Vietnam Academy of Social Sciences. The
author would like to thank Dr. Vo Tri Thanh (CIEM), Nguyen Cao Duc (CAF), and James Donald (ANU) for their
valuable comments on and support for the completion of this paper.
Number 1 Winter 2006
Vietnam economic management review
51
.VEMR.
Economic research
ECONOMIC GROWTH AND BALANCE OF PAYMENTS CONSTRAINT…
determined to stimulate domestic demand. Expansionary monetary policy and relaxed fiscal
policy were implemented through credit expansion, low interest rates, and increases in
government spending. This is clear evidence indicating that supply does not guarantee growth.
Moreover, unemployment and capital waste prove that available production factors are
underutilized in reaching potential output (Vietnam Institute of Economics 2002). In the case of
supply exceeding demand, sources will be underused, while when demand exceeds supply,
sources from other places will flow into the economy to satisfy demand.
Until now, the relationship between the balance of payments and economic growth has not
been recognized in Vietnam. Researchers have focused on looking for sources of economic
growth in Vietnam under the form of production function (supply side), such as Tran Vo Hung
Son and Chau Van Thanh (1998), Le Dang Doanh et al (2002), and Chu Quang Khoi (2003).
Therefore, this paper is the first attempt at investigating economic growth in Vietnam from the
demand side. The purpose of the paper is to answer the question of whether or not economic
growth was constrained by the balance of payments in Vietnam during the 1990-2004 period.
The paper applies Thirlwall’s balance of payments constraint model.
The paper is structured into five sections and will be presented in two issues of the Review.
Following the Introduction, Section 1 briefly reviews the picture of Vietnam’s economy and
considers economic growth in relation to balance of payments during the 1990-2004 period.
Section 2 develops the Balance of Payments Constrained Economic Growth Model. Section 3
estimates the growth constrained by balance of payments in the Vietnamese economy using
quarterly data from the 1990-2004 period. Finally, Section 4 provides conclusions and policy
implications.
1. Economic growth in Vietnam’s economy during the 1990-2004 period
1.1. Economic overview
In the early 1980s, Vietnam’s economy was essentially a centrally-planned economy. The
State controlled and intervened in the means of production as regards physical inputs, output, and
prices. It established trade barriers, especially in foreign trade, and set dual foreign exchange
rates as well as interest rates. The result was hyperinflation and slow economic growth.
At the end of the 1980s, the Vietnamese Government launched the “doi moi” (economic
renovation) process at the Sixth Congress of the Communist Party, with the nature of the process
being a movement away from a centrally-planned economy towards a market-oriented economy.
In the first three years of doi moi, changes took place in foreign investment policy, land policy,
foreign trade policy, and banking policy. However, the failure of these efforts to stabilize the
economy until 1989, as well as the expectation of aid from the former Soviet Union drying up,
created the strongest pressure on reform. In March of 1989, Vietnam adopted a radical and
comprehensive reform package aimed at stabilizing and opening up the economy, and enhancing
freedom of choice for economic units in order to fundamentally change the economic
management system in the country. The reform measures consisted of complete price
liberalization, large devaluation and unification of the exchange rate, increases in interest rates to
52
Vietnam economic management
review
Number 1 Winter 2006
.VEMR.
Economic research
ECONOMIC GROWTH AND BALANCE OF PAYMENTS CONSTRAINT…
positive levels in real terms, substantial reductions in subsidies to the SOE sector,
encouragement of the private sector and a return to family farming on the basis of long-term
leases. The 1989 reform package was considered the most successful since the basic conditions
were created for the transformation into a market-oriented and open economy.
After the 1989 reform package was implemented, hyperinflation fell rapidly from three digit
levels to two digit levels, economic growth gradually improved, growth rates in exports and
imports increased, and Vietnam became a rice exporting country after a long period of importing
rice. These initial achievements encouraged the economic renovation program and were an initial
stepping stone on the path to success during 1992-1997. The successful years began with the
Seventh Party Congress in June 1991, which decided to continue doi moi by establishing and
developing basic markets such as the labor market, capital and money markets, and an official
foreign exchange market, and allowed prices and interest rates to be determined by market
forces. In this period, economic growth was impressive, recording 8.77% on average. Inflation
also fell quickly to single-digit levels, except in 1992 (17.5%). Inflation was thus under control,
contributing significantly to macroeconomic stabilization and creating good conditions for high
economic growth. Growth rates in exports and imports in these successful years were quite high
and played an important part in promoting high economic growth. Moreover, high foreign
investment flows and high savings to investment ratios were achievements in the period and this
time marked a new phase of international integration, with Vietnam becoming a full-member of
ASEAN in 1995.
The Asian financial crisis suddenly broke out in Thailand and quickly spread its negative
effects to other Asian countries such as Indonesia, Malaysia, and South Korea in 1997. Although
the financial crisis did not impact directly on Vietnam’s economy, it had considerable indirect
influence and curtailed the high economic growth of previous years. Growth fell unexpectedly to
5.76% in 1998 and continued to be low from 1998 to 2001. Inflation in the period after the Asian
financial crisis was strangely low (a disinflation rate), and a minus figure in 2000 (a deflation rate
of -0.6%). This phenomenon is a symbol of stagnation (low rates of inflation and growth). In this
period, Vietnam became a member of APEC in 1998 and signed the Bilateral Trade Agreement
with the US in 2000. Vietnam was also actively preparing the groundwork for its WTO accession.
After the repercussions from the Asian financial crisis eased, economic growth was partly
restored and inflation inched upwards (4% in 2002, 3% in 2003, and 9.5% in 2004). As existing
difficulties pass, though, new ones arise. Although the Asian financial crisis was a good lesson
for Vietnam, it is now being forced to reform its institutions and economy under pressure of
international competitiveness if it wants its economy to integrate into the global economy with
general laws and recording high growth as well as stability.
1.2. Economic Growth in the 1990-2004 Period
In the 1990-2004 period, economic growth varied according to policy responses and changes
in internal as well as external environments. As regards macroeconomic policies, the 1990-2004
period can be divided into two sub-periods: 1990-1995 and 1996-2004. The former was for
Number 1 Winter 2006
Vietnam economic management review
53
.VEMR.
Economic research
ECONOMIC GROWTH AND BALANCE OF PAYMENTS CONSTRAINT…
stabilizing macroeconomic policies and the latter for macroeconomic stabilization to record
higher growth. However, for the purpose of this paper the 1990-2004 period will be divided into
three sub-periods: 1990-1997, 1998-2001, and 2002-2004, to reflect the status of economic growth
and the relationship between economic growth and balance of payment constraints.
Business cycle of economic growth in the 1990-2004 period
Traditional theories of the business cycle that considers cycles to be self-sustaining have
been substituted by modern theories that attribute cyclical fluctuations to the cumulative effect of
shocks and disturbances that continually affect the economy (Chatterjee 2000). Based on this
shock-based view of the business cycle, we can examine the cumulative effect of shocks and
disturbances that brought about fluctuations in economic growth during the 1990-2004 period.
After implementing structural and orthodox reforms in 1989, natural and financial resources
were allocated more efficiently, creating new incentives to produce goods and services. In the
first two years of this period, economic growth averaged 5.45%. Then the cumulative effect of
institutional reforms spurred economic growth to high levels during the 1992-1997 period, until
the second shock came in the form of the Asian financial crisis in July 1997. While the first
shock buffeted economic growth through the reallocation of natural and financial resources, the
second shock impacted on economic growth through trade and investment.
Prior to the Asian financial crisis, Vietnam’s economy was considered a small, open one in
terms of the ratio of trade to GDP, and it connected with the outside through trade and
investment. The shocks from the crisis influenced Vietnam’s economy through these channels,
especially as its trade was concentrated primarily on Asian countries and substantial foreign
direct investment came from Asian countries. There is a third channel that can affect Vietnam’s
economic growth: the financial channel. Vietnam’s capital account in the balance of payments
was controlled and restricted, so the shocks from the Asian financial crisis could not buffet
Vietnam’s economy through portfolio investment and, consequently, the impact of the shocks on
economic growth were not so severe.
The effect of the shocks on economic growth then died out, Vietnam’s economy recovered
and trade and FDI were also restored. Since 2002, economic growth has been high and other
macroeconomic indicators such as the budget deficit and inflation have been stable.
Period of economic stabilization and high growth: 1990-1997
The 1990-1997 period was characterized by high growth rates and stability in the socioeconomic climate. High economic growth was only seen during 1992-1997, because in the first
two years Vietnam had yet to break out of the “bad” period in the 1980s. During 1990-1991,
Vietnam’s economy recovered its balance to motivate the following years of 1992-1997. Thus,
the 1990-1997 period can be divided into two sub-periods: 1990-1991 and 1992-1997. For these
reasons, the period can be called the period of economic stabilization and high growth.
The need to confront potential macroeconomic crises was increasing, and in the beginning of
1989 the government decided to audaciously combine structural reform and orthodox
stabilization measures. Structural reform brought about the liberalizing of most domestic prices,
54
Vietnam economic management
review
Number 1 Winter 2006
.VEMR.
Economic research
ECONOMIC GROWTH AND BALANCE OF PAYMENTS CONSTRAINT…
while orthodox stabilization measures included raising interest rates, restraining credit
expansion, and devaluating the exchange rate (Liunggren 1994). The result was an astonishing
fall in inflation (from 393.8% in 1988 to 34.7% in 1989). However, by the end of 1989 high
inflation had returned and continued upwards in 1990 and 1991 (67.1% and 67.5%,
respectively). The balance of payments became serious and the collapse of the Soviet Union, one
of Vietnam’s major donors and trading partners, resulted in grave shortages of necessary
imported inputs for production, particularly petroleum and fertilizer. Growth was just 5.09% and
5.81% in 1990 and 1991, respectively (Liunggren 1994). All of these were synonymous with a
latent return of macroeconomic instability.
Reduction in aid from the Soviet Union, devaluation to reach the prevailing market exchange
rate, and trade liberalization motivated exports and earned foreign exchange. This in turn
increased imported inputs for production.
Economic growth and the inflation rate surprisingly averaged 8.77% and 9.65%, respectively.
Indeed, the stabilization period (1990-1991) was a springboard for the high growth seen in 1992-1997.
In this period, the renovation process continued with several proposed macroeconomic
reforms, such as (1) establishing and developing basic markets like labor, official exchange rate,
capital and money markets; (2) allowing prices, interest rates, and exchange rates to be market
determined; and (3) innovating administrative procedures.
Growth rates for industry and construction as well as services were high during this period,
especially industry and construction, at 13.25% per annum. Industry was considered the engine
of growth. Moreover, the proportion of agriculture, forestry, and fishery fell compared to the
proportion of industry, construction and services. Structural changes in the economy by
increasing industrial and manufactured goods and decreasing agricultural products in the GDP
showed a positive tendency in the process of development.
Table 1: Growth rates of agriculture, industry, and services (%)
(1994 prices)
1990 1991 1992 1993 1994 1995 1996 1997 1998 1999 2000 2001 2002 2003 2004
GDP
5.09 5.81 8.7
Agriculture, forestry and fishery
1
8.08 8.83 9.54 9.34 8.15 5.76 4.77 6.79 6.84 7.04
2.18 6.88 3.28 3.37 4.8
4.4
4.33 3.53 5.23 4.63 2.79 3.62
7.3
7.6
3.9
3.3
Industry and Construction
2.27 7.71 12.79 12.62 13.39 13.6 14.46 12.62 8.33 7.68 10.07 10.32 9.95 10.32 10.3
Services
10.19 7.38 7.58 8.64 9.56 9.83 8.8
7.14 5.08 2.25 5.32 6.13 6.31 6.32 7.3
Source: The General Statistics Office (GSO) (1996, 2000, 2005)
The current account deficit as a percentage of GDP was relatively high compared with other
periods and the trade deficit increased during the high growth period (see Figure 1). To speed up
economic growth, a large trade deficit is inevitable as developing countries often import capital
goods and intermediary inputs for production while exporting primary products and low valueadded goods, and this was the case with Vietnam.
Number 1 Winter 2006
Vietnam economic management review
55
.VEMR.
Economic research
ECONOMIC GROWTH AND BALANCE OF PAYMENTS CONSTRAINT…
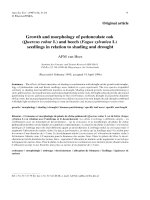
Figure 1: GDP growth rate and Trade balance/GDP ratio
15.00
10.00
5.00
0.00
1990
1991
1992
1993
1994
1995
1996
1997
-5.00
-10.00
-15.00
Trade balance/GDP (%)
GDP growth rate (%)
Source: GSO (1996, 2000, 2005)
The coefficient of the correlation between economic growth and the ratio of the trade balance
to GDP in the 1990-1997 period was -0.7. This was negative and quite high. It raises the
question: what happens if there is a shortage of foreign exchange for imports? If this was to
occur, imports would be reduced and domestic resources such as labor and machinery would be
underemployed, and economic growth would be not be as high as usual. Fortunately, this did not
happen in Vietnam, where the shortage of foreign exchange was supplemented mainly by
inflows of FDI and partly by debt and net transfers.
The coefficient of the correlation between GDP (%) and FDI was 0.53. This is moderate and
positive. In the high growth period, FDI was high on average as well and the reduction in
economic growth in 1997 compared with 1996 was accompanied by a simultaneous decline in
FDI levels. Thus, FDI partly impacted intuitively on economic growth.
In summary, in order to impulse economic growth, developing countries need to import the
necessary inputs for production, but the level of exports required to earn foreign exchange aimed
at financing imports are rarely met, so inflows of capital such as debt and foreign investment are
very important. In the case of Vietnam, the scarcity of foreign exchange was fortunately
supported by FDI, and partly by net transfers from remittances and debt.
Period of economic slowdown after the Asian financial crisis: 1998-2001
The Asian financial crisis in 1997 put an end to Vietnam’s high economic growth. Growth fell
suddenly from 8.15% in 1997 to 5.76% in 1998. Although Vietnam’s economy was not seriously
affected directly like other Asian countries, it was hit indirectly. In the same period, Vietnam’s
economy also suffered from recession, with symptoms of disinflation and low economic growth.
In this period, growth and inflation averaged approximately 6% and 2.38%, respectively. The
growth rate of industry, considered “the engine of growth”, unexpectedly declined. The Asian
financial crisis resulted in a slowdown in the economies of influential countries and the
unavoidable consequences were reductions in exports to and imports from these countries as well
56
Vietnam economic management
review
Number 1 Winter 2006
.VEMR.
Economic research
ECONOMIC GROWTH AND BALANCE OF PAYMENTS CONSTRAINT…
as their investment to Vietnam. Furthermore, Vietnam’s currency devaluation was sufficient to
enhance competitiveness compared with other countries in Asia.
In this period, the trade balance and current account were slightly in deficit and even surplus
in 1999-2001, but economic growth was low compared with the previous period. It is worth
noting that narrowing the gap in the trade deficit can be a bad sign for developing countries, as
they must import capital goods and intermediate inputs for domestic production and for export.
Vietnam’s imports, as well as exports, fell significantly in the period, and unemployment
concurrently increased. It is also important to understand that in order to reduce the trade deficit
and still accelerate economic growth, it is not necessary to restrain imports because this will
affect domestic production and exports. So the import of necessary inputs for production can
continue to be encouraged, and exports will simultaneously expand. However, less developed
countries usually export primary goods that have low prices and income elasticities in demand,
while importing manufactured goods that have high prices and income elasticities in demand, so
the trade deficit will widen unless reductions in economic growth drive decreases in imports. In
the case of Vietnam, the period of high economic growth was also the period of a large trade
deficit, as well as the current account deficit. The foreign exchange gap was filled by foreign
financial resources. However, if the trade deficit continuously widened and the gap was not
bridged by financial resource due to unsustainable warnings about Vietnam’s balance of
payments in the international community, then there would not be the minimum amount of
foreign exchange required to achieve targeted growth rates and economic growth would be
constrained by the balance of payments. Of course, this has not happened in Vietnam’s case at
present. It is a reminder of the important theory that shows that reductions in the trade deficit due
to limiting or decreasing imports will constrain economic growth, as in 1998-2001 period.
In the period, inflows of foreign investment into Vietnam decreased because foreign investors
feared that instability in the regional socio-economic environment could affect Vietnam’s
economy. In the 1990-1997 period, FDI increased strongly, at an average of 66.2%, but then fell by
12% in the 1998-2001 period despite the new Law on FDI in 1996 and its amendment on 9 June
2000 to improve the investment climate and attract inflows of foreign investment.
Another economic event to occur in 1999-2001 was recession. This stemmed from supply
exceeding demand in the domestic economy. The industrial structure leaned towards the importsubstitution industry, which had a high effective rate of protection, and the growth of heavily
protected industrial output has far outdistanced manufactured export growth (Dapice 2002).
Confronting this situation, the government executed a demand-stimulus policy1 aimed at
stimulating domestic demand. Although the government implemented several measures such as
reducing tax rates and interest rates and expanding credit, domestic demand was not stimulated
as expected and supply still exceeded demand because of poor management and lack of
coordination in policies (See Le Xuan Sang (2003), Nguyen Van Tau (2001)).
In summary, the low growth rate during the period was due to weaknesses in the domestic
production structure and adverse external shocks. Although the trade balance, the current account
Number 1 Winter 2006
Vietnam economic management review
57
.VEMR.
Economic research
ECONOMIC GROWTH AND BALANCE OF PAYMENTS CONSTRAINT…
and the overall balance were in slight deficit and even surplus, economic growth was low. This
period was a lively example of economic growth being constrained by demand in an open
economy. Reduction in external demand (exports) resulted in a decrease in demand for imports
of capital goods and an increase in unemployment in export activities. This in turn brought about
reductions in income and, subsequently, domestic demand. To stimulate demand, the
government must increase its expenditure but, of course, budget revenue was reduced due to the
recession. This created a large budget deficit. Moreover, the gap between savings and investment
also increased. This period quite clearly indicated that in an open economy, economic growth
will be constrained by balance of payments and one gap in foreign exchange can bring about two
other gaps, in savings and budget.
Period of economic recovery and integration into the global economy: 2002-2004
The repercussions from the Asian financial crisis subsided but new difficulties arose.
Economic growth began to recover and the inflation rate also increased slightly in 2002 and
2003, suddenly jumping to nearly 10% in 2004. Vietnam was also preparing to commit to WTO
membership requirements, so it was urgent to quickly liberalize trade and finance as well as
reform state-owned enterprises and administrative procedures.
In this period, economic growth recovered and the trade balance was in deficit because the
value of imports exceeded that of exports, although growth in exports was restored, at 25.3% and
28.9% in 2003 and 2004, respectively. Again, the opposite relationship between the trade
balance and economic growth is clearly visible. A large trade deficit brings about high economic
growth. And the foreign exchange gap is mainly financed through FDI inflows, and partly by net
remittances and debt. In terms of export destinations, Vietnam still exports primarily to Asia,
followed by the US and Europe. Vietnam imports chiefly from Asia. Lack of diversity in the
origin of imports and the destination of exports can result in a high level of risk when adverse
domestic shocks occur that negatively affect the balance of payments and then economic growth.
In summary, economic growth recovered during this period and the trade deficit was high.
Exports were mainly primary goods and land-based products. The import of machinery,
equipment, materials, and fuel dominated total imports. The Vietnamese Government continued
to reform the economy on the threshold of international economic integration, but many
weaknesses were revealed and challenged the process of reform, especially the dubious nexus
and kinship among government, state-owned enterprises, and commercial banks.
In conclusion, the following remarks on Section 2 of this paper can be made. Firstly,
economic growth went through three sub-periods: the periods of stabilization and acceleration
(1990-1997), recovery (1998-2001), and integration (2002-2004). Each sub-period had specific
characteristics and policy responses to adapt to changes in the internal and external environment.
Secondly, the economic structure changed slowly. This was unexpected in the process of
industrialization and improvements in competitive capacity. Thirdly, economic growth and the
trade balance, as well as the current account, have an opposite relationship. And these deficits
were filled by FDI, debt, and net transfer. Thus, economic growth would have been severely
58
Vietnam economic management
review
Number 1 Winter 2006
.VEMR.
Economic research
ECONOMIC GROWTH AND BALANCE OF PAYMENTS CONSTRAINT…
constrained by balance of payments if no capital inflows bridged the gap in the trade balance and
current account.
2. The balance of payments constrained growth model
Thirlwall, a post-Keynesian economist, uses his model, the so-called Balance of Payments
Constrained Economic Growth Model, similar to a dynamic version of Harrod’s (1933) Foreign
Trade Multiplier, to explain the position of trade and the balance of payments in economic
growth. Thirlwall (1979) reckoned that economic growth is ultimately constrained by the balance
of payments. In his original model, international trade, particularly elasticities in demand for
exports and imports in respect to price and income, plays a considerable role in explaining the
differences in growth rates across countries. It is necessary, therefore, to revisit Thirlwall’s
growth law and its other modified models.
The initial equilibrium condition is given by:
Pd X = P f ME
[1]
Pd X + F = Pf ME
[2]
Pd X + R = Pf ME
[3]
Pd X + IDPx = P f ME + IDPm
[4]
Pd X + F = P f ME + D
[5]
In which X is the quantity of exports, Pd is the price of exports in domestic currency, M is the
quantity of imports,
Pf
is the price of imports in foreign currency, E is the exchange rate
measured as the domestic price of foreign currency, F is the value of nominal net capital inflows
measured in domestic currency, R is value of remittance, IDPx is the value of nominal revenues,
in domestic currency, of invisible services related to production factors, the so-called “ IDP
revenues”, IDPm is the value of nominal expenditures, in domestic currency, of the invisible
services related to production factors, the so-called “ IDP expenditures”, and D is debt service.
Recognizing that a country can obstinately face a trade deficit, Thirlwall and Hussain (1982)
developed the “Extended Model”, with the initial equilibrium condition [2]. Elliot and Rhodd
(1999) highlighted the importance of debt servicing in the equilibrium condition, so the initial
condition can be included in [5]. And other economists can modify the initial equilibrium
condition in putting forward the importance of certain factors in the balance of payments such as
capital flows, interest payments (Brid 2001), interest, dividends, and profits of the current
account of balance of payments (Ferreira and Canuto 2003) in accordance with studied countries.
In [3], due to the importance of remittance in filling the deficit in the trade balance in many
developing countries, it is necessary to add remittance to the initial condition.
Taking logarithm and rates of growth infers:
Number 1 Winter 2006
Vietnam economic management review
59
.VEMR.
Economic research
ECONOMIC GROWTH AND BALANCE OF PAYMENTS CONSTRAINT…
pd + x = p f + m + e
[6]
θ ( p d + x ) + (1 − θ ) f = p f + m + e
[7]
γ ( p d + x ) + (1 − γ )r = p f + m + e
[8]
ω ( p d + x) + (1 − ω )idp x = α ( p f + m + e) + (1 − α )idpm
[9]
θ ( p d + x) + (1 − θ ) f = ρ ( p f + m + e) + (1 − ρ )d
[10]
In which, lower case letters represent rates of growth of the respective variables; θ and
( 1 − θ ) represent the shares of exports and capital flows as a proportion of these receipts, γ and
(1 − γ ) are the shares of exports and remittance as a proportion of these receipts, ω and ( 1 − ω )
are the share of exports of goods and IDP revenues as a proportion of total receipts in the
current account, α and ( 1 − α ) show the share of imports and IDP expenditures as a proportion
of total payments in current account, and ρ and (1 − ρ ) are the shares of imports and debt
service on total expenditure.
The normal multiplicative import and export demand functions have the forms:
[
X = b[P
]Y
P E] Z
M = a Pf E Pd
d
ψ
η
π
[11]
ε
[12]
f
In which a and b are constants, ψ is the price elasticity of demand for imports (ψ < 0), η is
the price elasticity of demand for exports (η < 0), Y is domestic income, Z is the level of world
income, π is the income elasticity of demand for imports, and ε is the income elasticity of
demand for exports. Taking logarithm and rates of growth give:
m = ψ ( p f + e − pd ) + π ( y)
[13]
x = η ( p d − p f − e) + ε ( z )
[14]
Substituting [13] and [14] into equations [6] to [10] and implementing some algebraic
manipulations, we obtain:
y = [(1 + η + ψ )( p d − p f − e) + εz ] π
[15]
y = [θεz + (1 − θ ) f + θp d − p f − e + (θη + ψ )( p d − p f − e)] π
[16]
y = [γεz + (1 − γ )r + γp d − p f − e + (γη + ψ )( p d − p f − e)] π
[17]
y = [ωεz + (1 − ω )idp x + ωp d − (1 − α )idp m − αp f − αe + (ωη + αψ )( p d − p f − e)] απ [18]
y = [θεz + (1 − θ ) f + θp d − (1 − ρ ) d − ρp f − ρe + (θη + ρψ )( p d − p f − e)] ρπ
[19]
The real exchange rate, by assumption, does not change very much in the long run2
( p d − p f − e = 0 ) or the Marshall-Lerner condition is just satisfied (ψ + η = 1 ) and x ≡ εz , equations
[15] to [19] become:
60
Vietnam economic management
review
Number 1 Winter 2006
.VEMR.
Economic research
ECONOMIC GROWTH AND BALANCE OF PAYMENTS CONSTRAINT…
y0 = x π
[20]
y1 = [θx + (1 − θ )( f − p d )] π
[21]
y 2 = [γx + (1 − γ )(r − p d )] π
[22]
y 3 = [ωx + (1 − ω )(idp x − p d ) − (1 − α )(idp m − p d )] απ
[23]
y 4 = [θx + (1 − θ )( f − p d ) − (1 − ρ )(d − p d )] ρπ
[24]
Finally, we gain several forms of the Balance of Payments Constrained Economic Growth
Model under different initial equilibrium conditions.
According to McCombie and Thirlwall, the standard Thirlwall growth law explains well why
developing countries grow at lower rates than developed countries and without the convergence
predicted by classical economists. Differences in the rate of growth can be explained by
differences in growth rates of export and income elasticity of demand for imports. The rate of
growth of exports in turn depends on income elasticity of demand for exports and world income
(1994, 1997). However, because of the different characteristics of each country in economic
growth, other modified models also are applied to adapt to these characteristics.
In developing countries, primary products for export are usually produced by applying laborintensive methods and elasticities in demand for these goods in respect to prices and incomes are
low, and this will result in deteriorating terms of trade for exported goods. Another factor in
determining growth is that income elasticity of demand for imports is usually high. Developing
countries import capital goods and intermediate inputs of production from advanced countries
in support of growth so they tend to increase demand for imports more than one percent if the
rate of growth increases one percent. Combining both low export growth rates (in value) and
high income elasticity of demand for imports brings about low growth rates in developing
countries compared with that in developed countries, and a divergence between them is
inevitable.
In post-Keynesian demand-led growth, export-led growth alone can lead to balance of
payments constraints in the long run if income elasticity of imports is high and sufficient to
offset increases in exports. Thus, the post-Keynesian tradition not only puts forward the
importance of exports but also sheds light on the importance of income elasticity of demand
for imports. From this standpoint, post-Keynesian and structuralist traditions support
structural adjustment to avoid much external dependence that require government policies
such as establishing trade barriers to protect domestic industries that have positive
externalities on other socio-economic activities and have social costs exceeding private
costs.
Number 1 Winter 2006
Vietnam economic management review
61
.VEMR.
Economic research
ECONOMIC GROWTH AND BALANCE OF PAYMENTS CONSTRAINT…
In conclusion, post-Keynesian and structuralist traditions build demand-led models
implying that government policies are indispensable in stimulating demand (or economic
growth) but should emphasize balance of payments constraints that can harm growth.
3. Estimating growth constrained by balance of payments in Vietnam during the 1990-2004
period
3.1 Model specification
It is necessary to find elasticity of demand for imports with respect to income ( π ) in the
case of Vietnam during the 1990-2004 period. To find π , as mentioned previously,
researchers usually use the multiplicative import function (as equation [11]) and after taking
logarithm and rates of growth the function becomes [13]. For convenience, it can be
reproduced as:
m = ψ ( p f + e − pd ) + π ( y)
[25]
Import growth depends firstly on growth in the terms of trade multiplied by the price
elasticity of demand for imports, and secondly on domestic income (as a proxy for expenditure)
multiplied by the income elasticity of demand for imports.
Adding constant term α , error terms ut , and subscript t into above the equation, it turns
out:
mt = α + ψ ( p ft + et − p dt ) + π ( yt ) + ut
[26]
Setting p t ≡ p ft + et − p dt , Equation [26] can be written
mt = α + ψ ( pt ) + π ( yt ) + ut
[27]
This equation will be estimated to find income elasticity of demand for imports π . Before
estimating the coefficients of certain equations, it is necessary to go through some important
procedures such as testing unit root for stationarity, finding the lag lengths of each variable, and
testing Granger causality.
Unit root test for stationarity
In regression models for time-series data, we usually face the phenomenon of “spurious
regression”. Thus, it is necessary to test stationarity before going further.
The simplest and most widely used tests for unit roots were developed by Fuller (1976)
and Dickey and Fuller (1979), the so-called Dickey-Fuller, or DF, tests; however, these are
special cases of augmented Dickey-Fuller tests, or ADF tests. Thus, ADF tests will be
employed for stationarity and results can be represented in the table below.
Table 3: Unit Root Tests for Stationarity3
62
Vietnam economic management
review
Number 1 Winter 2006
.VEMR.
Economic research
ECONOMIC GROWTH AND BALANCE OF PAYMENTS CONSTRAINT…
Notation
Description
Properties
mt
Rate of growth of import
Stationary
yt
Rate of growth of GDP
Stationary
pt
Rate of growth of relative price
Stationary
Lag lengths of each variable
Finding the lag lengths of each variable is very important in running regression with time
series. The “Akaike information criterion” (AIC) and the “Schwarz information criterion” (SIC)
will be applied to find the lag lengths of each variable including yt , mt , and pt .
According to Davidson and MacKinnon (1993), “…with quarterly data it may be wise to start
with p = q = 4 (in ARDL ( p, q ) )”. So, we start with the model
mt = α +
4
4
4
i =0
i =0
i =1
∑ψ i pt − i + ∑ π i yt − i + ∑ γ i mt − i + ut
Then, finding the lag lengths of each variable by using the AIC and the SIC, we obtain
mt = α +
0
4
2
∑ψ i pt − i + ∑ π i yt − i + ∑ γ i mt − i + ut
i =0
i =0
[28]
i =1
The Granger test
It is necessary to use the Granger causality test for four cases: (1) unidirectional causality
from m to y, (2) unidirectional causality from y to m, (3) feedback or bilateral causality, and (4)
independence.
4
4
mt = α 0 + ∑ β1i yt − i + ∑ β 2i mt − i + v1t
i =1
i =1
4
4
yt = α 0 + ∑ β 3i mt − i + ∑ β 4i yt − i + v 2t
i =1
[29]
[30]
i =1
The lag length of each variable can be chosen so that the autocorrelation problem is rejected
(Vogelvang 2005). For that condition, the lag length of each variable is revealed as four.
After running [29] and [30] in the absence of autocorrelation, it can be concluded that
unidirectional causality is from y to m 3. Thus, coefficients of equation [28] can be estimated by
the method of ordinary least squares.
(To be continued in the next issue)
Notes
1. The demand stimulus policy had been implemented since mid-1999 with an emphasis on
Number 1 Winter 2006
Vietnam economic management review
63
.VEMR.
Economic research
ECONOMIC GROWTH AND BALANCE OF PAYMENTS CONSTRAINT…
expansionary fiscal policy and monetary policy.
2. Krugman (1989) observed that there are no trends in real exchange rates in the long run, or, in
other words, he asserts that relative prices should be taken as constant in the long run.
According to McCombie and Thirlwall (1994), there are three reasons why relative prices
remain unchanged in the long run: (1) domestic price changes mirror exchange rate changes;
(2) highly competitive markets, and (3) oligopolistic market structures.
3. See Appendix 1 for more details.
References
Brid J. C. M (2001), “Capital Flows, Interest Payments and the Balance-of Payments
Constrained Growth Model: a Theoretical and an Empirical Analysis”, Prepared for the
Conference an Old and New Growth theories: an Assessment Pisa, Italy, October 5-7.
Chatterjee, S. (2000), “From Cycles to Shocks: Progress in Business Cycle Theory”, Federal
Reserve Bank of Philadelphia, March/April 2000.
Chu Quang Khoi (2003), Sources of Economic Growth, the Case of Vietnam in the Period
1986-2001, Thesis for Masters Degree, MDE Hanoi.
Dapice, D.O. (2002), “Success and Failure: Choosing the Right Path to Export-led Growth,
Center for Business and Government,” Cambridge.
Davidson, R. and Mackinnon, J. G. (1993), Estimation and Inference in Econometrics, Oxford
University Press, Oxford.
Dickey, D. A., and Fuller, W. A. (1979), "Distribution of the estimators for autoregressive
time series with a unit root," Journal of the American Statistical Association, 74.
Elliot, D.R. and Rhodd, R. (1999), “Explaining Growth Rate Differences in Highly Indebted
Countries: an Extension to Thirlwall and Hussain,” Applied Economics 31.
Ferreira, A. L. and Canuto, O., (2003), “Thirlwall's Law and Foreign Capital in Brazil,”
Enero-Febrero de 2003.
Fuller, W. A. (1976), Introduction to Statistical Time Series, John Wiley & Sons, New York.
General Statistics Office (1996), Statistical Yearbook 1995 of Vietnam, Statistical Publishing
House, Hanoi.
General Statistics Office (2000), Statistical Yearbook 1999 of Vietnam, Statistical Publishing
House, Hanoi.
General Statistics Office (2005), Statistical Yearbook 2004 of Vietnam, Statistical Publishing
House, Hanoi.Harrod, R. (1933), International Economics, Cambridge University Press,
Cambridge.
Keyness, J. M. (1936), The General Theory of Employment, Interest and Money, Macmillan,
London.
Krugman, P. (1989), “Differences in Income Elasticities and Trends in Real Exchange Rates,”
European Economic Review 33, 5: 1031-46.
64
Vietnam economic management
review
Number 1 Winter 2006
.VEMR.
Economic research
ECONOMIC GROWTH AND BALANCE OF PAYMENTS CONSTRAINT…
Le Dang Doanh et al (2002), Explaining Growth in Vietnam, CIEM, Paper for Development
Network, Hanoi.
Le Xuan Sang (2003), “Demand-stimulating Policies after 4 Years: Success, Limitations, and
Policy Implications,” Economic Studies Review No 301-302.
Liunggren, B. (1994), Challenges on Reform Road in Indochina, National Political Publisher,
Ha noi.
Lucas, R. E. (1988), “On the Mechanics of Economic Development,” Journal of Monetary
Economics 22, 1: 3-42
McCombie, J. and Thirlwall, A. P. (1994), Economic Growth and the Balance of Payments
Constraint, Macmillan, London.
McCombie, J. and Thirlwall, A.P. (1997), "The dynamic Harrod Foreign Trade Multiplier and
the demand oriented approach to economic growth: an evaluation", International Review of
Applied Economics, January.
Nguyen Thi Hong (1999), The Sustainability of the Current Account Deficit in Vietnam (19891998), Thesis of Master Degree, MDE Hanoi.
Nguyen Van Tau (2002), Effectiveness of demand-stimulating policies: lessons from other
countries and experiences of Vietnam in period 1999-2001, MA thesis, Vietnam-Netherlands
Project for Master Program in Development Economics, NEU, Hanoi.
Romer, R. M. (1986) “Increasing Returns and Long Run Growth,” Journal of Political
Economy 94, 5: 1002-37.
Stiglitz, J. E. (2002), Keynesian Economics and Critique of First Fundamental Theorem of
Welfare Economics, in Market Failure or Success – the New Debate, edited by Tyler Cowen
and Eric Crumpton, Edward Elgar, Cheltenham, UK: 41-65.
Thirlwall, A. P. and Hussain, M. N. (1982), "The Balance of Payments Constraint, Capital
Flows and Growth Rate Differences Between Developing Countries", Oxford Economic
Paper.
Thirlwall, A.P. (1979) “The Balance of Payments Constrain as an Explanation of International
Growth Rate Differences,” Banca Nazionale del Lavoro Quarterly Review 128, 791: 45-53.
Tran Vo Hung Son and Chau Van Thanh (1998), “Analysis of the Sources of Economic
Growth of Vietnam,” CAS Discussion Paper No. 21, CAS-CIMDA.
Vietnam Institute of Economics (2002), Vietnam Economy 2002: New Policy Thinking for
New Stage of Development (Unpublished), Ha Noi.
Vogelvang, B. (2005), Econometrics - Theory and Applications with EViews, Pearson
Education Limited, the United Kingdom.
Number 1 Winter 2006
Vietnam economic management review
65