A nomogram model to predict death rate among non-small cell lung cancer (NSCLC) patients with surgery in surveillance, epidemiology, and end results (SEER) database
Bạn đang xem bản rút gọn của tài liệu. Xem và tải ngay bản đầy đủ của tài liệu tại đây (833.78 KB, 10 trang )
Jia et al. BMC Cancer
(2020) 20:666
/>
RESEARCH ARTICLE
Open Access
A nomogram model to predict death rate
among non-small cell lung cancer (NSCLC)
patients with surgery in surveillance,
epidemiology, and end results (SEER)
database
Bo Jia1†, Qiwen Zheng2†, Jingjing Wang1†, Hongyan Sun3, Jun Zhao1, Meina Wu1, Tongtong An1, Yuyan Wang1,
Minglei Zhuo1, Jianjie Li1, Xue Yang1, Jia Zhong1, Hanxiao Chen1, Yujia Chi1, Xiaoyu Zhai1 and Ziping Wang1*
Abstract
Background: This study aimed to establish a novel nomogram prognostic model to predict death probability for
non-small cell lung cancer (NSCLC) patients who received surgery..
Methods: We collected data from the Surveillance, Epidemiology, and End Results (SEER) database of the National
Cancer Institute in the United States. A nomogram prognostic model was constructed to predict mortality of NSCL
C patients who received surgery.
Results: A total of 44,880 NSCLC patients who received surgery from 2004 to 2014 were included in this study.
Gender, ethnicity, tumor anatomic sites, histologic subtype, tumor differentiation, clinical stage, tumor size, tumor
extent, lymph node stage, examined lymph node, positive lymph node, type of surgery showed significant
associations with lung cancer related death rate (P < 0.001). Patients who received chemotherapy and radiotherapy
had significant higher lung cancer related death rate but were associated with significant lower non-cancer related
mortality (P<0.001). A nomogram model was established based on multivariate models of training data set. In the
validation cohort, the unadjusted C-index was 0.73 (95% CI, 0.72–0.74), 0.71 (95% CI, 0.66–0.75) and 0.69 (95% CI,
0.68–0.70) for lung cancer related death, other cancer related death and non-cancer related death.
Conclusions: A prognostic nomogram model was constructed to give information about the risk of death for NSCL
C patients who received surgery.
Keywords: NSCLC, Surgery, Prognosis, SEER, Nomogram
* Correspondence:
Parts of these results were presented at the 2018 American Society of
Clinical Oncology Annual Meeting (Abstract #8525)
†
Bo Jia, Qiwen Zheng and Jingjing Wang contributed equally to this work
and should be considered co-first authors
1
Key Laboratory of Carcinogenesis and Translational Research (Ministry of
Education/Beijing), Department of Thoracic Medical Oncology, Peking
University Cancer Hospital & Institute, 52 Fucheng Road, Haidian District,
Beijing 100142, China
Full list of author information is available at the end of the article
© The Author(s). 2020 Open Access This article is licensed under a Creative Commons Attribution 4.0 International License,
which permits use, sharing, adaptation, distribution and reproduction in any medium or format, as long as you give
appropriate credit to the original author(s) and the source, provide a link to the Creative Commons licence, and indicate if
changes were made. The images or other third party material in this article are included in the article's Creative Commons
licence, unless indicated otherwise in a credit line to the material. If material is not included in the article's Creative Commons
licence and your intended use is not permitted by statutory regulation or exceeds the permitted use, you will need to obtain
permission directly from the copyright holder. To view a copy of this licence, visit />The Creative Commons Public Domain Dedication waiver ( applies to the
data made available in this article, unless otherwise stated in a credit line to the data.
Jia et al. BMC Cancer
(2020) 20:666
Page 2 of 10
Background
The morbidity and mortality of lung cancer ranked the
first in China and globally [1, 2]. Non-small cell lung
cancer (NSCLC) accounts for about 75 to 80% of lung
cancer patients, thus the treatment of NSCLC has been
an urgent health issue worldwide.
Radical surgery is required for early stage and parts of
locally advanced NSCLC patients [3]. Survival of NSCLC
patients after surgery varies greatly, and previous reported prognostic factors include age, tumor size, metastatic lymph node numbers, clinical stage, etc. [4–6]
However, other factors such as ethnicity, surgical
method, primary tumor location, anatomic sites, histological subtype, etc. remain controversial. Therefore,
studies with larger sample data and more rigorous statistical method assessing this problem are still needed.
For the reason that some early stage NSCLC patients
who received radical surgery may have relative longterm survival, several other causes of death may occur
among NSCLC patients. But previous studies mainly
focus on investigating prognostic factors for lung cancer
related death, studies considering non-cancer related
death are inadequate.
To better evaluate the prognosis of resected NSCLC
patients, and therefore to further provide more optimal
treatment strategies for these patients, we estimated the
causes of lung cancer related, other cancer related, and
non cancer related death among patients in a population
based Surveillance, Epidemiology, and End Results
(SEER) cohort using a innovative and validated nomogram model.
Methods
Data source
We collected data from the SEER database of National
Cancer Institute in the United States [7]. The data was
obtained using the SEER* Stat. The North American Association of Central Cancer Registries (NAACCR) documented data items and codes [8]. Primary cancer
histology and site were coded by the 3rd edition of the
International Classification of Diseases for Oncology
(ICD-O-3).
Cohort selection
Patients with lung tumors (site codes, C34.0-C34.9) were
included in this study from the year 2004 to 2014. The
following histologic codes were designated as NSCLC:
8010, 8012, 8013, 8014,8015, 8020,8021,8022,8031,8032,
8046, 8050–8052, 8070–8078, 8140–8147, 8250–8255,
8260, 8310,8323, 8430, 8480, 8481,8482, 8490, 8560, and
8570–8575. Patients who did not receive radical surgery
or aged 18 years or younger were excluded. In accordance with the requirement of using SEER database [9],
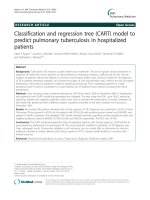
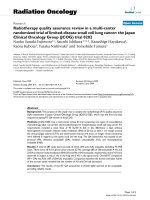
we obtained the data agreement. Figure 1 displayed the
Fig. 1 Flow chart of patients’ selection
flow chart of patients’ selection procedure in this study.
SEER database conducted the follow-up for all patients,
and the information of patients’ follow-up time, survival
status and survival time were all recorded. Therefore we
could investigate the follow-up time and OS for these
patients. In this study, the missing data that could not
use to assess the survival status was eliminated before
statistics.
Jia et al. BMC Cancer
(2020) 20:666
Statistical analysis
Demographic and clinical variables adopted in the further analysis included age, gender, ethnicity, primary
tumor location, anatomic sites, histological subtype,
tumor extent, differentiation, clinical stage, tumor size,
lymph node involvement, examined lymph node (ELNs),
positive lymph node (PLNs), chemotherapy and radiotherapy. Categorical variables were grouped for clinical
reasons, and the decisions regarding grouping were
made before data analysis. Mean, medians and ranges
were reported for continuous variables, as appropriate.
Frequencies and proportions were reported for categorical variables.
The primary endpoint of this study was cause-specific
survival. According to the COD code, we defined the
cause of death into three groups: lung cancer related,
other cancer related and non-cancer related. Cumulative
incidence function (CIF) was used to illustrate death
rate. The CIF was compared across groups by using
Gray’s test [10]. Fine and Gray competing risks proportional hazards regressions was performed to predict fiveand ten-year probabilities of the three causes of death
[11]. For nomogram construction, two thirds of the patients were randomly assigned to the training data set
(n = 31,415) and one third to the validation data set (n =
13,465). We used restricted cubic splines with three
knots at the 10, 50, and 90% empirical quantiles to
model continuous variables [12]. A model selection technique based on the Bayesian information criteria was
employed to avoid overfitting when establishing competing risk models (eTable S1) [13].
The performance of the nomogram included its discrimination and calibration was tested using the validation data set. Discrimination is the ability of a model to
separate subject outcomes, which is indicated by Harrell
C index [14, 15]. Calibration, which compares predicted
with actual survival, was evaluated with a calibration
plot. We used the validation set to compare the final reduced model-predicted probability of death with the observed 5 and 10-year cumulative incidence of death. The
predictions were supposed to fall on a 45-degree diagonal line if the model was well calibrated. In addition,
the bootstrapping technique was used for internal validation of the developed model based on 1000 resamples.
The R software (version 3.3.3; http:// www.r-project.org)
was performed for all statisitcal analysis. We used R packages cmprsk, rms and mstate for modeling and developing
the nomogram. The reported significance levels were all
two-sided, with statistical significance set at 0.05.
Results
Patient characteristics
A total of 44,880 NSCLC patients who received surgery
from 2004 to 2014 were included in this study. Most
Page 3 of 10
patients were diagnosed at stage I (62%), were Caucasians (83.5%) and received lobectomy (82.9%). The median diagnostic age was 67 years. The median follow-up
time was 31 months (IQR 12 to 61 months), and for still
alive patients, the median follow-up time was 42 months
(IQR 17–74 months). At last follow up, the death rate
was 41.9%, with 12,958 patients (28.9%) died from lung
cancer, 510 (1.1%) died from other cancers, and 5357
(11.9%) died from non-cancer causes. The most frequent
other cancer death were resulted from miscellaneous
malignant cancer (54.5%), brain and other nervous system (6.9%) and pancreas (3.5%) cancers. The most frequent non-cancer deaths were resulted from diseases of
heart (28.3%), chronic obstructive pulmonary disease
and associated conditions (19.8%) and cerebrovascular
diseases (5.8%) (Table 1).
Survival
Lung cancer related, other cancer related and noncancer related death probability were shown in eFigure
S1, S2, S3 and S4. Diagnostic age, gender, ethnicity, anatomic sites, histologic subtype, differentiation status,
clinical stage, tumor size, tumor extent, examined lymph
node, surgery type, showed significant relationships with
overall survival (P<0.001) (eTable S2). Five- and 10-year
lung cancer related death probability increased with age,
stage, tumor size, tumor extent, lymph node stage, positive lymph node numbers (P<0.001). Male patients had
higher lung cancer-related death rate compared with female patients (P<0.001). Ethnicity, histologic subtype,
anatomic sites of lung cancer, examined lymph node,
differentiation status, surgery type, showed significant
relationships with lung cancer related death probability
(P< 0.001). Patients who received chemotherapy and
radiotherapy had significant higher lung cancer related
mortality for NSCLC patients with surgery but were associated with significant lower non-cancer related death
rates (P<0.001) (Table 2).
Nomogram prognositc model
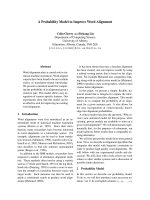
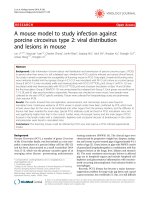
A nomogram model was established based on multivariate models of training data set. We could calculate the
5- or 10-year death rate by this nomogram prognositic
model (Fig. 2). Schoenfeld−type residuals of a proportional sub distribution hazard model for lung cancer related deaths were shown in eFigure S5. In the validation
cohort, the unadjusted C-index was 0.73 (95% CI, 0.72–
0.74), 0.71 (95% CI, 0.66–0.75) and 0.69 (95% CI, 0.68–
0.70) for lung cancer related death, other cancer related
death and non-cancer related death. This indicated that
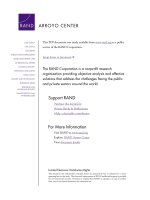
the models are convincingly precise. Figure 3 illustrated
the CIF plot calibration. Good coincidence between predicted and actual outcomes was observed because the
points are close to the 45-degree line.
Jia et al. BMC Cancer
(2020) 20:666
Page 4 of 10
Table 1 Patient Characteristics
Characteristics
All Patient
Training Cohort
Validation Cohort
(N = 44,880)
(N = 31,415)
(N = 13,465)
Number
%
Number
%
Number.
%
Diagnostic Age, years
Mean
66.7
66.7
66.8
Median
67
67
67
Range
18–101
18–101
18–96
Gender
Female
22,737
50.7
15,884
50.6
6853
50.9
Male
22,143
49.3
15,531
49.4
6612
49.1
White
37,487
83.5
26,316
83.8
11,171
83
Asian
3159
7
2160
6.9
999
7.4
Black
3939
8.8
2742
8.7
1197
8.9
Others/Unknown
295
0.7
197
0.6
98
0.7
Left-sided
18,752
41.8
13,103
41.7
5649
42
Right-sided
26,128
58.2
18,312
58.3
7816
58
Upper
26,831
59.8
18,766
59.7
8065
59.9
Middle
2152
4.8
1491
4.7
661
4.9
Lower
14,237
31.7
9940
31.6
4297
31.9
Bronchus/Others
1660
3.7
1218
3.9
442
3.3
ADC
21,933
48.9
15,321
48.8
6612
49.1
SCC
12,593
28.1
8871
28.2
3722
27.6
BAC
4746
10.6
3292
10.5
1454
10.8
ADSC
1279
2.8
909
2.9
370
2.7
Ethnicity
Primary tumor location
Anatomic sites
Histologic subtype
LCC
1279
2.8
900
2.9
379
2.8
Others
1327
3
923
2.9
404
3
Unspecified
1723
3.8
1199
3.8
524
3.9
Well
6146
13.7
4292
13.7
1854
13.8
Moderately
19,882
44.3
13,884
44.2
5998
44.5
Poorly
17,783
39.6
12,485
39.7
5298
39.3
Undifferentiated
1069
2.4
754
2.4
315
2.3
I
27,825
62
19,476
62
8349
62
II
6715
15
4681
14.9
2034
15.1
III
7982
17.8
5653
18
2329
17.3
IV
2358
5.3
1605
5.1
753
5.6
Differentiation
Clinical stage
Tumor size, cm
Mean
3.4
3.4
3.4
Median
2.8
2.8
2.8
Range
1–20
1–20
1–20
Jia et al. BMC Cancer
(2020) 20:666
Page 5 of 10
Table 1 Patient Characteristics (Continued)
Characteristics
All Patient
Training Cohort
Validation Cohort
(N = 44,880)
(N = 31,415)
(N = 13,465)
Number
%
Number
%
Number.
%
Local
29,526
65.8
20,649
65.7
8877
65.9
Regional
14,836
33.1
10,404
33.1
4432
32.9
Distant
518
1.2
362
1.2
156
1.2
N0
32,207
71.8
22,539
71.7
9668
71.8
N1
6809
15.2
4733
15.1
2076
15.4
N2
5700
12.7
4027
12.8
1673
12.4
N3
164
0.4
116
0.4
48
0.4
Tumor extent
Lymph node stage
Examined lymph node
Mean
9.9
10
9.9
Median
8
8
8
Range
1–90
1–90
1–90
0.8
0.8
0.8
Median
0
0
0
Range
0–41
0–41
0–39
Positive lymph node
Mean
Type of surgery
Lobectomy
37,203
82.9
26,056
82.9
11,147
82.8
Pneumonectomy
2830
6.3
1978
6.3
852
6.3
Sub-lobar
4847
10.8
3381
10.8
1466
10.9
None
31,835
70.9
22,214
70.7
9621
71.5
Yes
13,045
29.1
9201
29.3
3844
28.5
None
39,049
87
27,357
87.1
11,692
86.8
Yes
5831
13
4058
12.9
1773
13.2
Lung cancer related death
12,958
28.9
9154
29.1
3804
28.3
Other cancer related death
510
1.1
352
1.1
158
1.2
Non-cancer related death
5357
11.9
3743
11.9
1614
12
Chemotherapy
Radiotherapy
Follow-up, months
Mean
39.8
39.8
39.9
Median
31
30
31
Range
0–131
0–131
0–131
ADC adenocarcinoma, ASDC adenosquamous carcinoma, BAC bronchoalveolar carcinoma, SCC squamous cell carcinoma, LCC large cell carcinoma
Discussion
To our knowledge, this is the largest population based
study establishing a novel nomogram prognostic model
predicting lung cancer related death rate, other cancer
related death rate, and non–cancer related death rate for
NSCLC patients who received surgery in SEER database.
Recent studies showed that several factors including
tumor size, lymph node metastasis, clinical stage, age, etc.
were associated with long time survival for lung cancer patients with surgery. However, the results were heterogeneous for the reason that most studies evaluating the
prognosis of NSCLC had relative short follow-up with
limited sample size. Therefore larger sample data with
more validated and rigorous statistical methods were required. Besides, the population-based SEER database
could be used with the ability to assess this issue on a
Jia et al. BMC Cancer
(2020) 20:666
Page 6 of 10
Table 2 Five and 10-year lung cancer related, other cancer related and non-cancer related death probability
Characteristics
Lung cancer related death probability
Other cancer related death probability
Non-cancer related death probability
5 Year
10 Year
5 Year
10 Year
5 Year
10 Year
(%)
(%)
(%)
(%)
(%)
(%)
Diagnostic Age, years
P
< 0.001
P
0.159
< 0.001
< 45
28.1
36.9
0.4
0.4
4.5
8.2
45–64
31.7
39.6
1.4
1.6
7.3
14.2
65–74
33.6
41.4
1.2
1.9
12.3
23.3
≥ 75
37.0
44.3
1.4
1.7
19.6
34.2
Female
29.9
38.7
1.2
1.7
9.8
19.3
Male
37.3
44.1
1.4
1.7
14.2
24.9
Gender
< 0.001
Ethnicity
0.146
< 0.001
< 0.001
< 0.001
< 0.001
White
33.8
41.5
1.3
1.7
12.4
22.7
Asian
31.2
41.4
0.8
1.2
8.5
16.1
Black
34.2
40.8
2.0
2.2
10.8
20.4
Others/Unknown
23.7
24.8
0.3
0.3
9.8
36.1
Left-sided
34.1
41.9
1.3
1.7
12.2
23.2
Right-sided
33.3
41.0
1.3
1.7
11.9
21.4
Primary tumor location
0.09
Anatomic sites
0.676
< 0.001
0.097
0.45
0.032
Upper
31.9
39.2
1.3
1.7
12.0
23.1
Middle
33.6
41.5
1.2
1.5
11.7
18.9
Lower
35.2
44.0
1.2
1.7
12.4
21.4
Bronchus/Others
47.3
53.2
1.7
1.9
10.8
16.6
33.4
42.2
1.3
1.7
10.3
19.6
Histologic subtype
ADC
< 0.001
0.04
< 0.001
SCC
35.2
40.9
1.3
1.6
16.6
29.1
BAC
23.8
33.8
0.8
1.5
8.4
16.2
ADSC
41.7
48.7
1.6
1.7
12.7
21.8
LCC
43.7
49.8
2.1
2.3
13.1
20.6
Other
29.0
40.6
1.1
1.1
7.2
17.9
Unspecified
41.4
45.6
1.9
2.2
11.3
20.1
17.3
26.5
0.7
1.2
9.1
20.5
Differentiation
Well
< 0.001
< 0.001
< 0.001
Moderately
31.5
40.2
1.1
1.6
12.8
22.4
Poorly
40.7
47.0
1.6
1.9
12.1
22.1
Undifferentiated
41.3
47.8
1.9
2.1
12.8
21.2
Clinical stage
< 0.001
< 0.001
< 0.001
I
22.0
30.0
1.0
1.4
13.1
25.7
II
46.5
53.1
1.5
1.9
11.8
18.7
III
53.5
61.1
1.8
2.2
9.7
16.1
IV
62.8
71.3
2.6
2.6
8.4
11.9
≤ 1.0
18.4
27.4
0.8
1.9
8.8
18.3
1.1 to 3.0
26.2
34.5
1.1
1.6
12.3
23.8
Tumor size, cm
< 0.001
P
< 0.001
< 0.001
Jia et al. BMC Cancer
(2020) 20:666
Page 7 of 10
Table 2 Five and 10-year lung cancer related, other cancer related and non-cancer related death probability (Continued)
Characteristics
3.1 to 5.0
Lung cancer related death probability
Other cancer related death probability
Non-cancer related death probability
5 Year
10 Year
5 Year
10 Year
5 Year
10 Year
(%)
(%)
(%)
(%)
(%)
(%)
39.6
47.2
1.5
1.7
12.8
22.6
P
P
5.1 to 7.0
47.6
53.8
1.5
1.9
11.0
17.9
> 7.1
57.6
62.1
1.8
2.5
10.2
15.6
28.0
35.9
1.1
1.5
12.5
23.8
Tumor extent
Local
< 0.001
< 0.001
< 0.001
Regional
60.3
65.9
2.0
2.7
13.1
16.9
Distant
43.8
51.3
1.6
2.0
11.0
19.1
25.2
33.2
1.1
1.5
12.9
25.0
Lymph node stage
N0
< 0.001
< 0.001
< 0.001
N1
49.6
56.7
1.5
2.0
10.9
16.6
N2/N3
59.0
66.3
1.9
2.2
8.8
14.0
34.5
42.7
1.5
1.9
13.2
24.7
Examined lymph node
<5
< 0.001
0.379
< 0.001
5 to 9
32.5
40.1
1.1
1.6
12.0
22.0
10 to 14
32.8
40.2
1.2
1.6
11.5
21.8
15 to 20
34.0
42.1
1.3
1.5
10.5
18.7
≥ 20
36.2
43.0
1.4
1.7
11.4
18.3
0
25.7
33.5
1.1
1.5
12.8
24.9
1
49.6
56.8
1.9
2.4
10.5
17.0
2
52.3
59.9
1.6
1.7
10.2
15.3
3
55.6
63.7
1.4
2.0
10.4
14.9
≥4
63.7
70.9
1.8
1.9
8.8
11.4
32.0
39.7
1.2
1.7
11.8
22.0
Positive lymph node
< 0.001
Type of surgery
Lobectomy
< 0.001
< 0.001
< 0.001
0.249
< 0.001
Pneumonectomy
51.0
57.6
1.7
1.8
11.5
17.4
Sub-lobar
35.7
43.9
1.3
1.8
14.4
26.7
None
28.2
35.5
1.2
1.7
14.0
26.1
Yes
46.4
54.9
1.4
1.8
7.3
13.0
Chemotherapy
< 0.001
Radiotherapy
0.214
< 0.001
< 0.001
< 0.001
< 0.001
None
30.0
37.7
1.2
1.6
12.5
23.3
Yes
56.9
64.3
1.9
2.1
8.8
14.8
larger sample with long follow-up, which can effectively
avoid biases. In this study, was collected a large population
of 44,880 resected NSCLC patients in SEER database.
Moreover, to make the bias minimized, we used a
novel and validated prognostic model. Nomogram has
been considered as a trustworthy method to generate
more accurate prediction of prognosis [16–18]. The performance of the nomogram may also have discrimination, thus calibration should be conducted using a
validation data set. Our study showed, the unadjusted C-
P
index was 0.73 (95% CI, 0.72–0.74), 0.71 (95% CI, 0.66–
0.75) and 0.69 (95% CI, 0.68–0.70) for lung cancer related death, other cancer related death and non-cancer
related death in the validation cohort. This indicated
that the models are convincingly precise. Besides, our
study showed good coincidence between predicted and
actual outcomes because the points are close to the 45degree line.
Our study showed 5- and 10-year lung cancer related
death probability increased with age, stage, tumor size,
Jia et al. BMC Cancer
(2020) 20:666
Page 8 of 10
Fig. 2 Nomogram model to predict 5- and 10-year (a) lung cancer, related (b) other cancer related, and (c) non-cancer related death rate in
resected NSCLC patients. Gender: F, female; M, male; Ethnicity: B, black; O, other; W, white; A, asian; Surgery: L, lobectomy; P, pneumonectomy; S,
sub-lobar; Differentiation: W, well differentiated; M, moderately differentiated; P, poorly differentiated; U, undifferentiated; Histology: ADC,
adenocarcinoma; ASDC, adenosquamous carcinoma; BAC, bronchoalveolar carcinoma; SCC, squamous cell carcinoma; LCC, large cell carcinoma;
O, other; U, unspecified NSCLC; Tumor extension: D, distant; L, localized; R, regional; Chemotherapy: N, none; Y, received chemotherapy;
Radiotherapy: N, none; Y, received radiotherapy
tumor extent, lymph node involvement, positive lymph
node numbers which were consistent with previous studies [3–6]. In our study, male patients had higher lung
cancer-related death rate compared with female patients.
Several studies have demonstrated that epidermal growth
factor receptor (EGFR) - tyrosine kinase inhibitors (TKIs)
could noticeably improve survival of EGFR positive mutation advanced NSCLC patients [19–22]. EGFR mutation is
the most common gene mutation in Asian female lung
adenocarcinoma patients, therefore the prognosis of
female lung cancer patients might be better. Our study
showed patients with radiotherapy were associated with a
significantly higher lung cancer related death rate. Radiotherapy was always performed to patients with more aggressive stage or, mediastinal lymph node metastasis and
these patients may originally have poor prognosis. However, the appropriate opportunity and indication of radiotherapy still need further investment.
Previous studies mainly focus on investigating lung
cancer related survival for NSCLC patients, studies
Jia et al. BMC Cancer
(2020) 20:666
Page 9 of 10
Fig. 3 Nomogram calibration plot in the validation set. The x-axis represents the mean predicted death probability. The y-axis represents actual
death rate. The solid line represents equality between the predicted and actual probability
with concern of other causes of death are limited. In
SEER database, the data of survival status, survival
months, cause-specific death classification was available and death resulting from other cancer and noncancer was also recorded. Therefore we could investigate calculate lung cancer related, other cancer related and non-cancer related death probability using
these data. We divided cause of death into lung cancer related, other cancer related and non-cancer related. In our study, the most frequent non-cancer
deaths were resulted from diseases of heart, chronic
obstructive pulmonary disease and associated conditions, and cerebrovascular diseases. Therefore the
complications of heart and respiratory system during
treatment procedures require closer monitoring.
There were also some limitations in this study.
First, some variables are not recorded in SEER database, such as disease progression time, specific
chemotherapy regimens, etc. Besides, we did not use
the 7th or 8th AJCC staging system in this study. We
selected patients in the SEER database from 2004 to
2014. The 6th AJCC staging system was applied for
all patients during the decade. But the 7th AJCC staging system had not been widely used before 2010.
The 8th AJCC staging system was applied after 2017.
Stage information from 2004 to 2010 could not be
accessed when using the 7th or 8th AJCC staging system. For the huge sample size, re-classification of patients was impossible. But there was no significant
difference between stage I to stage III patients according to different staging systems, which had no
significant impact on the study results.
Conclusions
A novel prognostic nomogram model using a large
population based database was constructed to predict
mortality for NSCLC patients who received surgery. This
validated prognostic model may be helpful to give information about the risk of death for these patients.
Supplementary information
Supplementary information accompanies this paper at />1186/s12885-020-07147-y.
Additional file 1: eTable S1. Proportional Subdistribution Hazards
Models of Death Rate. eTable S2. Prognostic factors for overall survival
by multivariable Cox regression. eFigure S1. Lung cancer related, other
cancer related and non-cancer related death rates by (A) age, (B) gender,
(C) race and (D) primary tumor location. eFigure S2. Lung cancer related,
other cancer related and non-cancer related death rates by (E) Anatomic
sites, (F) histology subtype, (G) differentiation and (H) clinical stage.
eFigure S3. Lung cancer related, other cancer related and non-cancer
related death rates by (I) tumor size, (J) tumor extent, (K) lymph node
involvement and (L) examined lymph nodes. eFigure S4. Lung cancer
related, other cancer related and non-cancer related death rates by (M)
positive lymph nodes, (N) surgery, (O) chemotherapy and (P)
radiotherapy. eFigure S5. Schoenfeld−type residuals of a proportional
subdistribution hazard model for lung cancer related deaths.
Abbreviations
ADC: Adenocarcinoma; ASDC: Adenosquamous carcinoma;
BAC: Bronchoalveolar carcinoma; HR: Hazard ratio; ICD-O: International
Classification of Diseases for Oncology; LCC: Large cell carcinoma; NAAC
CR: North American Association of Central Cancer Registries; NSCLC: Nonsmall cell lung cancer; OS: Overall survival; SEER: Surveillance, Epidemiology,
and End Results; SCC: Squamous cell carcinoma
Acknowledgments
We acknowledge SEER*Stat team for providing patients’ information.
Jia et al. BMC Cancer
(2020) 20:666
Page 10 of 10
Authors’ contributions
Conceptualization, B.J. and ZP.W.; formal analysis, QW.Z.; investigation, B.J.,
JJ.W., HY.S., J.Z., MN.W., TT.A., YY.W., ML.Z., JJ.L., X.Y., J.Z., HX.C., YJ.C., XY. Z, and
ZP.W; writing-original draft preparation, B.J.; writing-review and editing, B.J.;
supervision, ZP.W.; funding acquisition, ZP.W. All authors have read and approved the manuscript
9.
Funding
This study was funded by Science Foundation of Peking University Cancer
Hospital (18–02); Capital Clinical Characteristics and Application Research
(Z181100001718104); Beijing Excellent Talent Cultivation Subsidy Young
Backbone Individual Project (2018000021469G264). The funders had no role
in study design, data collection and analysis, decision to publish, or
preparation of the manuscript.
12.
10.
11.
13.
14.
15.
Availability of data and materials
Data files were downloaded directly from the SEER website.
16.
Ethics approval and consent to participate
We signed the ‘Surveillance, Epidemiology, and End Results Program DataUse Agreement’ in accordance with the requirement of using SEER database.
Therefore, we obtained the data using permission and could download data
from the SEER database.
Consent for publication
Each author satisfies the criteria for authorship. No individual person’s data
was applicable in this manuscript.
17.
18.
19.
20.
Competing interests
The Authors Declared No Potential Conflicts of Interest.
21.
Surveillance, Epidemiology, and End Results Program. Data use agreement
for the 1973-2014 SEER Research Data File. />access.html#agreement. Accessed Mar 23, 2017.
Gray RJ. A class of k-sample tests for comparing the cumulative incidence
of a competing risk. Ann Stat. 1988;16:1141–54.
Fine JP, Gray RJ. A proportional hazards model for the subdistribution of a
competing risk. J Am Stat Assoc. 1999;94:496–509.
Harrel FE. Regression modeling strategies: general aspects of fitting
regression models. New York: Springer; 2001.
Iasonos A, Schrag D, Raj GV, et al. How to build and interpret a nomogram
for cancer prognosis. J Clin Oncol. 2008;26:1364–70.
Harrell FE, Lee KL, Mark DB. Multivariable prognostic models: issues in
developing models, evaluating assumptions and adequacy, and measuring
and reducing errors. Stat Med. 1996;15:361–87.
Wolbers M, Koller MT, Witteman JC, et al. Prognostic models with
competing risks: methods and application to coronary risk prediction.
Epidemiology. 2009;20:555–61.
Harrell FE Jr, Lee KL, Mark DB. Multivariable prognostic models: issues in
developing models, evaluating assumptions and adequacy, and measuring
and reducing errors. Stat Med. 1996;15:361–87.
Han DS, Suh YS, Kong SH, et al. Nomogram predicting long-term survival
after d2 gastrectomy for gastric cancer. J Clin Oncol. 2012;30:3834–40.
Karakiewicz PI, Briganti A, Chun FK, et al. Multi-institutional validation of a
new renal cancerspecific survival nomogram. J Clin Oncol. 2007;25:1316–22.
Maemondo M, Inoue A, Kobayashi K, et al. Gefitinib or chemotherapy for
non-small-cell lung cancer with mutated EGFR. N Engl J Med. 2010;362:
2380–8.
Mitsudomi T, Morita S, Yatabe Y, et al. Gefitinib versus cisplatin plus
docetaxel in patients with non-small-cell lung cancer harbouring mutations
of the epidermal growth factor receptor (WJTOG3405): an open label,
randomised phase 3 trial. Lancet Oncol. 2010;11:121–8.
Zhou C, Wu YL, Chen G, et al. Erlotinib versus chemotherapy as first-line
treatment for patients with advanced EGFR, mutation-positive non-small-cell
lung cancer (OPTIMAL, CTONG-0802): a multicentre, open-label, randomised,
phase 3 study. Lancet Oncol. 2011;12:735–42.
Rosell R, Carcereny E, Gervais R, et al. Erlotinib versus standard
chemotherapy as first-line treatment for European patients with advanced
EGFR mutation-positive non-small-cell lung cancer (EURTAC): a multicentre,
open-label, randomised phase 3 trial. Lancet Oncol. 2012;13:239–46.
Author details
1
Key Laboratory of Carcinogenesis and Translational Research (Ministry of
Education/Beijing), Department of Thoracic Medical Oncology, Peking
University Cancer Hospital & Institute, 52 Fucheng Road, Haidian District,
Beijing 100142, China. 2Department of Epidemiology and Biostatistics, School
of Public Health, Peking University, Beijing, China. 3Department of General
Practice, The Third Affiliated Hospital, Sun Yat_Sen University, Guangzhou,
China.
22.
Received: 5 March 2020 Accepted: 7 July 2020
Publisher’s Note
Springer Nature remains neutral with regard to jurisdictional claims in
published maps and institutional affiliations.
References
1. Siegel RL, Miller KD, Jemal A. Cancer statistics, 2016. CA Cancer J Clin. 2016;
66:7–30.
2. Chen W, Zheng R, Baade PD, et al. Cancer statistics in China, 2015. CA
Cancer J Clin. 2016;66:115–32.
3. Wood DE. National Comprehensive Cancer Network: NCCN clinical practice
guidelines in oncology: non-small cell lung cancer. Thorac Surg Clin. 2018;
25(2):185.
4. Liang W, Zhang L, Jiang G, et al. Development and validation of a
nomogram for predicting survival in patients with resected non-small-cell
lung cancer. J Clin Oncol. 2015;33(8):861–9.
5. Won YW, Joo J, Yun T, et al. A nomogram to predict brain metastasis as the
first relapse in curatively resected non-small cell lung cancer patients. Lung
Cancer. 2015;88(2):201–7.
6. Zhang J, Gold KA, Lin HY, et al. Relationship between tumor size and
survival in non -small cell lung cancer (NSCLC): an analysis of the
surveillance, epidemiology, and end results (SEER) registry. J Thorac Oncol.
2015;10(4):682–90.
7. Surveillance, Epidemiology, and End Results (SEER) Program (www.seer.
cancer.gov) Research Data (1973-2014), National Cancer Institute, DCCPS,
Surveillance Research Program, Surveillance Systems Branch, released March
2017, based on the March 2017 submission. www.seer.cancer.gov. Accessed
23 March 2017.
8. Wingo PA, Jamison PM, Hiatt RA, et al. Building the infrastructure for
nationwide cancer surveillance and control--a comparison between the
National Program of cancer registries (NPCR) and the surveillance,
epidemiology, and end results (SEER) program (United States). Cancer
Causes Control. 2003;14:175–93.