fraction times grade 6 Bộ Sách Toán THCS Của Mỹ
Bạn đang xem bản rút gọn của tài liệu. Xem và tải ngay bản đầy đủ của tài liệu tại đây (2.36 MB, 64 trang )
Fraction
Times
Number
CuuDuongThanCong.com
/>
Mathematics in Context is a comprehensive curriculum for the middle grades.
It was developed in 1991 through 1997 in collaboration with the Wisconsin Center
for Education Research, School of Education, University of Wisconsin-Madison and
the Freudenthal Institute at the University of Utrecht, The Netherlands, with the
support of the National Science Foundation Grant No. 9054928.
The revision of the curriculum was carried out in 2003 through 2005, with the
support of the National Science Foundation Grant No. ESI 0137414.
National Science Foundation
Opinions expressed are those of the authors
and not necessarily those of the Foundation.
Keijzer, R., van Galen, F., Gravemeijer, K., Abels, M., Dekker, T., Shew, J. A., Cole,
B. R., Brendeful, J. and Pligge, M. A. (2006). Fraction times. In Wisconsin Center
for Education Research & Freudenthal Institute (Eds.), Mathematics in Context.
Chicago: Encyclopædia Britannica, Inc.
Copyright © 2006 Encyclopædia Britannica, Inc.
All rights reserved.
Printed in the United States of America.
This work is protected under current U.S. copyright laws, and the performance,
display, and other applicable uses of it are governed by those laws. Any uses not
in conformity with the U.S. copyright statute are prohibited without our express
written permission, including but not limited to duplication, adaptation, and
transmission by television or other devices or processes. For more information
regarding a license, write Encyclopædia Britannica, Inc., 331 North LaSalle Street,
Chicago, Illinois 60610.
ISBN 0-03-039619-0
3 4 5 6 073 09 08 07 06
CuuDuongThanCong.com
/>
The Mathematics in Context Development Team
Development 1991–1997
The initial version of Fraction Times was developed by Ronald Keijzer, Frans van Galen,
and Koeno Gravemeijer. It was adapted for use in American schools by Julia A. Shew,
Beth R. Cole, and Jonathan Brendefur.
Wisconsin Center for Education
Freudenthal Institute Staff
Research Staff
Thomas A. Romberg
Joan Daniels Pedro
Jan de Lange
Director
Assistant to the Director
Director
Gail Burrill
Margaret R. Meyer
Els Feijs
Martin van Reeuwijk
Coordinator
Coordinator
Coordinator
Coordinator
Sherian Foster
James A, Middleton
Jasmina Milinkovic
Margaret A. Pligge
Mary C. Shafer
Julia A. Shew
Aaron N. Simon
Marvin Smith
Stephanie Z. Smith
Mary S. Spence
Mieke Abels
Nina Boswinkel
Frans van Galen
Koeno Gravemeijer
Marja van den
Heuvel-Panhuizen
Jan Auke de Jong
Vincent Jonker
Ronald Keijzer
Martin Kindt
Jansie Niehaus
Nanda Querelle
Anton Roodhardt
Leen Streefland
Adri Treffers
Monica Wijers
Astrid de Wild
Project Staff
Jonathan Brendefur
Laura Brinker
James Browne
Jack Burrill
Rose Byrd
Peter Christiansen
Barbara Clarke
Doug Clarke
Beth R. Cole
Fae Dremock
Mary Ann Fix
Revision 2003–2005
The revised version of Fraction Times was developed by Mieke Abels and Truus Dekker.
It was adapted for use in American schools by Margaret A. Pligge.
Wisconsin Center for Education
Freudenthal Institute Staff
Research Staff
Thomas A. Romberg
David C. Webb
Jan de Lange
Truus Dekker
Director
Coordinator
Director
Coordinator
Gail Burrill
Margaret A. Pligge
Mieke Abels
Monica Wijers
Editorial Coordinator
Editorial Coordinator
Content Coordinator
Content Coordinator
Margaret R. Meyer
Anne Park
Bryna Rappaport
Kathleen A. Steele
Ana C. Stephens
Candace Ulmer
Jill Vettrus
Arthur Bakker
Peter Boon
Els Feijs
Dédé de Haan
Martin Kindt
Nathalie Kuijpers
Huub Nilwik
Sonia Palha
Nanda Querelle
Martin van Reeuwijk
Project Staff
Sarah Ailts
Beth R. Cole
Erin Hazlett
Teri Hedges
Karen Hoiberg
Carrie Johnson
Jean Krusi
Elaine McGrath
CuuDuongThanCong.com
/>
(c) 2006 Encyclopædia Britannica, Inc. Mathematics in Context
and the Mathematics in Context Logo are registered trademarks
of Encyclopædia Britannica, Inc.
Cover photo credits: (left to right) © Comstock Images; © Corbis;
© Getty Images
Illustrations
35, 39 Holly Cooper-Olds
Photographs
1 (left to right) © Corbis; Don Couch/HRW Photo; HRW Photo/Marty
Granger/Edge Productions; 4 HRW Photo/Marty Granger/Edge Productions;
7 © Corbis; 8 (left to right) HRW Photo/Marty Granger/Edge Productions;
© Brand X Pictures; © John A. Rizzo/PhotoDisc/Getty Images; 9 © Bettmann/
Corbis; 14 © Corbis; 15 ( top) © ImageState; (middle) © G. K. & Vikki Hart/
Getty Images/PhotoDisc; (bottom) © Corbis; 16 HRW Photo/Marty Granger/
Edge Productions; 18 Don Couch/HRW Photo; 19 HRW Photo/Marty
Granger/Edge Productions; 24 (top right) HRW Photo/Marty Granger/Edge
Productions; (left) © PhotoDisc/Getty Images; 25 © Corbis; 26 Thomas
Spanos/Encyclopædia Britannica, Inc.; 28 © PhotoDisc/Getty Images;
33 (top) © BananaStock Ltd.; (bottom) Don Couch/HRW Photo; 35 HRW
Photo/Marty Granger/Edge Productions; 37 © Corbis; 38, 39 Don Couch/
HRW Photo; 43, 44 © PhotoDisc/Getty Images
CuuDuongThanCong.com
/>
Contents
Letter to the Student
Section A
Survey Results
The Newspaper
Favorite Colors—
From Bar Charts to Pie Charts
Just for Teens
Summary
Check Your Work
Section B
14
16
18
20
22
24
Students
Parents
10
0
20
…
…
…
…
40
30
50
30
Cats
Dogs
Rabbits
15
10
5
25
27
29
30
32
Ratios, Fractions, Decimals,
and Percents
Friends Come First
Headlines
Polling for Mayor in Klondike
Summary
Check Your Work
Section E
2
4
10
11
Festival and the Decimal
Connection
The Gold Rush
The Treasure Chest
Fractions and Decimals
Summary
Check Your Work
Section D
1
It Adds Up
Pet Survey
Airplane Survey
Comparisons
Compare, Subtract, Add
Summary
Check Your Work
Section C
vi
33
35
38
40
41
Fractional Parts
Recycled Fractions
What Fraction Saved?
Summary
Check Your Work
43
44
46
46
Additional Practice
47
Answers to Check Your Work
51
Contents v
CuuDuongThanCong.com
/>
Dear Student,
Have you ever noticed all the numbers and graphs in the newspaper?
Reporters use numbers and graphs to highlight important information
in a story. Take a look at today’s newspaper headlines and you’ll see
what we mean.
In this unit, you will learn how to use numbers and graphs to describe
important events and information. You will learn how to convert
among ratios, decimals, fractions, and percents, and you will discover
when it is better to choose one type of number over another.
You will also learn how to add and subtract fractions. Knowing this,
you will be able to conduct surveys and compare the results using
fractions, percents, ratios, bar charts, and pie charts.
We hope you enjoy investigating the Fraction Times news clippings
and other articles from your local newspapers.
Sincerely,
The Mathematics in Context Development Team
y
ajorit s Safe
M
e
g
e
Lar
r Plan
e
d
i
s
Con
One
Six A Out of
“Fly merica Every
ing I
n
s Da s Says,
nger
ous”
More
Indic Than 15
Are Uate That Percen
t
Plan
nsaf
es
e
3 Consider
__
4
Flying Safe
with
m
e
l
rob
%
“No P ,” Say 80
Flying
Abo
“Fly ut Oneing I Thir
s Ha d Sa
zard y,
ous”
vi Fraction Times
CuuDuongThanCong.com
/>
A
Survey Results
The Newspaper
Reporters for the newspaper Fraction Times use charts and graphs
with their articles to help readers understand the information. Here
is the front page of Fraction Times.
Fraction Times
Inside: Bar
Graphs and
Pie Charts
ESTABLISHED 1990
Jada Washington
MONDAY, AUGUST 28, 2003
Beatrice Flores
Enrique Caston
Two-Thirds Surveyed
Against Health Bill
Weather: Hot
and sunny, high
in the mid-80s
50 CENTS
Mike Johnson
Lauren Cook
Business
Decrease in Music DVDs
0%
100%
Increase in DVD Movies
0%
100%
By Enrique Caston
A national survey was conducted last week asking
whether voters were in favor of Health Bill 407.
The bill goes in front of the house later this week.
It states that health insurance
should be paid for
by the employer.
Unsure
For
About two-thirds of
the
the people polled
bill
were against the
proposed health bill.
Only a small fraction
of respondents were for
the bill, leaving even fewer
people unsure.
Against
the bill
Music Downloading Hurts
Local Sales of Music DVDs
By Lauren Cook
DVD City, a local DVD
Sales store, recently
reported that its sales
have decreased this year
because so many people
are downloading music
from the Internet. “This
year’s sales of music
DVDs are down 23% from
last year’s sales,” said
store owner Jim Roberts.
An increase of 37% in
DVD movie purchases
has allowed the store
to remain profitable,
however.
1. a. What types of charts do you see on the front page of Fraction
Times?
b. Without reading the articles, summarize the information in
each chart.
Section A: Survey Results 1
CuuDuongThanCong.com
/>
Favorite Colors — From Bar Charts
to Pie Charts
For this activity, you need:
•
•
•
•
Student Activity Sheet 1
markers or crayons
scissors
tape
Select your favorite color.
Red l l l l
ll
Ask everyone in your class to choose a favorite color. List the
favorite colors chosen in your class and tally the number of
students who choose that color. Don’t forget to include yourself!
To represent the results, cut out one complete bar from
Student Activity Sheet 1. Each segment of the bar can
represent a classmate participating in the survey.
Color the bar to show the number of students
who like each color. For example, if seven
students chose red as their favorite color,
color seven consecutive segments of the
bar red. Do this for all of the colors chosen
by the students in your class.
• How many students participated in the survey?
• How many students chose each color? Write the fraction for
each color.
Now you can use the bar chart to make a pie chart.
Cut off the segments you didn’t color.
Form a ring with the colors facing inside. Tape both ends of
the bar together to form the ring.
Place the ring on a sheet of paper and draw a circle by tracing
around the ring’s inside edge.
2 Fraction Times
CuuDuongThanCong.com
/>
On your paper, mark inside the circle
where the different colors begin and
end.
Finally, remove the ring to complete
the pie chart.
Now mark the color sections in the circle.
Estimate the location of the center of the circle.
Connect the marks you made on the edge of
the circle with the center of the circle.
Each “pie piece” is a section of the circle.
Color each section to correspond to the color on the tape.
Ms. Green’s class did the same Favorite Color Activity on the computer.
Here are the results.
Ms. Green
…
…
0
10
…
20
…
…
30
40
50
30
Red
8
Yellow
4
Green
5
Blue
10
Orange
3
2. Look at the survey results from Ms. Green’s class and the survey
results from your class. How do the results compare? Write four
conclusions. For each conclusion, write what you used as a source:
the numbers, the pie chart, or the bar chart.
Section A: Survey Results 3
CuuDuongThanCong.com
/>
A Survey Results
Just for Teens
Fraction Times plans to launch a new section called “Just for Teens.”
Each Saturday, Fraction Times will feature an article on young people’s
books, movies, music, and food. Surveys will be used to investigate
what teens are most interested in.
Enrique Caston is the book reviewer. He asked two teachers to conduct
surveys about students’ favorite types of books. Here is what he found.
Mr. Jackson’s class (20 students)
Ms. Lee’s class (40 students)
Mystery . . . . . . . . . . . . . . . . . . . . . . . . . . . . . 0
Mystery . . . . . . . . . . . . . . . . . . . . . . . . . . . . . 5
Adventure . . . . . . . . . . . . . . . . . . . . . . . . 10
Adventure . . . . . . . . . . . . . . . . . . . . . . . . 15
Science Fiction
Science Fiction
...................5
...................4
Biography . . . . . . . . . . . . . . . . . . . . . . . . . . 0
Biography . . . . . . . . . . . . . . . . . . . . . . . . . . 0
Humor . . . . . . . . . . . . . . . . . . . . . . . . . . . . . . 5
Humor . . . . . . . . . . . . . . . . . . . . . . . . . . . . . 16
Enrique Caston
Fraction Times Reporter
3. a. Use two bars from Student Activity Sheet 1 to show each
class’s results.
b. Whose class prefers adventure books?
c. Explain why it will be easier for Enrique to compare the data
if the bars have the same number of segments.
d. Use two new bars from Student Activity Sheet 1 to show
each class’s results so that both bars have the same number
of colored segments. Do not paste the bar charts in your
notebook yet. You will need them in problem 5.
e. Compare the survey results.
Enrique wants to see how pie charts show the same survey
information as the color bars. He begins with Mr. Jackson’s class.
He thinks, “A pie chart for these results is easy to make, because 10
out of 20 is half the class, and 5 out of 20… .”
4. a. Complete Enrique’s thoughts.
b. In your notebook, draw a circle and use this drawing to make a
pie chart for Mr. Jackson’s class. Be sure to include a chart key.
4 Fraction Times
CuuDuongThanCong.com
/>
Survey Results A
5. a. Make a pie chart for Ms. Lee’s class results using the bar chart
you made in problem 3d.
b. On your paper, show a bar chart and pie chart for each class.
Write the fraction of the class choosing each category.
c. What is obvious in a pie chart that is not as obvious from a
bar chart?
The “Just for Teens” staff is writing a weekly education column. They
ask several classes, “What is your favorite school subject?” The survey
results from two sixth-grade classes are shown here.
Ms. Byrd’s class (20 students)
Mr. Chaparro’s class (30 students)
Social Studies . . . . . . . . . . . . . . . . . . . . . . . . 0
Social Studies . . . . . . . . . . . . . . . . . . . . . . . . 3
Math . . . . . . . . . . . . . . . . . . . . . . . . . . . . . . . . . . 15
Math . . . . . . . . . . . . . . . . . . . . . . . . . . . . . . . . . . 15
English
English
................................5
................................0
Science . . . . . . . . . . . . . . . . . . . . . . . . . . . . . . . . 0
Science . . . . . . . . . . . . . . . . . . . . . . . . . . . . . . . . 2
Physical Education . . . . . . . . . . . . . . . . . . 0
Physical Education. . . . . . . . . . . . . . . . . 10
Mr. Chaparro’s class is larger than Ms. Byrd’s class. This makes it
more difficult to compare the results than it would be if the classes
were the same size.
6. a. Use Student Activity Sheet 2 to cut out two bars. Even though
the class sizes differ, be creative and show the data using bars
that have the same number of segments. Keep these bars
handy because you will use them again in problem 7.
b. Write a fraction to represent the number of students in each
class who prefer each subject.
Section A: Survey Results 5
CuuDuongThanCong.com
/>
A Survey Results
Peter works in the design department of Fraction Times. He uses a
computer applet to create pie charts. The pie charts created from the
Favorite Subject survey are shown here.
............
............
............
............
............
7. a. Peter’s screen is shown on Student Activity Sheet 3. Use
the results of the Favorite Subject survey in problem 6 to
complete the missing details.
b. Use the bar charts you created for problem 6 to form two
new rings.
c. Compare your rings to Peter’s pie charts on Student Activity
Sheet 3. How closely do the section categories match up?
d. Write a fraction to represent the number of students in each
class who prefer each subject.
6 Fraction Times
CuuDuongThanCong.com
/>
Survey Results A
8. Reflect Help the staff of “Just for Teens” by writing a short article
about the Favorite Subject survey. Use fractions to compare the
two classes.
You can use two bars with the same number of segments to compare
two groups of different sizes. Ratio tables can help you determine the
number of segments to include in the bar. For example, if you want to
compare a class of 25 students to a class of 20 students:
4 segments
for each
student
Number of Segments per Student
1
2
3
4
Total Number of Segments
25
50
75
100
Number of Segments per Student
1
2
3
4
5
Total Number of Segments
20
40
60
80
100
5 segments
for each
student
The number 100 is a common multiple of 25 and 20.
Note that 200, 300, 400, … are also common multiples of 25 and 20.
In Joshua’s class, 7 out of 30 students each has a cat. In Marlene’s
class, 11 out of 45 students each has a cat. To compare these data,
you can create bar charts that have the same number of segments.
9. a. Find three numbers that are common multiples of 30 and 45.
b. If you use the same size bars, how many segments would you
use for the students in Joshua’s and Marlene's classes?
c. For each class, how many segments would you color to show
the number of students who owned cats? Explain how you
determined this number.
d. Which class owns more cats? Explain.
e. Which is more: 7 out of 30 or 11 out of 45? Explain.
Section A: Survey Results 7
CuuDuongThanCong.com
/>
A Survey Results
Lauren Cook is the food critic for
“Just for Teens.” She wants to know
teens’ favorite foods. Here are survey
results from two classrooms.
Lauren Cook
Fraction Times Reporter
Mr. Clune
Ms. Grath
0
…
10
…
20
…
…
30
40
50
36
Chicken
6
Pizza
12
Tacos
18
Hamburger
Mr. Clune
0
Ms. Grath
0
10
…
…
20
…
…
30
40
24
Chicken
4
Pizza
12
Tacos
6
Hamburger
2
8 Fraction Times
CuuDuongThanCong.com
/>
50
Survey Results A
Lauren draws conclusions from the data. She notices, “More students
in Mr. Clune’s class prefer chicken than in Ms. Grath’s class.”
10. a. Explain how this conclusion can be correct.
b. Explain how this conclusion can be wrong.
11. Summarize the food data from both classes. Include your most
interesting findings about the data.
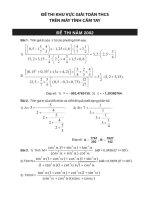
Math History
Florence Nightingale (1820 –1910)
Nursing pioneer Florence Nightingale was not
the first person to use diagrams for presenting
statistical data. However, she was the first to use
them for convincing people of the need for change.
With this diagram, she showed that injured soldiers
were more likely to die from diseases in a hospital
(indicated by the blue outer wedges) than from
wounds on the battlefield (indicated by the red
wedges in the center).
A
ug
us
Bulcaria
April
1854
M
e
Jun
er
temb
Sep
ay
t
July
r
be
m
y
ar
No
ve
r
rc
Ma
h 18
55
Octob
er
D ec
Fe
br
u
r
embe
Janua
ry 18
55
Section A: Survey Results 9
CuuDuongThanCong.com
/>
A Survey Results
Data from two classes with different numbers of students can be
represented in several ways. For example, you can compare 3 out
of 10 students to 4 out of 15:
•
using two bars of different sizes that have the same number of
segments as the number of people in that group:
A bar of 10 segments
•
A bar of 15 segments
using bars that have the same number of segments:
Ratio tables can help you to find the number of segments to
include in the bar.
Number of Segments per Student
1
2
3
Total Number of Segments
10
20
30
Number of Segments per Student
1
2
Total Number of Segments
15
30
30 is a common multiple of 10 and 15.
Two bars of 30 segments
10 Fraction Times
CuuDuongThanCong.com
/>
1 out of 10 is
the same as
3 out of 30
1 out of 15 is
the same as
2 out of 30
Summary Text
•
Using fractions:
3
3 out of 10 is 10
᎐᎐
.
3 out of 10 is the same as
9
9 out of 30, which is ᎐᎐
.
30
•
4
4 out of 15 is ᎐᎐
.
15
4 out of 15 is the same as
8
8 out of 30, which is ᎐᎐
.
30
Using pie charts:
Ms. Garbett wonders what sports her students watch on TV. To make
it interesting, she surveys students and their parents. Here are results
for each group that was asked, “What is your favorite sport to watch
on TV?”
Students (20)
Parents (30)
Football . . . . . . . . . . . . . . . . . . . . . . . . . . . . . 8
Football. . . . . . . . . . . . . . . . . . . . . . . . . . . . 10
Basketball . . . . . . . . . . . . . . . . . . . . . . . . . . 5
Basketball . . . . . . . . . . . . . . . . . . . . . . . . . . 5
Hockey
Hockey
.............................2
.............................3
Tennis . . . . . . . . . . . . . . . . . . . . . . . . . . . . . . . 1
Tennis . . . . . . . . . . . . . . . . . . . . . . . . . . . . . . . 6
Baseball
Baseball
............................4
............................6
1. a. Use Student Activity Sheet 2 to create a bar chart that
summarizes the data from each group. Include labels to
show how the colors correspond to the sports.
b. Create a pie chart for each group, Students and Parents.
Include chart keys.
c. For each group, write the fraction that corresponds to each
sport category.
d. Which group prefers to watch basketball?
Section A: Survey Results 11
CuuDuongThanCong.com
/>
A Survey Results
Ms. Garbett and her class enjoy discussing the students’ and parents’
preferences. They decide to conduct more surveys. Here are computer
results from each group that was asked, “What is your favorite pet?”
Students
Parents
0
…
10
…
20
…
…
30
40
50
20
Cats
8
Dogs
10
Rabbits
Students
2
Parents
0
10
…
…
20
…
…
30
40
30
Cats
15
Dogs
10
Rabbits
5
12 Fraction Times
CuuDuongThanCong.com
/>
50
2. a. For each group, write the fraction that corresponds to each
category.
b. Summarize the pet data from both groups. Include your most
interesting findings from the data.
3. Conduct your own survey and summarize the results. You might
survey your classmates’ favorite TV shows, hobbies, or bands.
Provide the category choices for your question. Asking a few
students your questions before conducting the survey can help
you identify the categories. Include a bar chart and pie chart
in your summary. Use Student Activity Sheet 1 to display
your findings.
Do you think it is easier to read a bar chart or a pie chart? Explain why
you think so.
Section A: Survey Results 13
CuuDuongThanCong.com
/>
B
It Adds Up
Pet Survey
Jada Washington writes the “At Home” section of Fraction Times.
While researching an article on dog ownership, she found this
summary of a survey.
Leading Benefit and Drawback of Dog Ownership
Leading Benefit: Companionship
317
407
Leading Drawback: Care While Away
Jada Washington
Fraction Times Reporter
183
407
In her article, Jada uses simple fractions to describe the survey results.
1. a. Explain why the benchmark fraction 4–3 is a good estimate to
represent the number of people who named “companionship”
as the major benefit of owning a dog.
b. Which benchmark fraction can be used as an estimate to
represent the number of people who named “care while
away” as a major drawback of owning a dog?
Jada gave the graphs to the art department and asked an artist to
sketch pie charts that show the same information. The graphic artist
sketched the following pie charts.
Leading Benefit
Other
Leading Drawback
Care
While
Away
Companionship
14 Fraction Times
CuuDuongThanCong.com
/>
It Adds Up B
2. a. Reflect Compare the bar charts and pie charts. Which do
you prefer?
b. Do the percentages in the pie charts seem reasonable?
Explain.
Jada wants to know how many pets people own. For her survey,
she randomly called 30 people and used fractions to summarize
the survey results.
•
•
•
•
•
᎐16᎐ have no pets.
᎐12᎐ have one pet.
᎐16᎐ have two pets.
᎐1᎐ have three pets.
10
᎐1᎐ have four or more pets.
15
3. a. Of the 30 people surveyed, how many have two pets?
b. Use Student Activity Sheet 2 to show the results of Jada’s
survey in a bar chart.
c. What fraction of the people surveyed have either no
pets or one pet?
Jada creates a fraction summary for another pet survey.
•
•
•
•
᎐13᎐ like dogs best.
᎐13᎐ like cats best.
᎐15᎐ like fish best.
The rest of the people like some other type of animal best.
The number of people who are involved in a survey is called the
sample size.
The survey summary above does not give information about the
sample size.
4. a. How many people do you think were surveyed? Explain
your reasoning.
b. Name some other possible sample sizes for this survey.
c. Use a bar from Student Activity Sheet 2 to determine
what fraction of the people questioned like some other
type of animal.
Section B: It Adds Up 15
CuuDuongThanCong.com
/>
B It Adds Up
Airplane Survey
Mike Johnson writes the travel section for Fraction Times. He is
working on an article about airline passenger satisfaction.
Airlines have cut back on food service. Mike conducts a survey and
uncovers some information about what airline passengers think
about food service cuts.
Mike Johnson
•
᎐13᎐ of the passengers miss getting a meal and were happy with
the quality of the food before the cutbacks.
•
᎐14᎐ of the passengers miss getting a meal; however, they were not
happy with the quality of food before the cutbacks.
•
᎐16᎐ of the passengers are happy that meals are rarely served on
airlines anymore.
Fraction Times Reporter
5. a. Summarize the survey information using a bar from Student
Activity Sheet 2. Hint: Find any possible sample size.
b. Mike considers the fraction of people who indicated they miss
getting meals on airlines. What is this fraction?
Mike finds that ᎐35᎐ of airline passengers are pleased with the way
airlines handle baggage and ᎐14᎐ are not pleased.
6. Summarize the baggage information using a bar from Student
Activity Sheet 2.
Mike wonders if people are nervous flying. Of the people surveyed,
half are nervous and ᎐25᎐ are not nervous.
There is an extra category not given in the information: the people
surveyed who did not share their opinion on being nervous.
7. a. What fraction of the people surveyed did not share an opinion
on being nervous? Explain how you know.
b. Explain how you can find out that there is another category
not given in the information.
16 Fraction Times
CuuDuongThanCong.com
/>
It Adds Up B
All of Mike’s survey information was presented using fractions. In his
feature on Airline Passenger Satisfaction, Mike needs to consider other
ways of conveying the survey information.
8. Reflect Name other ways to describe the information. Illustrate
using examples.
Mike found a survey in which an independent organization had asked
people their opinions about the safety of flying. The results were
printed in several newspapers. Here are six different headlines about
the survey.
One
Out
y
t
a
i
b Six
of E
r
o
j
e
A
a
f
m
a
M
S
“Fly erica very
Large er Planes
ing I
ns S
s
d
i
s
D
ange ays,
Con
rous
”
c
More
Indic Than 15
Are Uate That Percen
t
Plan
nsaf
es
e
ith
w
m
ble
o
r
%
P
0
8
y
“No
Sa
”
,
g
n
Flyi
e
d
f
_3_ Consider
4
Flying Safe
Abo
“Fly ut Oneing I Thir
s Ha d Sa
zard y,
ous”
Do all of these headlines say the same thing?
9. Compare the headlines. Which headlines describe the same
message on airline safety? Which are different?
Section B: It Adds Up 17
CuuDuongThanCong.com
/>
B It Adds Up
Comparisons
Beatrice Flores writes the business section for Fraction Times. She
compares the Computer Division and the Communication Division
at Bulk Electronics Company.
Bulk Electronics
A. Research Investment
Computer Division
Communications
Beatrice Flores
Fraction Times Reporter
B. Productivity
Computer Division
Communications
C. Market Share
Computer Division
Communications
1
᎑᎑
4
1
᎑᎑
3
of its profit
of its profit
3
᎑᎑
of the capacity
4
3
᎑᎑
of the capacity
5
1
᎑᎑
2
2
᎑᎑
5
of the market
of the market
D. Workforce
Computer Division
2
᎑᎑
are male
3
Communications
5
᎑᎑
are male
6
10. a. Help Beatrice compare each division by shading the bars on
Student Activity Sheet 4. You can use what you know about
fractions to find out which parts should be colored.
b. For each category—A, B, C, and D—compare the two fractions
and write which one in each pair is larger.
The shaded parts on your first two bars show that the Computer
Division profit contribution is less than the Communication Division
profit contribution. But drawing bars and shading them is a lot of work.
11. How would you explain that ᎐14᎐ is less than ᎐13᎐ without drawing
and shading a bar?
18 Fraction Times
CuuDuongThanCong.com
/>
It Adds Up B
In order to serve healthier drinks, many schools
are replacing soda machines with juice machines.
Lauren Cook investigates the amount of real fruit
in two brands of apple juice.
Burst-o-Apple
᎐14᎐ apple juice
Apple Fizz
3
᎐᎐
10
apple juice
12. Which brand contains more apple juice?
How do you know?
Lauren Cook
Fraction Times Reporter
In her article, Lauren reports the difference between
the apple juice contents of Burst-o-Apple and Apple Fizz.
Lauren uses 40 segments for each bar. She gets tired of marking
segments, so she uses bars without segments. She still thinks of
the bars as having the same number of segments. She labels each
bar with the number of segments that the shaded part represents.
1
Since ᎏ
4 of 40 segments is 10 segments, she marks one bar like this.
10
40
3
1
For Apple Fizz, Lauren shades 10
᎐᎐
of the 40 segments. Since 10
᎐᎐
of 40
3
᎐᎐ of 40 segments is 12 segments. She
segments is four segments, 10
marks the second bar like this.
12
40
2
᎐᎐
.
Laura can now see that the difference is two segments, or 40
Section B: It Adds Up 19
CuuDuongThanCong.com
/>