second chance grade 7 Bộ Sách Toán THCS Của Mỹ
Bạn đang xem bản rút gọn của tài liệu. Xem và tải ngay bản đầy đủ của tài liệu tại đây (3.17 MB, 62 trang )
Second
Chance
Data Analysis and
Probability
CuuDuongThanCong.com
/>
Mathematics in Context is a comprehensive curriculum for the middle grades.
It was developed in 1991 through 1997 in collaboration with the Wisconsin Center
for Education Research, School of Education, University of Wisconsin-Madison and
the Freudenthal Institute at the University of Utrecht, The Netherlands, with the
support of the National Science Foundation Grant No. 9054928.
This unit is a new unit prepared as a part of the revision of the curriculum carried
out in 2003 through 2005, with the support of the National Science Foundation
Grant No. ESI 0137414.
National Science Foundation
Opinions expressed are those of the authors
and not necessarily those of the Foundation.
Bakker, A., Wijers, M., and Burrill, G. (2006). Second chance. In Wisconsin Center
for Education Research & Freudenthal Institute (Eds.), Mathematics in Context.
Chicago: Encyclopædia Britannica, Inc.
Copyright © 2006 Encyclopædia Britannica, Inc.
All rights reserved.
Printed in the United States of America.
This work is protected under current U.S. copyright laws, and the performance,
display, and other applicable uses of it are governed by those laws. Any uses not
in conformity with the U.S. copyright statute are prohibited without our express
written permission, including but not limited to duplication, adaptation, and
transmission by television or other devices or processes. For more information
regarding a license, write Encyclopædia Britannica, Inc., 331 North LaSalle Street,
Chicago, Illinois 60610.
ISBN 0-03-038558-X
1 2 3 4 5 6 073 09 08 07 06 05
CuuDuongThanCong.com
/>
The Mathematics in Context Development Team
Development 2003–2005
Second Chance was developed by Arthur Bakker and Monica Wijers. It was adapted for use in
American schools by Gail Burrill.
Wisconsin Center for Education
Freudenthal Institute Staff
Research Staff
Thomas A. Romberg
David C. Webb
Jan de Lange
Truus Dekker
Director
Coordinator
Director
Coordinator
Gail Burrill
Margaret A. Pligge
Mieke Abels
Monica Wijers
Editorial Coordinator
Editorial Coordinator
Content Coordinator
Content Coordinator
Margaret R. Meyer
Anne Park
Bryna Rappaport
Kathleen A. Steele
Ana C. Stephens
Candace Ulmer
Jill Vettrus
Arthur Bakker
Peter Boon
Els Feijs
Dédé de Haan
Martin Kindt
Nathalie Kuijpers
Huub Nilwik
Sonia Palha
Nanda Querelle
Martin van Reeuwijk
Project Staff
Sarah Ailts
Beth R. Cole
Erin Hazlett
Teri Hedges
Karen Hoiberg
Carrie Johnson
Jean Krusi
Elaine McGrath
CuuDuongThanCong.com
/>
(c) 2006 Encyclopædia Britannica, Inc. Mathematics in Context
and the Mathematics in Context Logo are registered trademarks
of Encyclopædia Britannica, Inc.
Cover photo credits: (left) © Creatas; (middle, right) © Getty Images
Illustrations
13 Christine McCabe/© Encyclopædia Britannica, Inc; 18 James Alexander;
26 Christine McCabe/© Encyclopædia Britannica, Inc; 27 Michael Nutter/
© Encyclopædia Britannica, Inc.; 31 Holly Cooper-Olds; 32 Christine McCabe/
© Encyclopædia Britannica, Inc.; 45 James Alexander
Photographs
2 (top) Mary Stone/HRW; (bottom) © Photodisc/Getty Images; 3 © Comstock,
Inc.; 4 John Langford/HRW; 5, 6 Victoria Smith/HRW; 7 Sam Dudgeon/HRW;
10, 12 Victoria Smith/HRW; 15 © Stone/Getty Images; 19 (top) M. Mrayati
from M. Mrayati et al., series on Arabic Origins of Cryptology, Vol. 1,
Al-Kindi’s Treatise on Cryptanalysis, published by KFCRIS and KACST,
Riyadh, 2003 (ISBN: 9960-890-08-2); 21 © Corbis; 25 Victoria Smith/HRW;
35 Victoria Smith/HRW; 41 © BananaStock
CuuDuongThanCong.com
/>
Contents
Letter to the Student
Section A
Make a Choice
Make a Choice
A Class Trip
Families
Number Cubes
Codes
Summary
Check Your Work
Section B
1
2
3
5
7
8
9
Second
Number Cube
Third
Number Cube
1
1
1
2
2
2
3
3
3
4
4
4
5
5
5
6
6
6
10
12
13
15
16
18
20
21
Home
School
In the Long Run
Heads in the Long Run
Fair Games?
The Toothpick Game
Guessing on a Test
Playing the Game of Hog
Summary
Check Your Work
Section D
First
Number Cube
A Matter of Information
Car Colors
A Word Game
Letter Frequency
Family Dining
Who Wears Glasses?
Watching TV
Summary
Check Your Work
Section C
vi
23
25
26
27
30
32
32
Computing Chances
The Game of Hog Again
A School Club Meeting
Tests
Summary
Check Your Work
35
38
40
42
43
Additional Practice
45
Answers to Check Your Work
51
Contents v
CuuDuongThanCong.com
/>
Dear Student
One thing is for sure: Our lives are full of uncertainty. We are not
certain what the weather tomorrow will be or if we are going to win
a game. Perhaps the game is not even fair!
In this unit you learn to count possibilities in smart ways and to do
experiments about chance. You will also simulate and compute
chances. What is the chance that a family with four children has four
girls? How likely is it that the next child in the family will be another
girl? You will learn to adjust the scoring for games to make them fair.
Sometimes information from surveys can be recorded in tables and
used to make chance statements.
Chance is one way to help us measure uncertainty. Chance plays
a role in decisions that we make and what we do in our lives! It is
important to understand how chance works!
We hope you enjoy the unit!
Sincerely,
The Mathematics in Context Development Team
vi Second Chance
CuuDuongThanCong.com
/>
A
Make a Choice
Make a Choice
Here are Robert’s clothes.
1. How many different outfits can Robert wear to school? Find a
smart way to count the different outfits.
Hillary says to Robert, “If you pick an outfit without looking, I think the
chance that you will choose my favorite outfit—the striped shirt, blue
pants, and tennis shoes—is one out of eight!”
2. Is Hillary right? Explain why or why not.
3. a. Which of the statements Robert makes about choosing his
clothes are true?
i “If I choose an outfit without looking, the chance that I pick
a combination with my striped shirt in it is four out of 16.”
ii “If I choose an outfit without looking, the chance that I pick
a combination with my tennis shoes in it is two out of 16.”
iii “If I choose an outfit without looking, the chance that I pick
a combination with both my tennis shoes and my striped
shirt is one out of eight.”
b. Write a statement like the ones above that Robert might make
about choosing his clothes. Your statement should be true
and begin with, “If I choose an outfit without looking, the
chance that I pick….”
Section A: Make a Choice 1
CuuDuongThanCong.com
/>
A Make a Choice
4. a. How many different outfits can Robert
wear if he buys another pair of pants?
b. If he buys another pair of pants, how
does the chance that Robert picks
Hillary’s favorite outfit (striped shirt,
blue pants, and tennis shoes) change?
Explain.
A Class Trip
Grade 7 in Robert’s school is planning a
two-day class trip to a lake for a science
field trip.
They can choose to go to one of four lakes:
Lake Norma, Lake Ancona, Lake Popo, or
Lake Windus.
Besides choosing the lake, the class has to
choose whether to camp out in a tent or to
stay in a lodge and whether to take a bus
tour around the lake or a boat trip.
The class has to make a lot of decisions!
5. a. Finish the tree diagram on Student Activity Sheet 1. Write the
right words next to all the branches in the tree.
b. Reflect How many different class trips are possible for Robert’s
class to choose?
c. How does this problem relate to the problem about the different
outfits Robert can choose?
d. How many possibilities are there if Robert’s class does not
want to go camping?
2 Second Chance
CuuDuongThanCong.com
/>
Make a Choice A
Lakes
Accomodation
Trip
Robert’s class finds it hard to decide which trip to choose. Different
students like different options. Fiona suggests they should just write
each possible trip on a piece of paper, put the pieces in a bag, and
pick one of the possible trips from the bag.
6. a. If Robert’s class picks one of the trips from the bag, what is the
chance that they will go camping?
b. What is the chance they will go to Lake Norma?
Families
Nearly as many baby girls as baby boys are born.
The difference is so small you can say that the
chance of having a boy is equal to the chance of
having a girl.
Sonya, Matthew, and Sarah are the children of
the Jansen family. A new family is moving into
the house next to the Jansen house.
They already know that this family has three
children about the same ages as Sonya, Matthew,
and Sarah. “I hope they have two girls and one
boy just like we have,” Sonya says, “but I guess
there is not much chance that will happen.”
7. Do you think the chance that a family with
three children where two are girls and one is
a boy will move in next door is more or less
than 50%? Explain your reasoning.
Section A: Make a Choice 3
CuuDuongThanCong.com
/>
A Make a Choice
The tree diagram shows different possibilities for a
family with two children.
8. a. How many different possibilities are there for
a family with two children?
G
B
b. Explain the difference between the paths BG
and GB.
c. What is the chance that a family with two
children will have two girls?
G
B
G
B
d. What is the chance that the family will not
have two girls? How did you find this chance?
You can express a chance as a ratio, “so many out
of so many,” but you can also use a fraction or a
percent. The chance of having two boys in a family
with two children is:
one out of four.
This can be written as 14– .
This is the same as 25%.
9. Reflect Explain how you can see from the tree
diagram that the chance of having two boys is
1 out of 4.
10. Write each of the chances you found in problems 6a, 6b, 8c, and
8d as a ratio, a fraction, and a percent.
11. a. In your notebook, copy the tree diagram from problem 8 and
extend it to a family with three children.
b. In your tree diagram, trace all of the paths for families with
two girls and one boy.
c. What is the chance that a family with three children will
have two girls and one boy? Write the chance as a ratio, as
a fraction, and as a percent.
12. a. What is the chance that a family with three children will have
three boys?
b. Write another chance statement about a family with three
children.
4 Second Chance
CuuDuongThanCong.com
/>
Make a Choice A
About 500 families with three children live in East Lynn.
13. Reflect Would you be surprised if 70 of these 500 families with
three children had three boys? Explain.
You can often find a chance by calculating:
the number of favorable outcomes
total number of possible outcomes
Number Cubes
Roll two number cubes of different colors 10 times.
List the combination you rolled, like “blue 2 and yellow 5.”
Work with three other classmates and list all of your outcomes.
Find a systematic way to make your list.
14. Did the four of you roll all possible combinations of the two
number cubes? Explain how you decided.
Section A: Make a Choice 5
CuuDuongThanCong.com
/>
A Make a Choice
You can use tree diagrams to count all possible outcomes of an event.
Sometimes you can count all the outcomes by using a chart. For
example, if you want to see all possibilities when throwing two
number cubes—a blue one and a yellow one—you can use this table.
Max rolled two number cubes. On Student Activity Sheet 2, you see
a circle marking the combination Max rolled.
15. a. What combination did Max roll with the number cubes? What
is the sum of the two number cubes he rolled?
b. Brenda rolled the same sum as Max, but she did not roll the
same combination. In the first chart on Student Activity
Sheet 2, circle all combinations Brenda may have rolled.
c. In the table at the bottom of Student Activity Sheet 2, write
the sum for each combination of rolling two number cubes.
Brenda thinks the chance of rolling a sum of eight with two number
cubes is the same as the chance of rolling a sum of three. She reasons:
With two number cubes you can roll a sum of 2, 3, 4, 5, 6, 7, 8, 9,
10, 11, or 12. This makes 11 possibilities in total, so the chance for
each of these outcomes is one out of eleven, which
1 , or about 9%.
is the same as —
11
16. a. Do you agree with Brenda? Why or why not?
b. Reflect What is the chance that you will roll a sum greater than
8 with two number cubes?
6 Second Chance
CuuDuongThanCong.com
/>
Make a Choice A
Jackie says that the chance of rolling a sum of either 9, 10, or 11 with
two number cubes is 25%. Tom says, “No, the chance is 9 out of 36.”
17. a. Is Jackie right? Explain.
b. What would you say to Tom?
18. a. Why is a chart like the one shown before problem 15 not useful
for listing all possibilities when throwing three number cubes?
b. What is the total number of possible results when throwing
three number cubes? How did you find this?
Codes
You need a code to open some school lockers as well
as to access ATM machines and often to open garage
doors. A four-digit code is used for the garage door
at Brenda’s home. The code is made up of numbers
from zero to nine. All of the numbers can be used
more than once.
For security reasons, if a wrong code is used three
times in a row, the garage door will stay locked for
the next half hour.
Brenda’s brother is at the garage door, but he forgot
the code. He only remembers it starts with 3–5, and
he knows for sure there is no 0 in the code.
So the code is:
3
5
—
—
(no zeros)
He decides to guess.
19. a. What is the chance that his first guess is correct?
b. Suppose the first guess is wrong. He keeps on guessing. How
likely do you think it is that he guesses wrong and the door
will remain locked for a half hour?
Suppose the code for the garage door consists of four letters instead
of four numbers, and Brenda’s brother remembers only the first two
letters of the code.
20. How will this change the chance that the garage door will remain
locked for half an hour?
Section A: Make a Choice 7
CuuDuongThanCong.com
/>
A Make a Choice
If you want to count the possible ways that
something can occur you can:
•
•
•
•
•
G
B
draw all different combinations as you
did for Robert’s clothes;
find a smart way to write down all
G
B G
B
possibilities, such as GG GB BG BB
(G for girl, B for boy) for a family with
two children;
use a tree diagram like the one showing the possibilities for the
families with three children;
use a table such as the one for tossing two number cubes;
use smart calculations as you did for the codes.
If you know all possible outcomes, and you know all outcomes have
the same chance of occurring, you can make statements about the
chance that certain outcomes may occur. You can do this by counting
how many times this outcome occurs compared to all possible
outcomes. The chance is:
number of favorable outcomes
total number of possible outcomes
For a family with two children, the four different outcomes GG, GB,
BG, and BB are equally likely. Two of those outcomes have a boy and
a girl. Therefore, the chance of having a boy and a girl in a family of
two children is two out of four, or one out of two.
You can express a chance either as a ratio, like “two out of four;” as
2
1 ; or as a percent, 50%.
a fraction, ᎑᎑
4 , which is the same as ᎑᎑
2
Think back to the trip Robert’s class is planning.
8 Second Chance
CuuDuongThanCong.com
/>
1. a. How can you calculate—without drawing a tree diagram—
how many possible trips Robert’s class can choose?
(See page 2.)
8 .”
—
Robert says, “The chance we will go on a boat trip is 16
Noella says, “I think this chance is 1 out of 2, or 50%.”
b. Comment on Robert’s and Noella’s statements.
Mario’s advertises, “We serve over 30 different three-course meals.”
Customers can choose soup or salad as an appetizer; fish, chicken,
beef, or a vegetarian dish for the main course; and fruit, ice cream, or
pudding for dessert.
2. Do you think Mario’s advertisement is correct? If yes, show why.
If no, give an example of a number of appetizers, main courses,
and desserts that will lead to more than 30 different meals.
Diana is having her birthday dinner at Mario’s. She decides to make a
surprise meal for herself by choosing each of the courses by chance.
3. a. What is the chance that Diana has a meal with soup and beef?
b. What is the chance that Diana has a meal without fish?
Diana does not like pudding. She thinks the chance that she will pick a
meal with pudding for dessert is very small. She says, “The chance
that I will pick pudding in my surprise meal is only one out of 24.”
4. a. Do you agree with Diana? Explain your answer.
b. How many meals are possible if pudding cannot be chosen?
Explain how finding the chance of an outcome using a tree diagram is
related to finding the chance using the rule:
chance ؍
number of favorable outcomes
total number of possible outcomes
You may use an example in your explanation.
Section A: Make a Choice 9
CuuDuongThanCong.com
/>
B
A Matter of Information
Car Colors
Sometimes chances can be found because you know and can count
all possible results or outcomes. You saw examples of this in
Section A.
In other situations, you can make statements about chance by
collecting information about the possible outcomes.
Cars come in different colors. Some car colors are more common
than others.
1. a. If you go out on the street where you live, what color car do
you expect to see most?
b. Do you think all of your classmates will have the same answer
for a? Why?
Janet and her sister Karji discuss car colors. Janet says that the
favorite color for cars in their neighborhood is white because white
cars are easy to see on roads. Karji argues that red is more common
because red is a lot of people’s favorite color. To find out who is right,
Janet and Karji record the colors of 100 cars in a parking lot nearby.
10 Second Chance
CuuDuongThanCong.com
/>
A Matter of Information B
The results are in the table.
2. a. By looking at the results in the
table can you tell who is right—
Janet or Karji? Explain.
b. Which chance do you think is
bigger—that the first car leaving
the parking lot is red or that the
first car leaving the lot is white?
Why?
Color
Number of Cars
Red
13
White
24
Other
63
Total
100
As a class, you are going to investigate car colors in a parking lot
or on the street.
First agree on four colors you want to record. Record cars that are
not one of those four colors as “other.”
Design a form on which you can record the car colors.
Record the colors of 25 different cars. Try to choose a different set
of cars from ones chosen by others in your class.
3. a. Combine the class results in one table. Make a graph of the
results.
b. Calculate the percentage of cars in each color.
Suppose all of the cars the class tallied in the activity were from
the same parking lot.
4. a. Which color car are you most likely to see leaving the
parking lot?
b. Is it possible that the first car entering the parking lot the day
after you counted colors is a color that you did not record
in the activity? Explain your answer.
c. Write three statements involving chance based on your
findings about car colors.
Section B: A Matter of Information 11
CuuDuongThanCong.com
/>
B A Matter of Information
A Word Game
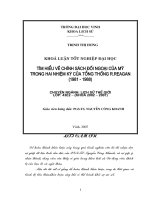
Brittney and Kenji are playing a word game. Brittney is guessing a
word that Kenji is thinking about. Kenji makes a row of ten dots, one
dot for each letter in the word he has in mind.
Now Brittney has to guess a letter. If the letter is correct, Kenji puts
the letter over the correct dot (or dots) in the word. If the letter is not
in his word, Kenji writes it down.
Brittney wins if she guesses the correct word before she has guessed
eight “wrong” letters. Kenji wins if Brittney guesses eight letters that
are not in the word and still hasn’t guessed his word.
Brittney first asks if the letter E is in the word.
5. Why do you think Brittney first chooses the letter E?
Kenji writes down: . E. . E . . . . E
Brittney tries A, O, I, and U.
Kenji wrote: . E . . E . . A . E
wrong: O I U
6. a. What do you think would be a good letter to ask about next?
Why do you think so?
b. Guess the word or finish the game. (Your teacher has the
answer!)
12 Second Chance
CuuDuongThanCong.com
/>
A Matter of Information B
Letter Frequency
Not all languages use the same letters equally often.
7. a. Which letter do you think is used most frequently in the
English language?
b. Which letter do you think might occur the least often in the
English language?
This table shows the average letter frequency in typical written
English.
English Letter Frequency
Letter
%
Letter
%
8.17
6.75
1.49
7.51
2.78
1.93
4.25
0.10
12.70
5.99
2.23
6.33
2.02
9.06
6.09
2.76
6.97
0.98
0.15
2.36
0.77
0.15
4.03
1.97
2.41
0.07
c. How close were your answers for parts a and b? What are the
most and least used letters according to this table?
8. Reflect If you know how frequently letters are used in writing, do
you think this will help you when playing the Guess My word
game? Why or why not?
Section B: A Matter of Information 13
CuuDuongThanCong.com
/>
Take a newspaper article or a text from any book. With a classmate,
record the first 100 letters in this text in a frequency table.
9. Use Student Activity Sheet 3a to make a graph of the
frequencies for each letter.
10. a. What is the most common letter in your selection? Was this
the same for every pair of students in your class?
b. Compare your graph with your classmates’ graphs. What do
you notice?
11. a. On Student Activity Sheet 3b, combine the letter frequency
graphs you made in problem 9 into one class graph.
b. Write three lines comparing the graph to the letter frequency
table.
The results of an experiment or data collection can be used to estimate
the chance an event will occur. Chances found this way are called
experimental chances.
12. Use the data in your frequency table from problem 11 to answer
the following:
a. If you close your eyes and select a letter from a newspaper,
estimate the chance that you pick an O.
b. As a class, compare your answers in part a by making a dot
plot on the number line of the estimated chances. Use the plot
to help you write a sentence about the probability of selecting
the letter O from a newspaper with your eyes closed.
c. Estimate the chance of picking three other letters. Choose one
with a high probability of being picked and another with a low
probability of being picked.The third one can be any letter you
want. Write each answer as a fraction and as a decimal.
14 Second Chance
CuuDuongThanCong.com
/>
A Matter of Information B
Family Dining
Instead of collecting information about possible outcomes yourself
in order to make chance statements, you often can use information
collected by others.
Do students often have dinner with their families? Researchers were
interested in answering this question. They surveyed students aged
12 to 17, and the results are in the table below.
These results can be graphed:
Number of Days a Week
Children (Age 12–17)
Have Dinner with Their Family
Percentage
Don’t know
1%
0
5%
1
6%
2
7%
3
11%
4
10%
5
12%
6
7%
7
41%
How Often Children Eat Dinner
with Family
Percent of Families Surveyed
50
40
30
20
10
0
Source: National Center on Addiction and Substance Abuse
Don’t
Know
0
1
2
3
4
5
6
7
Number of Days a Week
13. a. If the researchers interviewed 3,000 families, how many
reported eating together more than five days a week?
b. If one of the families in the study is picked at random,
what is the chance that the family eats together more
than five days a week?
c. Use your answer for part b to find out what the chance
is that a family in the study picked at random eats
together five days a week or fewer.
14. a. Is the chance that a family eats together seven days a
week greater than, the same as, or less than the chance
that they do fewer than five days a week? Explain how
you found your answer.
b. What is the chance that a family does not eat together
two days a week?
Section B: A Matter of Information 15
CuuDuongThanCong.com
/>
B A Matter of Information
Who Wears Glasses?
Some people wear glasses, and some people don’t. It is not easy to
estimate what the chance is that the first person you meet on the
street will be wearing glasses.
Joshua announced that he thinks more men than women wear
glasses.
15. a. What do you think about Joshua’s statement?
b. How could you figure out whether or not it is true that men are
more likely to wear glasses than women?
This illustration was used in an advertisement for an orchestra.
16. Use the illustration to decide whether men or women in the
orchestra seem to be more likely to wear glasses. Explain
how you came to your conclusion.
16 Second Chance
CuuDuongThanCong.com
/>
A Matter of Information B
Counting men and women with and without glasses can tell you—for
those you counted—how many men and women wear glasses. But
counting just the number who wear glasses cannot tell you what the
chance is that a person wears glasses.
17. Suppose that you randomly select a man from the orchestra.
Estimate the chance that this man wears glasses. Explain how
you made your estimate.
The two-way table summarizes the information about whether or not
the musicians in the illustration wear glasses.
Men
Women
Total
Glasses
32
3
35
No Glasses
56
39
95
Total
88
42
130
A member of the orchestra is chosen at random.
18. a. What is the chance that the person chosen wears glasses?
b. If you were told that the person is a woman, would you change
your answer for part a?
Chance can be expressed in different ways.
You can express a chance as a ratio, like 35 out of 130.
35 .
–––
You can use a fraction, like 130
35 Ϸ 0.269 Ϸ 27%.
You can use decimals or percents such as –––
130
Sandra states, “The chance that a randomly chosen woman in the
orchestra does not wear glasses is 39 out of 42, which is almost 100%.”
Juan states, “I don’t agree. The chance that a randomly chosen
woman in the orchestra does not wear glasses is 39 out of 130,
which is only 30%.”
19. a. Explain how Sandra and Juan may have reasoned.
b. Do you agree with Sandra or with Juan? Explain your thinking.
Look at the musicians in the illustration again.
20. How many musicians could you draw glasses on to make it appear
that “wearing glasses is as likely for men as for women”?
Section B: A Matter of Information 17
CuuDuongThanCong.com
/>
B A Matter of Information
Watching TV
The seventh grade class in Robert and Hillary’s school surveyed all of
the students in grades 7 and 8 to find out how much television they
watched each day. Some of their results are in the two-way table.
21. a. Finish the table of Robert and Hillary’s survey.
Less Than 3 Hours
of TV per Day
Grade 7
3 Hours or More
of TV per Day
35
Grade 8
Total
Total
40
50
50
b. Is there a difference between the number of hours students in
grade 7 and students in grade 8 watch TV?
22. a. What is the chance that a student chosen at random from
Robert’s school watches three hours or more of TV a night?
b. If you knew that the student was in grade 7, would you change
your answer for part a? Explain why or why not.
c. If you find a student who watches TV more than three hours a
night, what is the chance that this student is in grade 8?
18 Second Chance
CuuDuongThanCong.com
/>
A Matter of Information B
Math History
Frequency Analysis
Knowing letter frequencies is useful for winning games
like Hangman and also for cracking codes.
In the ninth century, an Arabian scientist named
Al-kindi wrote about a method for code-breaking
now known as frequency analysis. He discovered that
the variation in frequency of letters in a document can
be used to decipher encrypted text. This is a translation
of some Al-kindi text taken from The Code Book by
Simon Singh.
One way to solve an encrypted message, if you
know its language, is to find ordinary text of the
same language long enough to fill one sheet or
so, and then count the occurrences of each letter.
You can call the most frequently occurring letter
the “first.” The next most occurring letter the
“second,” the following most occurring letter
the “third,” and so on, until you have used all
the different letters in the sample.
Then we look at the coded text we want to solve, and
we also classify its symbols. We find the most occurring
symbol and change it to the form of the "first" letter of
the plain text sample; the next most common symbol
is changed to the form of the ”second“ letter; and the
following most common symbol is changed to the form
of the "third" letter; and so on, until we account for all
symbols of the cryptogram we want to solve.
You can use this frequency analysis method of
Al-Kindi to decipher the following encrypted
English text!
KL, KHUH L KDYH D VKRUW WHAW IRU
BRX WR GHFLSKHU, L JXHVV BRX FDQ
GHFUBSW LW.
You may make your own encrypted texts
using a device like this.
Section B: A Matter of Information 19
CuuDuongThanCong.com
/>