The effect of climate fluctuation on output in developing countries
Bạn đang xem bản rút gọn của tài liệu. Xem và tải ngay bản đầy đủ của tài liệu tại đây (939.45 KB, 59 trang )
UNIVERSITY OF ECONOMICS
INSTITUTE OF SOCIAL STUDIES
HO CHI MINH CITY
THE HAGUE
VIET NAM
THE NETHERLANDS
VIET NAM – THE NETHERLANDS PROGRAMME FOR MASTER IN
DEVELOPMENT ECONOMICS
-------------------------------------------
THE EFFECT OF CLIMATE
FLUCTUATION ON OUTPUT IN
DEVELOPING COUNTRIES
By
NGO KHANH LIEN HUONG
(VIETNAM)
Academic supervisor
Dr. PHAM KHANH NAM
This paper was submitted in partial fulfillment of the requirements
for Master’s degree in Development Economics
Ho Chi Minh City, July 2012
ACKNOWLEDGEMENTS
This paper has could not be started and completed without the help of several
individuals who supported me directly and indirectly. First of all, I appreciate my
supervisor Dr. Pham Khanh Nam so much for his enthusiastic assistance. He has not only
given me genuine intellectual guidance in academy but also encouraged me a lot through
the analysis process. It is so hard for me to complete this research without his profound
advice. Thus, I am very grateful to him. I am also thankful to Dr. Nguyen Trong Hoai for
sharing his knowledge and practice experiences in researching which are very useful for
this study. I also thank all my classmates in class MDE17 for sharing their advantage
discussions on econometric techniques, especially Nguyen Thi Thuy Thanh. Last but not
least, I would like to thank my parents, and all my other family members for their
concern and invaluable moral support.
~ i~
ABSTRACT
Climate change is one of the critical problems in recent years on over the world. It
impacts on many aspects of human life, that has a lot of researches and evident. This
paper has analysis the effect of climate change on the aggregate output particularly with
two typical elements: temperature and precipitation in developing countries. Besides,
control variables proxy unobserved effects at country level and country fixed effects are
also counted in the relationship of temperature and precipitation with the country’s
output. The finding shows that both temperature and precipitation have significant
influence on the GDP of developing countries. It is specially that temperature affects the
GDP in U-shaped, while precipitation affects the GDP in hump-shaped. Moreover, this
paper also conducts the relationship of temperature and precipitation with the output by
two characteristics: “hot country” and “agricultural country”. The results are also
significant; however, the relationship share cannot be identified. Further, this research
suggests some adaptive recommendations for production to changing of climate.
Key word: climate change, output, panel data, developing countries.
~ ii~
TABLE OF CONTENTS
CHAPTER 1: INTRODUCTION……………………………………………………….1
1.1.
Problem statement………………………………………………………………..1
1.2.
Research Objective……………………………………………………………….4
1.3.
Chapter summary………………………………………………………………...5
CHAPTER 2: LITERATURE REVIEW………………………………………………6
2.1. The theory……………………………………………………………………………6
2.2. Empirical studies………………………………………………………………...…7
2.3. Conceptual framework………………………………………………………...…17
2.4. Chapter summary……………………………………………………………...…19
CHAPTER 3: METHODOLOGY…………………………………………………….20
3.1. Econometric model…………..……………………………………………………20
3.2. Data……………………………………………………………………………..…24
3.3. Chapter summary……………………………………………………………...…27
CHAPTER 4: RESULT……………………………………………………………...…28
4.1. Descriptive statistics………………………………………………………………28
~ iii~
4.2. Non parametric analysis……...…………………………………………...………30
4.3. Econometric analysis……………………………………………………...………33
4.4. Chapter summary………………………………………………………...……….44
CHAPTER 5: CONCLUSION………………………………………………….……..45
5.1. Conclusion…………………………………………………………………………45
5.2. Recommendation……………………………………………………………..……47
REFERENCES…………………………………………………………………….……49
APPENDIX…………………………………………………………………………...…52
~ iv~
List of Tables
Table 3.1: Variable descriptions…………………………………………………………26
Table 4.1: Descriptions Statistic…………………………………………………………29
Table 4.2: Correlation matrix…………………………………………………………….30
Table 4.3: Temperature and Precipitation - Estimation Result……………………..……37
Table 4.4: Estimation result with hot countries dummy…………………………..…….40
Table 4.5: Estimation result with agriculture countries dummy………………………..42
List of Figures
Figure 2.1: The way climate fluctuation affects the country’s output…………..……...18
Figure 4.1: Histogram of temperature – precipitation – GDP per capita………….……28
Figure 4.2: Average temperature trend………………………………………………..…31
Figure 4.3: Average precipitation trend……………………………………………….…31
Figure 4.4: Average temperature vs Average GDP per capita…………………………..32
Figure 4.5: Average precipitation vs Average GDP per capita…………………………33
~ v~
CHAPTER 1: INTRODUCTION
1.1.
Problem statement
Increasing output is one of the most important targets of most of the countries,
especially developing countries. The output of a country has been identified in the
function of elements such as human capital, physical capital, and technology. However,
the changing of climate belongs to environment elements in recent years, which is
considered that it has a critical effect on country’s output. Further, the climate change has
economically effected on human health, life and production in agricultural countries,
which makes the studies more attractive and interesting.
Human activities have already changed the atmospheric characteristics such as
rainfall, global warming, sea level rise, increasing global carbon dioxide (CO2) emissions
and the thinning of ozone layer . Those climate changes happening constantly as a big
problem all over the world have impacted upon many aspects of human life such as
natural ecosystem, biodiversity, human health, landscape, socio-economic, etc. There are
obvious evidences that climate change affects human life (IPCC 2007). For example,
expanding water stress, increasing temperature but reducing the rainfall has caused a
decline in agricultural production in Asian developing countries while demands for
production are increasing more and more. Climate change has affected the supply,
demand, and quality of water resources. For instance, Northern Pakistan has been facing
water shortages because of expanding winter period over the Himalayas during last 40
years; China is facing up to the drying up of rivers and lake in the dry weather while
1
water need is increasing. Likewise, In India, Bangladesh, and Nepal, water shortage is
aggravated by climate change; consequently it has leaded to rising urbanization, and
using water inefficiently. Contrary to the water shortage, glaciers are melting rapidly in
Central Asia, which has threatened human settlement, cities, forest ecosystem, and the
rising of water level caused the disasters of landslides. The 1997/98 El Nĩno event in
Philippines and Indonesia fired around 2 million ha of peatlands, 9.7 million hectares of
forest (IPCC 2007). That is the extreme climatic event caused substantial fatalities and
economic losses. Climate change puts over 50% biodiversity of the Asia at risk, so many
species could be fragmented or extirpated such as pine forest in Korea or beech tree in
Japan (IPCC 2007). Other critical sector relating to climatic influence is human health.
Siberia has been reported a big number of deaths associated with heatwaves, while there
is a spreading disease like diarrhoeal, cholera, malaria, etc. due to poor drinking water
and sewerage system in flood season. Malnutrition and Diarrhoeal are posed as
substantial risk of human health in year 2000 at Bangladesh, India, Nepal, Maldives, and
Myanmar under climate change (IPCC 2007). Specially, the effects of climate change on
the countries having high temperature climate and agriculture share has been considered
profoundly. Those heavy effects are explained that hot climate countries are sensitive to
any small change of temperature, while agricultural countries are sensitive to the
changing of precipitation. Development activities of human are continuously creating
greenhouse gas, one of the causes of climate chance, although they also contribute to
enhancing adaptation greatly and decreasing vulnerability of vulnerable sectors to the
changing of climate. In general, climate change affects human life through different
2
channels such as societal (e.g. migration, civilization, culture), psychological (e.g. mental
illness, cognition), physiological (e.g. nutrition, starvation), and economic (e.g. energy,
manufacturing) aspect.
In recent years, there are a lot of researches working on influences of climate change.
The most interesting sector is the climate change’s economic consequences. Climate
change is the result of greenhouse gas emission from human activities. Hence, finding out
the relationship between climate change and output will help suggest the policies or
adaptation strategies in socio-economic sectors to control the effects of climate change
within each country. Furthermore, we can adjust the changes of climate at our will toward
increasing output. For instance, the Kyoto Protocol’s main target is to balance greenhouse
gas emission (CO2, CH4, N2O, SF6…) in our environment to prevent dangerous effects
from harming the existence and improvement of the human beings. This required
developed countries to reduce greenhouse gas, and submit annual activity reports;
meanwhile, developing countries are encouraged to joint this protocol.
Existing studies about the relationship between climate change and the aggregate
output have been quite rare until now. Most of them were conducted for the countries of
OECD (Organization for Economic Cooperation and Development), which are strongly
impacted by temperature because they belong to the relatively low temperature areas. For
some other countries, studies mainly focused on the suffering of separate sectors under
climate change such as food production, fish catching, forest, or agriculture. Moreover,
other published researches estimate the effect of climate change on economic growth
3
based on CO2 level. My thesis mainly examines the effects caused by the fluctuation of
climate, temperature and precipitation on aggregate GDP of the developing countries
with the data from 1990 to 2006.
1.2.
Research Objective
The overall research objective of my study is to investigate the impact of climate
fluctuation on country’s aggregate output with individual national characteristics within
developing countries. I am going to consider the economic impact of climate change in
the short run on output under two typical elements: temperature and precipitation.
Besides, my study also discusses some national characteristics, called control effects such
as Inflation, GDP per capita growth, population density, urban population, and
unemployment. Moreover, according to Del (Dell et al, 2008), developing countries
move toward to be more agricultural and hotter. The reason is pointed out that developing
countries focus on agriculture which requires low capital, technology, labor skill level
(Tol, 2002). Furthermore, high temperature is advantage condition for increasing pests,
pathogens, etc which depreciates agricultural (Masters and McMillan, 2001; and John,
2009). Therefore, my objective also conducts the effect of climate fluctuation on
developing countries with two special characteristics “hot” and “agriculture”.
My research questions are “Is the relationship between temperature, precipitation and
the output of developing countries significant? - Do the impacts of temperature and
precipitation vary across “hot country” and “agriculture country”?
4
This thesis considers the relationship between temperature, precipitation and output,
which is divided into five chapters. Chapter 1 introduces the problem statement and
research objective. The Reviewing of empirical studies about the influence of climate
change on the output is presented in Chapter 2 – Literature review. Chapter 3 shows how
I collect data for this paper and set up the model. Chapter 4 reports the economic result of
regression, and the discussion about comparing with other literature. The last chapter,
Chapter 5 is used for conclusion and recommendation.
1.3.
Chapter summary
This chapter has introduced the problem statement that the effect of climate change on
the world’s economy has been happening constantly. Thus, the changing of climate is
essential concerned topic, especially in the aspect of the output. The aim of this paper is
conducting the research on the impact of climate fluctuation on the aggregate output of
the developing countries, then answering two questions: “Is the relationship between
temperature and precipitation with the output of developing countries significant? Do the
impacts of temperature and precipitation vary across “hot country” and “more agriculture
country”?
5
CHAPTER 2: LITERATURE REVIEW
2.1. The theory
To demonstrate the relationship between climate and output, I follow the research of
John (2009) and Mankiw et al (1992), which is based on the Solow-Swan model.
According to this model, the climate is considered as “natural resource” input in the
Cobb-Douglas production function:
yt = atkαt hβt T-γt
with yt is output per capita, kt is physical capital per capita, ht is human capital per capita,
and Tt represents the climate in average temperature at year t. at is all exogenous countryspecific variables, which may be composed of temperature in history T0. Thus we specify
at = AtT0-Ø with At is considered as an technology input of exogenous elements. The
exponents α, β, γ, and Ø are assumed positive and identical across countries. The γ and Ø
capture the impact of historical and contemporaneous temperature. Let’s suppose that the
saving rates for physical and human capital per capita: sk and sh are constant; there are
constant depreciation: δ and constant population growth: n. When Tt = T0 = T and if
steady-state output per capita exists, y* will be formed:
ln y* = ψlnT – (α +β)ϴ ln(n+g+ δ) + αϴ ln(sk) + βϴ ln (sh) + ϴ lnAt
(1)
with ψ = - (γ + Ø)ϴ and ϴ = 1/(1 - α - β). Thus, average temperature changes one percent
cause ψ percentage change of steady-state output. It is expected ψ < 0.
6
The equation (1) will be reformed by:
ln y* = Bt + ψ ln T
(2)
Bt is country-specific elements include saving rates, population growth, depreciation, and
technology changes.
2.2. Empirical Studies
The researches about the relationship between climate shock and economic activities
are expanding in many approaches. Generally, empirical studies can be divided into three
groups as summary of Tol (2009). First group is the studies which measure damaging
cost or influence cost function of climate change by statistical method. Another category
of studies concentrate on effect of climate on separate sectors, such as agriculture, fish
catching, forest. Final group analyses the effect of climate on aggregate income with
many different approaches. In this section, I will summarize some empirical literatures in
the order of time.
Masters and McMillan (2001) is one of the studies that consider temperature’s effect
on particular sectors, not on aggregate income. They used frost-free days as proxy for
temperature to test a role of frost frequency in overall economic performance. Their
regression includes dependent variable – growth of average income of a year, and
independent variables such as the scale of economy, seasonal frost, and control variables.
The scale of economy represents three different dimensions involving the size of
domestic population, direct of aggregate trade as one part of GDP, and linguistic barriers
7
in people’s communication. The frost variable was measured by average frost-day
number of each month in winter. Finally, other variables capture investment rate of the
countries (investment over GDP), human capital accumulation (school enrollment), trade
policy, and the quality of domestic institutions. Masters and McMillan (2001) have made
conclusions that the income level of temperate countries is higher than tropical countries,
which related to the expanding the market and economic scale. Their reasonable
explanation is that maybe climate assisted temperate regions in growth since they
transferred from agriculture into productivity sectors across countries; but it is contrast
with tropical countries. They also found out that frost can reduce pathogens and pest,
which is missed by considering under average temperature. Moreover, they identified that
the number of frost-free days significantly affects productivity and population density.
However, they went on to look at the effect of temperature, or frost on incomes.
Like Masters and McMillan (2001), Maddison (2003) also considers the impact of
climate on single sector, not on overall GDP; however, his topic is “the amenity value of
climate change” with approaching the household production function. He applied the
Household Production Function (HPF) theory which combines all marketed goods by a
fixed production technology. The HPF is commented that it can be the best motivation in
implication determining varieties of surveyed expenditures by climatic variables.
Moreover, the advantages of the procedure incorporating environmental variables and
demand equations are the nature of environmental amenities’ role in defining
consumption patterns clearly, and limitations of applying initiated utility functions is
8
already understood. The approach used two assumptions. First, based on the levels of the
environmental amenities, the fixed costs are not only translated but also added to or
subjected from the household operation; second, the effective prices of goods are
increased follow demographic scaling. Although these assumptions are required, they are
not necessary to be linear because it is a certainly offensive in the condition of climate
variables. The cross-sectional data of 60 countries is used to examine the climate role in
determining consumption then calculate price for a climate variables range of each
country. Madison (2003) concluded that climate change benefits on cold countries, while
in hot countries any temperature rising decreases welfare and changes in the cost of living
in those countries enormously. For further exercise, this author suggests more discussions
on this paper’s limitations. For example, under environmental amenities, what is the
different effect of demand system and commodity aggregations on prices; applying other
function forms which are more flexible to answer the climate is normal, luxury, or
inferior good; or using other variables relating to climate such as ratio of heating days,
precipitation.
There was one other type of studies about the impact of climate change on economic
measures and the range of climate effects on social welfare in a given period known as
Fankhauser and Tol (2004). They analysed the climate change dynamic effects and social
welfare with particular capital and saving formation, then pointed out how to maximize
future welfare. To set up their model, they based on DICE model which is considered as
the typical model of the world economic. DICE does not separate four channels: non
9
market, market, health, capital- through which growth is affected by climate, but it
excludes the emission reduction and fix temperature scenario. However, they run their
model by adjusting and combining four different models to make their regression be
available for their purposes. First, the Solow-Swan model is used to compare the climate
change impact directly on GDP with saving and technology are both exogenous. Second,
the Ramsey-Cass-Koopmans model which is the primary model structure of DICE is used
to compare the important of saving effect with the Solow-Swan model. This specification
has get saving rate is endogenous, but technical progress is exogenous. Third, in the
Mankiw-Romer-Weil growth model, savings are fixed and technology is exogenous.
Comparing this model with the Solow-Swan indicates unlike dynamic effects since
climate change influence human capital formation, but the saving rate is the same in the
Solow-Swan model. Finally, the Romer model is similar to the Mankiw-Romer-Weil
specification without human capital: savings are exogenous, technological progress is
endogenous. Fankhauser and Tol (2004) assumed that all saving rate and parameter in the
Romer model is equal in the Solow-Swan model. Generally, the first two models
highlighted physical capital formation, but climate change has less been vulnerable;
meanwhile it contrasts with the last two models. They have paid attention that with a
given savings rate, when climate change reduces output, it will also reduce investment,
which will lead to decrease capital accumulation or future production. Although this
paper is more representative for growth model, it still has limitations such as not suggest
policy for climate change, used closed economy. Therefore, they draw open directs for
further researches such as there are other channels through which changing of climate
10
impact growth, for example: structure economies, not yet saving and capital
accumulation; climate would affect the capital supply as well as investment ratio.
The study of Nordhaus (2006) directly estimates the impact of welfare, called the
statistical approach by using observed variations in prices and spending within single
country. He estimated the aggregate impact of climate on income for the world with
assuming that under respect of climate and geography, the economies are equilibrium in
long run. It is called “climate-economies equilibrium”. However, the climate-economies
equilibrium of those areas in which climate shock change very slowly is not reasonable.
His objective is examining that the farther from equator, the higher output per capital.
Other studies which used the observation unit are countries, meanwhile Nordhaus (2006)
tested the relationship between economic and geography by grid cells of each country. It
means that economic activity of the world is measured at one degree latitude by one
degree longitude scale. The reasons he explained for selecting are plentiful global
environment data, and statistical independent economic data. Although he developed
“gridded output” data, or called GCP whose concept is the same as gross domestic
production, he still had to use various methodologies to collect data for various group of
countries such as the United State, the high-income countries, the middle-income
countries, and the lowest-income countries. He run a multivariate equation including
dependent variable that is logarithm output per kilometer square, and independent
variables that are precipitation, temperature, geography variables such as soil categories,
coastline farness. One more difference between the studies of Nordhaus (2006) and other
11
economic growth theory is omitting endogenous variables: coastal density, capital
formation, technology, health status, education, etc; but focus on exogenous variables:
population, geography, etc. He compared the existing economic productivity with two
scenarios of climate change to measure the climate change impact. The first scenario is
assumed that there is only temperature change 30C, precipitation is unchanged; and the
result is that global warming reduce world output 0.93% GDP. Second scenario is which
gets both assumptions: temperature change as in the first, and precipitation decrease 15%
in mid-latitude regions, but precipitation raise 7% in others. The consequence of the
second indicates that climate change decline world output about 1.05% GDP, however,
assumptions of the second scenario are hard to establish because of lack of reality. He
also proved that the far from equator, the much rising of income per capital. Although
Nordhaus (2006) conducted the globe into a gross cell product which relies on one degree
latitude and one degree longitude by cross-sectional regression include temperature,
country-specific variable dummies, the result is need to be considered with caution. First,
approach weakens linkage between economic data and geographic data. Second, follow
his consequence, Africa’s geography actually has enormous economic disadvantage with
respect to temperature, but it is true in comparing with low-latitude countries. Third, the
negative impact of global warming and greenhouse gas was estimate significantly larger
than existing studies base on the G-Econ data. Fourth, the result pointed out that there
was positive relationship between economic activities and geographic condition,
especially on elements: temperature, coastal proximity, and precipitation.
12
In the same data collection manner with Nordhaus (2006), Choiniere and Horowitz
(2006) also used cross-section from 97 countries to conduct the income-temperature
correlation. Their specific objectives are discussing proposition that temperature will low
accumulate capital level in hot countries, and what will happen as global becomes
warmer in the future. In this paper, they added one more input – temperature – in the
Cobb-Douglas function; and according to Fankhauser and Tol (2004) they also adopt the
Mankiw-Romer-Weil and the Solow-Swan model to set up their regression. The scale,
human capital, function of labor, and physical capital are assumed to be constant.
Besides, they fixed country – specific such as saving rate, depreciation, and population
growth. Moreover, in this function, technology is an exogenous input. The author
estimated the effect of temperature on output per capital, human and physical capita both
singly and jointly. To measure physical capital stock, they collected data on total GDP,
rates of capital depreciation, investment, and population; while measuring human capita,
they took average school attainment of population aged older 25 from each country. This
setting up human capital data is different with the Mankiw-Romer-Weil model. About the
climate data, they based on capital city’s average annual temperature data of each country
for 30 years by calculating minimum and maximum monthly temperature data then sum
them up to take average. They have concluded that the relationship between income and
temperature is explicit and powerful since temperature affects more than 45% country’s
income stock; and the answer for their second objective is that 1% raising temperature
will lead to reduce 2-3.5% GDP per capita. However, this model is too simple to show a
strong general conclusion about the impact of global warming on income or growth,
13
because temperature has just affected capital and labor of production function, but it
might influence many other aspects such as savings, population growth, or technological
progress. Thereby, we need further research developed more sophisticated models about
this problem to provide enough exact evidences.
While Nordhaus (2006) used cross-sectional data, Dell et al (2008) used panel data to
study climate change affects growth. They examined the variation of precipitation and
annual temperature of 136 countries over 50 years through world economic activities
with adding country-specific dummy in equation. Their dynamic approach was effective
in capturing influence of climate in long run. They began estimating simply without lag
and based on dynamic growth form which includes country fixed influence, time fixed
influence, and climate variables: temperature and precipitation; then they were
continuous with 10 temperature lags. Furthermore, Dell et al (2008) also conducted
political instability effects on the relationship of temperature and growth. They divided
the research into two parts: in the short run, to measure climate fluctuation effects reduce
approximately 1% income per capita since temperature raised 10C, and in long run to
consider historical climate change effects. They found three primary conclusions. First,
higher 10C of temperatures significantly reduce total GDP around 11% in poor countries,
but slightly in rich countries. Therefore, the income gap between poor and rich countries
will be increase by clime change in future. Second, the negative effect of temperatures on
growth rate is more than output. Final, higher temperatures reduce agriculture output,
industrial output, aggregate investment, and expanding political instability in poor
14
countries. However, Dell et al (2008) run regression by measuring effect of climate less
than weather, so they pointed out issue that weather effect is not the same with climate
effect on economic. Moreover, although world income mainly contributed by rich
countries, their estimate showed that temperature has just increased income of rich
countries slightly. In the other hand, there are some precise distinctions between this
paper and other traditional studies. They used aggregate data which can catch and reflect
interactions between important channels; then they considered climate effects on rich and
poor countries differently. Finally, they examined the possibility of temperature affects
on both growth rate and level of output. The authors also suggest further analysis about
particular causal the climate-economy mechanisms.
Both previous studies had been relevant to the research of John (2009). He also
conducted the relationship between income and temperature by top-down approach with
mortality data. The reason is that he thinks that mortality data is representative for
temperature’s historical role, and has strong correlation with average temperature of
countries. He used cross-section data for income per capita, changing temperature in long
run, and some explanatory variables of 100 countries which stand for 94.7% world
population and 95.4% world GDP. The dependent variable is the average GDP per capita
from 2002 to 2004, which accounts for both inside and outside economic activities.
There are three reasons for John (2009) took averaged monthly temperature of stations in
cities to construct the year average temperature data, which is same as Choiniere and
Horowitz (2006): first, he considers that all growth of area, infrastructure will increase
15
temperature in cities more than other places of countries; second, it seems to be the most
exogenous; finally, it is easy to calculate. This is the first difference between John (2009),
Nordhaus (2006), and Dell et al (2008). While Nordhaus (2006) took geographic average
temperature, John (2009) said that unit was one-degree cell of latitude/longitude than
countries; consequently, economic data of some cells were excluded. On the other hand,
John (2009) considers using the population-weighted average temperature as Dell et al
(2008) has less endogenous, although it is unknown and slight implications. Besides,
John (2009) also used other explanatory variables which have same exogenous with
temperature on country level, such as saving rate, percentage of population living around
100km at a coast, population growth, energy resource, and form of government. He
demonstrate the effect of temperature on GDP by depending on the Slow-Swan model
and the Cobb-Douglas production function. To estimate across regression, he used the
log-log form, and the log-cubic form to capture the hump-shaped relationship of very
cold climate and economic activities. Briefly, John (2009) analyzed directly the effect of
temperature changing in long period on income with combine all sectors. The
consequence that he has found out is that increasing 10C will decrease around 12% world
income without mortality data. In the contrast, temperature flattens world income
explicitly with mortality since 10C average temperature raising leads to 3.8-4.2% GDP
reducing. This figure is considered be bigger than result found by bottom-up approach.
He also analyzed separately 38 African countries and 14 Soviet republic countries
because of their size in the effect of temperature on income, however, his report had just
demonstrated the pervasiveness of the income-temperature correlation due to less
16
observation. Moreover, John (2009) put dummy variable for wealthy resources countries
such as the OPEC, he has come to the conclusion that there are not difference between
these countries and others in the log-log regression. Although all his estimations are
significant, there are some limitations in this paper. Measuring the income-temperature
relationship when temperature gets over 20C may be impossible since it requires
expanding sample. The prediction does not include non-market losses or economic
growth because it does not capture exogenous factors such as technological change.
Finally, it cannot reflex exactly in measuring temperature change by the cross-sectional
model.
2.3. Conceptual Framework
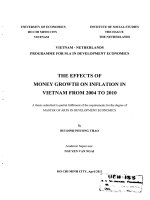
According to existing empirical literature, it can be expected that there is a climate
fluctuation – output relationship which is summarized as Figure 2.1.
The existing studies have indicated that climate fluctuation is caused by global
warming as the result of accumulating greenhouse gas from human activities in industry,
agriculture, etc. They also reach the conclusion that climate shock affects many sectors of
country such as economy, ecosystem, costs of live with typical elements are temperature
and precipitation. In this paper I will address this problem in aspect the output of country
in short run. The aggregate economic effects of climate fluctuation on country in term of
monetary value, is measured by country’s GDP per capita which is representative for the
country’s total economic benefit (or cost). Hence, it is necessary to conduct the
correlation between climate fluctuation and production then suggest policies which is not
17
only essential for adapting changing of climate, but also relying on those changing to
develop the world economy. Moreover, there is different characteristic between each
country, so keeping some country-specific variables about social-economy prospective is
important. The control variables differ from each one in each country as inflation,
population density, urban population, unemployment, the growth rate of GDP per capita.
However, human activities through production, especially such an industry, also impact
environment; then create greenhouse gas in long run. Thus, in this paper’s framework I
pass the influence of production on greenhouse gas (which is showed by the grey dottedline) for further research.
Control variables
Inflation
Population
density
Climate fluctuation
Greenhouse
gas
Temperature
Production
Precipitation
Urban
population
Unemployment
GDP per capital
growth
GDP per capita
Figure 2.1: The way climate fluctuation affects the country’s output
18