Ten Principles of Economics - Part 44
Bạn đang xem bản rút gọn của tài liệu. Xem và tải ngay bản đầy đủ của tài liệu tại đây (220.91 KB, 10 trang )
CHAPTER 20 INCOME INEQUALITY AND POVERTY 443
for inflation) rose more than 50 percent during this period. Because the poverty line
is an absolute rather than a relative standard, more families are pushed above the
poverty line as economic growth pushes the entire income distribution upward. As
John F. Kennedy once put it, a rising tide lifts all boats.
Since the early 1970s, however, the economy’s rising tide has left some boats
behind. Despite continued (although somewhat slower) growth in average in-
come, the poverty rate has not declined. This lack of progress in reducing poverty
in recent years is closely related to the increasing inequality we saw in Table 20-2.
Although economic growth has raised the income of the typical family, the in-
crease in inequality has prevented the poorest families from sharing in this greater
economic prosperity.
Poverty is an economic malady that affects all groups within the population,
but it does not affect all groups with equal frequency. Table 20-4 shows the poverty
rates for several groups, and it reveals three striking facts:
◆ Poverty is correlated with race. Blacks and Hispanics are about three times
more likely to live in poverty than are whites.
◆ Poverty is correlated with age. Children are more likely than average to be
members of poor families, and the elderly are less likely than average to be
poor.
◆ Poverty is correlated with family composition. Families headed by a female
adult and without a husband present are more than twice as likely to live in
poverty as the average family.
These three facts have described U.S. society for many years, and they show which
people are most likely to be poor. These effects also work together: Among black
and Hispanic children in female-headed households, more than half live in poverty.
PROBLEMS IN MEASURING INEQUALITY
Although data on the income distribution and the poverty rate help to give us
some idea about the degree of inequality in our society, interpreting these data is
not as straightforward as it might first appear. The data are based on households’
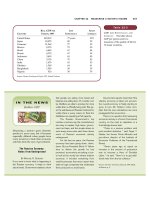
Table 20-4
W
HO
I
S
P
OOR
? This table
shows that the poverty rate varies
greatly among different groups
within the population.
G
ROUP
P
OVERTY
R
ATE
All persons 12.7%
White, not Hispanic 8.2
Black 26.1
Hispanic 25.6
Asian, Pacific Islander 12.5
Children (under age 18) 18.9
Elderly (over age 64) 10.5
Female household, no husband present 33.1
Source: U.S. Bureau of the Census. Data are for 1998.
444 PART SIX THE ECONOMICS OF LABOR MARKETS
annual incomes. What people care about, however, is not their incomes but their
ability to maintain a good standard of living. For various reasons, data on the in-
come distribution and the poverty rate give an incomplete picture of inequality in
living standards. We examine these reasons below.
In-Kind Transfers
Measurements of the distribution of income and the
poverty rate are based on families’ money income. Through various government
programs, however, the poor receive many nonmonetary items, including food
stamps, housing vouchers, and medical services. Transfers to the poor given in the
form of goods and services rather than cash are called in-kind transfers. Standard
measurements of the degree of inequality do not take account of these in-kind
transfers.
Because in-kind transfers are received mostly by the poorest members of soci-
ety, the failure to include in-kind transfers as part of income greatly affects the
measured poverty rate. According to a study by the Census Bureau, if in-kind
transfers were included in income at their market value, the number of families in
poverty would be about 10 percent lower than the standard data indicate.
The important role of in-kind transfers makes evaluating changes in poverty
more difficult. Over time, as public policies to help the poor evolve, the composi-
tion of assistance between cash and in-kind transfers changes. Some of the fluctu-
ations in the measured poverty rate, therefore, reflect the form of government
assistance rather than the true extent of economic deprivation.
The Economic Life Cycle
Incomes vary predictably over people’s lives.
A young worker, especially one in school, has a low income. Income rises as the
worker gains maturity and experience, peaks at around age 50, and then falls
sharply when the worker retires at around age 65. This regular pattern of income
variation is called the life cycle.
Because people can borrow and save to smooth out life cycle changes in in-
come, their standard of living in any year depends more on lifetime income than
on that year’s income. The young often borrow, perhaps to go to school or to buy
a house, and then repay these loans later when their incomes rise. People have
their highest saving rates when they are middle-aged. Because people can save in
anticipation of retirement, the large declines in incomes at retirement need not lead
to similar declines in the standard of living.
This normal life cycle pattern causes inequality in the distribution of annual
income, but it does not represent true inequality in living standards. To gauge
the inequality of living standards in our society, the distribution of lifetime in-
comes is more relevant than the distribution of annual incomes. Unfortunately,
data on lifetime incomes are not readily available. When looking at any data on
inequality, however, it is important to keep the life cycle in mind. Because a per-
son’s lifetime income smooths out the highs and lows of the life cycle, lifetime in-
comes are surely more equally distributed across the population than are annual
incomes.
Transitory versus Permanent Income
Incomes vary over people’s
lives not only because of predictable life cycle variation but also because of ran-
dom and transitory forces. One year a frost kills off the Florida orange crop, and
Florida orange growers see their incomes fall temporarily. At the same time, the
in-kind transfers
transfers to the poor given in the
form of goods and services rather
than cash
life cycle
the regular pattern of income
variation over a person’s life
CHAPTER 20 INCOME INEQUALITY AND POVERTY 445
Florida frost drives up the price of oranges, and California orange growers see
their incomes temporarily rise. The next year the reverse might happen.
Just as people can borrow and lend to smooth out life cycle variation in in-
come, they can also borrow and lend to smooth out transitory variation in income.
When California orange growers experience a good year, they would be foolish to
spend all of their additional income. Instead, they save some of it, knowing that
their good fortune is unlikely to persist. Similarly, the Florida orange growers re-
spond to their temporarily low incomes by drawing down their savings or by bor-
rowing. To the extent that a family saves and borrows to buffer itself from
transitory changes in income, these changes do not affect its standard of living. A
family’s ability to buy goods and services depends largely on its permanent in-
come, which is its normal, or average, income.
To gauge inequality of living standards, the distribution of permanent income
is more relevant than the distribution of annual income. Although permanent in-
come is hard to measure, it is an important concept. Because permanent income
excludes transitory changes in income, permanent income is more equally distrib-
uted than is current income.
permanent income
a person’s normal income
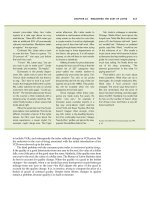
H
OW MANY PEOPLE LIVE IN POVERTY
? T
HE
answer is a topic of continuing debate.
Devising New Math
to Define Poverty
B
Y
L
OUIS
U
CHITELLE
The Census Bureau has begun to revise
its definition of what constitutes poverty
in the United States, experimenting with
a formula that would drop millions of
more families below the poverty line.
The bureau’s new approach would
in effect raise the income threshold for
living above poverty to $19,500 for a
family of four, from the $16,600 now
considered sufficient. Suddenly, 46 mil-
lion Americans, or 17 percent of the pop-
ulation, would be recognized as officially
below the line, not the 12.7 percent an-
nounced last month, the lowest in nearly
a decade. . . .
Fixing a poverty line has always been
a subjective endeavor. The current for-
mula was created for President Lyndon B.
Johnson to keep score on his “war on
poverty” and has remained unchanged
since 1965 except for adjustments for in-
flation. . . . The Census Bureau’s new Ex-
perimental Measures are an effort to
determine what poor people must spend
on food, clothing, housing, and life’s little
extras.
“There is no scientific way to set a
new poverty line,” said Rebecca M.
Blank, dean of the School of Social Pol-
icy at the University of Michigan. “What
there is here are a set of judgment calls,
now being made, about what is needed
to lift people to a socially acceptable
standard of living.” . . .
Ordinary Americans, in opinion polls,
draw the poverty line above $20,000,
saying it takes at least that much, if not
more, to “get along in their community,”
to “live decently,” or to avoid hardship.
But a higher threshold means gov-
ernment spending would rise to pay for
benefits tied to the poverty level, like
food stamps and Head Start. That would
require an incursion into the budget sur-
plus that neither Republicans nor De-
mocrats seek.
Not surprising, the White House,
which would have to authorize a change
in the poverty formula, is proceeding
cautiously. “We have at least a couple of
years more work to do,” an Administra-
tion official said, passing the decision for
redefining poverty to the next adminis-
tration.
S
OURCE
: The New York Times, October 18, 1999,
pp. A1, A14.
IN THE NEWS
Measuring Poverty
446 PART SIX THE ECONOMICS OF LABOR MARKETS
ECONOMIC MOBILITY
People sometimes speak of “the rich” and “the poor” as if these groups consisted
of the same families year after year. In fact, this is not at all the case. Economic mo-
bility, the movement of people among income classes, is substantial in the U.S.
economy. Movements up the income ladder can be due to good luck or hard work,
and movements down the ladder can be due to bad luck or laziness. Some of this
mobility reflects transitory variation in income, while some reflects more persis-
tent changes in income.
Because economic mobility is so great, many of those below the poverty line
are there only temporarily. Poverty is a long-term problem for relatively few fam-
ilies. In a typical ten-year period, about one in four families falls below the poverty
line in at least one year. Yet fewer than 3 percent of families are poor for eight or
more years. Because it is likely that the temporarily poor and the persistently poor
face different problems, policies that aim to combat poverty need to distinguish
between these groups.
Another way to gauge economic mobility is the persistence of economic suc-
cess from generation to generation. Economists who have studied this topic find
substantial mobility. If a father earns 20 percent above his generation’s average in-
come, his son will most likely earn 8 percent above his generation’s average in-
come. There is almost no correlation between the income of a grandfather and the
income of a grandson. There is much truth to the old saying, “From shirtsleeves to
shirtsleeves in three generations.”
One result of this great economic mobility is that the U.S. economy is filled
with self-made millionaires (as well as with heirs who squandered the fortunes
they inherited). According to estimates for 1996, about 2.7 million households in
the United States had net worth (assets minus debts) that exceeded $1 million.
These households represented the richest 2.8 percent of the population. About four
out of five of these millionaires made their money on their own, such as by start-
ing and building a business or by climbing the corporate ladder. Only one in five
millionaires inherited their fortunes.
QUICK QUIZ: What does the poverty rate measure? ◆ Describe three
potential problems in interpreting the measured poverty rate.
THE POLITICAL PHILOSOPHY
OF REDISTRIBUTING INCOME
We have just seen how the economy’s income is distributed and have considered
some of the problems in interpreting measured inequality. This discussion was pos-
itive in the sense that it merely described the world as it is. We now turn to the nor-
mative question facing policymakers: What should the government do about
economic inequality?
This question is not just about economics. Economic analysis alone cannot tell
us whether policymakers should try to make our society more egalitarian. Our
views on this question are, to a large extent, a matter of political philosophy. Yet
CHAPTER 20 INCOME INEQUALITY AND POVERTY 447
because the government’s role in redistributing income is central to so many de-
bates over economic policy, here we digress from economic science to consider a
bit of political philosophy.
UTILITARIANISM
A prominent school of thought in political philosophy is utilitarianism. The
founders of utilitarianism are the English philosophers Jeremy Bentham (1748–1832)
and John Stuart Mill (1806–1873). To a large extent, the goal of utilitarians is to ap-
ply the logic of individual decisionmaking to questions concerning morality and
public policy.
The starting point of utilitarianism is the notion of utility—the level of happi-
ness or satisfaction that a person receives from his or her circumstances. Utility is
a measure of well-being and, according to utilitarians, is the ultimate objective of
all public and private actions. The proper goal of the government, they claim, is to
maximize the sum of utility of everyone in society.
The utilitarian case for redistributing income is based on the assumption of di-
minishing marginal utility. It seems reasonable that an extra dollar of income to a
poor person provides that person with more additional utility than does an extra
dollar to a rich person. In other words, as a person’s income rises, the extra well-
being derived from an additional dollar of income falls. This plausible assumption,
together with the utilitarian goal of maximizing total utility, implies that the gov-
ernment should try to achieve a more equal distribution of income.
The argument is simple. Imagine that Peter and Paul are the same, except that
Peter earns $80,000 and Paul earns $20,000. In this case, taking a dollar from Peter
to pay Paul will reduce Peter’s utility and raise Paul’s utility. But, because of di-
minishing marginal utility, Peter’s utility falls by less than Paul’s utility rises.
Thus, this redistribution of income raises total utility, which is the utilitarian’s
objective.
At first, this utilitarian argument might seem to imply that the government
should continue to redistribute income until everyone in society has exactly the
same income. Indeed, that would be the case if the total amount of income—
$100,000 in our example—were fixed. But, in fact, it is not. Utilitarians reject com-
plete equalization of incomes because they accept one of the Ten Principles of
Economics presented in Chapter 1: People respond to incentives.
To take from Peter to pay Paul, the government must pursue policies that re-
distribute income, such as the U.S. federal income tax and welfare system. Under
these policies, people with high incomes pay high taxes, and people with low in-
comes receive income transfers. Yet, as we have seen in Chapters 8 and 12, taxes
distort incentives and cause deadweight losses. If the government takes away ad-
ditional income a person might earn through higher income taxes or reduced
transfers, both Peter and Paul have less incentive to work hard. As they work less,
society’s income falls, and so does total utility. The utilitarian government has to
balance the gains from greater equality against the losses from distorted incen-
tives. To maximize total utility, therefore, the government stops short of making
society fully egalitarian.
A famous parable sheds light on the utilitarian’s logic. Imagine that Peter and
Paul are thirsty travelers trapped at different places in the desert. Peter’s oasis has
much water; Paul’s has little. If the government could transfer water from one oasis
utilitarianism
the political philosophy according to
which the government should choose
policies to maximize the total utility
of everyone in society
utility
a measure of happiness or
satisfaction