Ten Principles of Economics - Part 50
Bạn đang xem bản rút gọn của tài liệu. Xem và tải ngay bản đầy đủ của tài liệu tại đây (303.43 KB, 10 trang )
CHAPTER 22 MEASURING A NATION’S INCOME 507
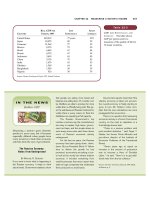
Table 22-3
GDP, L
IFE
E
XPECTANCY
,
AND
L
ITERACY
. The table shows
GDP per person and two
measures of the quality of life for
12 major countries.
R
EAL
GDP
PER
L
IFE
A
DULT
C
OUNTRY
P
ERSON
, 1997 E
XPECTANCY
L
ITERACY
United States $29,010 77 years 99%
Japan 24,070 80 99
Germany 21,260 77 99
Mexico 8,370 72 90
Brazil 6,480 67 84
Russia 4,370 67 99
Indonesia 3,490 65 85
China 3,130 70 83
India 1,670 63 53
Pakistan 1,560 64 41
Bangladesh 1,050 58 39
Nigeria 920 50 59
Source: Human Development Report 1999, United Nations.
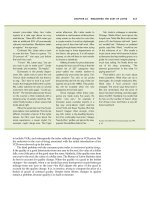
Measuring a nation’s gross domestic
product is never easy, but it becomes
especially difficult when people have
every incentive to hide their economic
activities from the eyes of government.
The Russian Economy:
Notes from Underground
B
Y
M
ICHAEL
R. G
ORDON
If you want to know what is happening in
the Russian economy, it helps to think
about bread. Government statistics show
that people are eating more bread and
bakeries are selling less. Or consider vod-
ka. Distillers are able to produce far more
vodka than is officially being sold. But giv-
en the well-deserved Russian fondness for
vodka there is every reason to think the
distilleries are operating at full capacity.
The Russian Government’s top
number crunchers say the contradictions
are easy to explain: high taxes, govern-
ment red tape, and the simple desire to
sock away some extra cash have driven
much of Russia’s economic activity
underground.
For the last six years, the Russian
economy has been going down, down,
down. But as President Boris N. Yeltsin
tries to deliver the growth he has
promised, economists are taking a clos-
er look at the murky but vibrant shadow
economy. It includes everything from
small businesses that never report their
sales to huge companies that understate
their production to avoid taxes.
Government experts insist that if the
shadow economy is taken into account,
the overall economy is finally starting to
grow. In turn, Mr. Yeltsin’s critics com-
plain that the new calculations are more
propaganda than economics. . . .
There is no question that measuring
economic activity in a former Communist
country on the road to capitalism is a
frustratingly elusive task.
“There is a serious problem with
post-socialist statistics,” said Yegor T.
Gaidar, the former Prime Minister and
pro-reform director of the Institute of
Economic Problems of the Transitional
Period.
“Seven years ago to report an
increase in the amount of production
was to become a Hero of Socialist
Labor,” he said. “Now it is to get addi-
tional visits from the tax collector.”
S
OURCE
: The New York Times, May 18, 1997, Week
in Review, p. 4.
IN THE NEWS
Hidden GDP
508 PART EIGHT THE DATA OF MACROECONOMICS
maternal mortality, higher rates of child malnutrition, and less common access
to safe drinking water. In countries with low GDP per person, fewer school-age
children are actually in school, and those who are in school must learn with
fewer teachers per student. These countries also tend to have fewer televisions,
fewer telephones, fewer paved roads, and fewer households with electricity.
International data leave no doubt that a nation’s GDP is closely associated with
its citizens’ standard of living.
QUICK QUIZ: Why should policymakers care about GDP?
CONCLUSION
This chapter has discussed how economists measure the total income of a nation.
Measurement is, of course, only a starting point. Much of macroeconomics is
aimed at revealing the long-run and short-run determinants of a nation’s gross
domestic product. Why, for example, is GDP higher in the United States and Japan
than in India and Nigeria? What can the governments of the poorest countries do
to promote more rapid growth in GDP? Why does GDP in the United States rise
rapidly in some years and fall in others? What can U.S. policymakers do to reduce
the severity of these fluctuations in GDP? These are the questions we will take up
shortly.
At this point, it is important to acknowledge the importance of just measuring
GDP. We all get some sense of how the economy is doing as we go about our lives.
But the economists who study changes in the economy and the policymakers who
formulate economic policies need more than this vague sense—they need concrete
data on which to base their judgments. Quantifying the behavior of the economy
with statistics such as GDP is, therefore, the first step to developing a science of
macroeconomics.
◆ Because every transaction has a buyer and a seller, the
total expenditure in the economy must equal the total
income in the economy.
◆ Gross domestic product (GDP) measures an economy’s
total expenditure on newly produced goods and
services and the total income earned from the
production of these goods and services. More precisely,
GDP is the market value of all final goods and services
produced within a country in a given period of time.
◆ GDP is divided among four components of expenditure:
consumption, investment, government purchases, and
net exports. Consumption includes spending on goods
and services by households, with the exception of
purchases of new housing. Investment includes
spending on new equipment and structures, including
households’ purchases of new housing. Government
purchases include spending on goods and services by
local, state, and federal governments. Net exports equal
the value of goods and services produced domestically
and sold abroad (exports) minus the value of goods and
services produced abroad and sold domestically
(imports).
◆ Nominal GDP uses current prices to value the
economy’s production of goods and services. Real GDP
uses constant base-year prices to value the economy’s
production of goods and services. The GDP deflator—
Summary
CHAPTER 22 MEASURING A NATION’S INCOME 509
calculated from the ratio of nominal to real GDP—
measures the level of prices in the economy.
◆ GDP is a good measure of economic well-being because
people prefer higher to lower incomes. But it is not a
perfect measure of well-being. For example, GDP
excludes the value of leisure and the value of a clean
environment.
Key Concepts
microeconomics, p. 494
macroeconomics, p. 494
gross domestic product (GDP), p. 496
consumption, p. 499
investment, p. 499
government purchases, p. 499
net exports, p. 499
nominal GDP, p. 502
real GDP, p. 502
GDP deflator, p. 503
Questions for Review
1. Explain why an economy’s income must equal its
expenditure.
2. Which contributes more to GDP—the production of an
economy car or the production of a luxury car? Why?
3. A farmer sells wheat to a baker for $2. The baker uses
the wheat to make bread, which is sold for $3. What is
the total contribution of these transactions to GDP?
4. Many years ago Peggy paid $500 to put together a
record collection. Today she sold her albums at a garage
sale for $100. How does this sale affect current GDP?
5. List the four components of GDP. Give an example of
each.
6. Why do economists use real GDP rather than nominal
GDP to gauge economic well-being?
7. In the year 2001, the economy produces 100 loaves of
bread that sell for $2 each. In the year 2002, the economy
produces 200 loaves of bread that sell for $3 each.
Calculate nominal GDP, real GDP, and the GDP deflator
for each year. (Use 2001 as the base year.) By what
percentage does each of these three statistics rise from
one year to the next?
8. Why is it desirable for a country to have a large GDP?
Give an example of something that would raise GDP
and yet be undesirable.
Problems and Applications
1. What components of GDP (if any) would each of the
following transactions affect? Explain.
a. A family buys a new refrigerator.
b. Aunt Jane buys a new house.
c. Ford sells a Thunderbird from its inventory.
d. You buy a pizza.
e. California repaves Highway 101.
f. Your parents buy a bottle of French wine.
g. Honda expands its factory in Marysville, Ohio.
2. The “government purchases” component of GDP does
not include spending on transfer payments such as
Social Security. Thinking about the definition of GDP,
explain why transfer payments are excluded.
3. Why do you think households’ purchases of new
housing are included in the investment component of
GDP rather than the consumption component? Can you
think of a reason why households’ purchases of new
cars should also be included in investment rather than
in consumption? To what other consumption goods
might this logic apply?
4. As the chapter states, GDP does not include the value of
used goods that are resold. Why would including such
transactions make GDP a less informative measure of
economic well-being?
5. Below are some data from the land of milk and honey.
P
RICE
Q
UANTITY
P
RICEOF
Q
UANTITY
Y
EAR OF
M
ILK OF
M
ILK
H
ONEY OF
H
ONEY
2001 $1 100 qts. $2 50 qts.
2002 $1 200 $2 100
2003 $2 200 $4 100
510 PART EIGHT THE DATA OF MACROECONOMICS
a. Compute nominal GDP, real GDP, and the GDP
deflator for each year, using 2001 as the base year.
b. Compute the percentage change in nominal GDP,
real GDP, and the GDP deflator in 2002 and 2003
from the preceding year. For each year, identify the
variable that does not change. Explain in words
why your answer makes sense.
c. Did economic well-being rise more in 2002 or 2003?
Explain.
6. Consider the following data on U.S. GDP:
N
OMINAL
GDP GDP D
EFLATOR
Y
EAR
(
IN BILLIONS
)(
BASEYEAR
1992)
1996 7,662 110
1997 8,111 112
a. What was the growth rate of nominal GDP between
1996 and 1997? (Note: The growth rate is the
percentage change from one period to the next.)
b. What was the growth rate of the GDP deflator
between 1996 and 1997?
c. What was real GDP in 1996 measured in 1992
prices?
d. What was real GDP in 1997 measured in 1992
prices?
e. What was the growth rate of real GDP between
1996 and 1997?
f. Was the growth rate of nominal GDP higher or
lower than the growth rate of real GDP? Explain.
7. If prices rise, people’s income from selling goods
increases. The growth of real GDP ignores this gain,
however. Why, then, do economists prefer real GDP as a
measure of economic well-being?
8. Revised estimates of U.S. GDP are usually released by
the government near the end of each month. Go to a
library and find a newspaper article that reports on the
most recent release. Discuss the recent changes in real
and nominal GDP and in the components of GDP.
(Alternatively, you can get the data at www.bea.doc.gov,
the Web site of the U.S. Bureau of Economic Analysis.)
9. One day Barry the Barber, Inc., collects $400 for haircuts.
Over this day, his equipment depreciates in value by
$50. Of the remaining $350, Barry sends $30 to the
government in sales taxes, takes home $220 in wages,
and retains $100 in his business to add new equipment
in the future. From the $220 that Barry takes home, he
pays $70 in income taxes. Based on this information,
compute Barry’s contribution to the following measures
of income:
a. gross domestic product
b. net national product
c. national income
d. personal income
e. disposable personal income
10. Goods and services that are not sold in markets, such as
food produced and consumed at home, are generally
not included in GDP. Can you think of how this might
cause the numbers in the second column of Table 22-3 to
be misleading in a comparison of the economic well-
being of the United States and India? Explain.
11. Until the early 1990s, the U.S. government emphasized
GNP rather than GDP as a measure of economic well-
being. Which measure should the government prefer if
it cares about the total income of Americans? Which
measure should it prefer if it cares about the total
amount of economic activity occurring in the United
States?
12. The participation of women in the U.S. labor force has
risen dramatically since 1970.
a. How do you think this rise affected GDP?
b. Now imagine a measure of well-being that includes
time spent working in the home and taking leisure.
How would the change in this measure of well-
being compare to the change in GDP?
c. Can you think of other aspects of well-being that
are associated with the rise in women’s labor force
participation? Would it be practical to construct a
measure of well-being that includes these aspects?
511
IN THIS CHAPTER
YOU WILL . . .
Learn the
distinction between
real and nominal
interest rates
Compare the CPI
and the GDP
deflator as
measures of the
overall price level
Learn how the
consumer price
index (CPI) is
constructed
Consider why the
CPI is an imperfect
measure of the cost
of living
See how to use a
price index to
compare dollar
figures from
different times
In 1931, as the U.S. economy was suffering through the Great Depression, famed
baseball player Babe Ruth earned $80,000. At the time, this salary was extraordi-
nary, even among the stars of baseball. According to one story, a reporter asked
Ruth whether he thought it was right that he made more than President Herbert
Hoover, who had a salary of only $75,000. Ruth replied, “I had a better year.”
Today the average baseball player earns more than 10 times Ruth’s 1931 salary,
and the best players can earn 100 times as much. At first, this fact might lead you
to think that baseball has become much more lucrative over the past six decades.
But, as everyone knows, the prices of goods and services have also risen. In 1931,
a nickel would buy an ice-cream cone, and a quarter would buy a ticket at the local
movie theater. Because prices were so much lower in Babe Ruth’s day than they
are in ours, it is not clear whether Ruth enjoyed a higher or lower standard of liv-
ing than today’s players.
MEASURING THE
COST OF LIVING