Gd-EOB-DTPA-enhanced magnetic resonance imaging combined with T1 mapping predicts the degree of differentiation in hepatocellular carcinoma
Bạn đang xem bản rút gọn của tài liệu. Xem và tải ngay bản đầy đủ của tài liệu tại đây (1.62 MB, 7 trang )
Peng et al. BMC Cancer (2016) 16:625
DOI 10.1186/s12885-016-2607-4
RESEARCH ARTICLE
Open Access
Gd-EOB-DTPA-enhanced magnetic
resonance imaging combined with T1
mapping predicts the degree of
differentiation in hepatocellular carcinoma
Zhenpeng Peng1†, Mengjie Jiang1,2†, Huasong Cai1†, Tao Chan3, Zhi Dong1, Yanji Luo1, Zi-Ping Li1*
and Shi-Ting Feng1*
Abstract
Background: Variable degrees of differentiation in hepatocellular carcinoma(HCC)under Edmondson-Steiner
grading system has been proven to be an independent prognostic indicator for HCC. Up till now, there has
been no effective radiological method that can reveal the degree of differentiation in HCC before surgery.
This paper aims to evaluate the use of Gd-EOB-DTPA-Enhanced Magnetic Resonance Imaging combined with
T1 mapping for the diagnosis of HCC and assessing its degree of differentiation.
Methods: Forty-four patients with 53 pathologically proven HCC had undergone Gd-EOB-DTPA enhanced MRI
with T1 mapping before surgery. Out of the 53 lesions,13 were grade I, 27 were gradeII, and 13 were grade III.
The T1 values of each lesion were measured before and at 20 min after Gd-EOB-DTPA administration (T1p and
T1e). The absolute reduction in T1 value (T1d) and the percentage reduction (T1d %) were calculated. The one-way
ANOVA and Pearson correlation were used for comparisons between the T1 mapping values.
Results: The T1d and T1d % of grade I, II and III of HCC was 660.5 ± 422.8ms、295.0 ± 99.6ms、276.2 ± 95.0ms
and 54.0 ± 12.2 %、31.5 ± 6.9 %、27.7 ± 6.7 % respectively. The differences between grade Iand II, grade Iand III
were statistically significant (p < 0.05), but there was no statically significant difference between grade II and III.
The T1d % was the best marker for grading of HCC, with a Spearman correlation coefficient of −0.676.
Conclusions: T1 mapping before and after Gd-EOB-DTPA administration can predict degree of differentiation in HCC.
Keywords: Gd-EOB-DTPA, T1 mapping, Hepatocellular Carcinoma, Edmondson-Steiner grade, Differentiated degrees
Background
Hepatocellular carcinoma (HCC) ranks as the sixth
most common cancer worldwide and is responsible for
about 9 % of the cancer-related deaths globally [1].
Many new developments in medical imaging help to
improve detection, characterization, and prognostication of HCC, eg contrast-enhanced ultrasonography
(CEUS), multidetector computer tomography (MDCT), diffusion weighted magnetic resonance imaging (DW-MRI),
* Correspondence: ;
†
Equal contributors
1
Department of Radiology, The First Affiliated Hospital, Sun Yat-Sen
University, 58th, The Second Zhongshan Road, Guangzhou, Guangdong
510080, China
Full list of author information is available at the end of the article
and Gd-EOB-DTPA enhanced MRI [1–4]. Gadoxetic
acid is a hepatocyte-specific contrast agent with a pendant ethoxybenzyl group covalently attached to the
extracellular contrast agent gadopentetate dimeglumine, which can be taken up by functioning hepatocytes. It is eliminated in equal quantities by the urinary
and biliary systems [5–8]. Therefore, it enables the
assessment of tumor vascularity as well as other
hepatocellular-specific properties within the tumor.
Thus Gd-EOB-DTPA has been proven valuable in detection and differential diagnosis of focal liver lesions,
especially between early HCC and dysplastic nodule(DN) [3, 9]. As HCCs in different degree of differentiation retain variable degree of normal liver function,
© 2016 The Author(s). Open Access This article is distributed under the terms of the Creative Commons Attribution 4.0
International License ( which permits unrestricted use, distribution, and
reproduction in any medium, provided you give appropriate credit to the original author(s) and the source, provide a link to
the Creative Commons license, and indicate if changes were made. The Creative Commons Public Domain Dedication waiver
( applies to the data made available in this article, unless otherwise stated.
Peng et al. BMC Cancer (2016) 16:625
Page 2 of 7
they could potentially be classified using Gd-EOB-DTPA
[10, 11].
Measurement of the T1 relaxation time in a lesion before and after Gd-EOB-DTPA administration allows
quantitative evaluation of Gd-EOB-DTPA uptake, which
potentially reveals related properties of the lesion [12].
Unlike MR signal intensity, which is affected by many
technical factors and variable MR imaging parameters,
T1 relaxation time is a characteristic of the imaged tissue. T1 mapping can hence be used for quantitative measurements and characterization of tissues [4, 12, 13].
T1mapping on Gd-EOB-DTPA-enhanced MRI has been
shown to be able to quantitatively distinguish hepatic
hemangiomas from metastatic tumors [5]. T1 mapping
on Gd-EOB-DTPA-enhanced MRI also showed significant differences in T1 relaxation time in hepatobiliary
phase and its rate of decrease (Δ %) between normal
liver, non-alcoholic fatty liver disease (NAFLD) and
non-alcoholic steatohepatitis (NASH) [4]. This method
has also been successfully used to estimate liver function [12, 14].
As of to date, there has been no attempt to assess the
degree of differentiation of HCC by medical imaging
methods.
It has been established that Edmondson-Steiner grade
was an independent predictor for early recurrence in
HCC. Furthermore, Edmondson-Steiner grade has been
shown to be related to other markers of poor prognosis,
including microvascular invasion [15–19], expression of
Nemo-like kinase (NLK), Protein disulfide isomerase
(PDI), p21-activated protein kinase (PAK) 6, chemokine
receptor CCR9 [20–23].
Previous studies have shown that different grades of
HCCs appear differently on both dynamic contrastenhanced (DCE) magnetic resonance imaging (MRI)
and hepatobiliary-phase MR images. Well-differentiated
HCC tends to show signals closer to that of liver parenchyma and less conspicuous hypointensity Gd-EOB-DTPA
on hepatobiliary-phase images [10, 11, 24]. One study also
indicated that maximum sensitivity of Gd-EOB-DTPA enhanced MRI was only 69 % even when diagnostic criteria
including all previously reported pattern of HCC were
adopted, missing some well-differentiated and moderately
differentiated HCC [25]. It is noteworthy that the above
studies were based on qualitative assessment. We propose
the use of T1 mapping index on Gd-EOB-DTPA enhanced
MRI that might predict Edmondson-Steiner grade of
HCC, and hence improve the prognostication of HCC
prior to surgery.
compliant with the Health Insurance Portability and Accountability Act (HIPAA). As such, the study received
IRB or ethical committee approval, and the requirement
for informed consent was waived.
Between July 2012 and February 2015, 44 patients (41
males and 3 females) suffering from HCC who had
undergone gadoxetic acid-enhanced MRI with a 3.0
Tesla (T) system within a week before hepatectomy were
included. (Patients who were non-evaluable or with poor
images were excluded.) Pathological diagnosis and grading were made according to Edmondson-Steiner grading
system, see Table 1 [16, 19].
Methods
Study Population
This is a retrospective study conducted in accordance
with ethical guidelines for human research and was
MR imaging protocol
All MRI examinations were conducted with a clinical 3T
whole body system (Magnetom Verio, Siemens Healthcare Sector, Erlangen, Germany). The body array coil
(3T; 8-channel body matrix coil) was used in all examinations. All patients fasted for 6 ~ 8 h prior to examination and were trained for holding breath. Bellyband was
used during examination. The sequences employed are
listed in Table 2.
All patients received a body weight adjusted dose of
Gd-EOB-DTPA (Primovist ®, 0.1ml/kg body weight) administered as bolus injection with a flow rate of 1ml/s,
flushed with 30 ml of normal saline at the same rate.
The T1 relaxation times were measured on both noncontrast images and images obtained at 20mins after injection of the Gd-EOB-DTPA.
Image analysis
The T1 maps of the liver were generated with the evaluation tool for calculating T1 relaxation times (Siemens
Leonardo Syngo 2009B). T1 values on T1 mapping images were measured before and after the administration
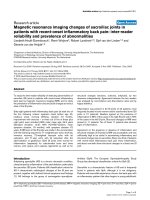
of the contrast medium (recorded as T1p and T1e respectively) as shown in Fig. 1. Regions of interest (ROIs)
were drawn in the most homogeneous appearing portion
of the lesion, avoiding tumor capsule, necrosis, fat and
vessels. Round ROIs were drawn as large as possible
Table 1 Edmondson-Steiner grade
Edmondson-Steiner grade
I
Cells with abundant cytoplasm and minimal
nuclear irregularity
II
Greater nuclear irregularity and prominent
nucleoli
III
Increased nuclear pleomorphism and
angulation of the nuclei; Tumour giant cells
were also more commonly seen
IVa
Poorly differentiated with marked nuclear
pleomorphism, hyperchromatism and
anaplasia
a
Limited by study population, this study did not include HCC of EdmondsonSteiner grade IV
Peng et al. BMC Cancer (2016) 16:625
Page 3 of 7
Table 2 MRI sequences used in the study
Sequence
TR(ms)
TE(ms)
FA
Scan time (s)
Slice thickness (mm)
Matrix
FOV
T1WI
225
2.2
70
19.42
6
200 × 320
258 × 330
T2WI
2000
91
150
106
6
410 × 512
350 × 350
4.4
1.2
2,12
20.15
2
154 × 256
248 × 330
3.3
1.2
13
8.21/phase
2
96 × 256
248 × 330
T1WI
225
2.2
70
19.42
6
200 × 320
258 × 330
VIBE-T1mapping
4.4
1.2
2,12
20.15
2
154 × 256
248 × 330
Plain scan
VIBE-T1mapping
DCE
VIBE
Hepatobiliary-phase
within the boundary of the lesion, and that the ROIs
were identical in size and shape on images before and
after contrast.
Two experienced radiologists drew the ROIs independently, and would reach a consensus by consultation
if there were any conflict. Each lesion was measured for
3 times and the mean of 3 values was applied for calculating reduction of T1 values (T1d) after enhancement
and its reduction ratio (T1d %) as follows:
T1d ¼ T1p−T1e
T1d% ¼ ½ðT1p−T1eÞ=T1px100%
T1 maps were also color-coded using a visualization
tool of the open source OsiriX imaging software.
Statistical analysis
All statistical analyses were done using SPSS (version
19.0, Statistical Package for Social Science,Chicago,USA).
A one-way analysis of variance (ANOVA) was used to
analyze differences of these values between different
Edmondson-Steiner grades. Spearman correlation was
also done between T1 mapping characteristics and different Edmondson-Steiner grades.
All statistical tests were two-sided and p value < 0.05
indicated significant difference.
[8, 13]
Results
The median age of patients was 54.9 (range 37–77).
Altogether, 53 lesions in 44 patients confirmed and
graded by pathology were analyzed in the study.
Size
The lesion size of different grades showed no statistical
significance, as shown in Table 3.
Comparison of T1mapping for HCC in different
Edmondson-Steiner grade
HCC showed either hyperintensity or hypointensity on
T1WI, and hypointensity on hepatobiliary-phase images. The higher the Edmondson-Steiner grade, the
more conspicuous the difference between lesion and
normal liver parenchyma (Fig. 2). T1p, T1e, T1d and
Table 3 Size of lesions for different Edmondson-Steiner grade
Fig. 1 a, b T1 values in T1 mapping images was measured before
(T1p) and after (T1e) administration of the contrast medium. The
two ROIs were chosen at the same place in the same lesions
Edmondson-Steiner grade
No.
Diameters (mean, mm)a
I
13
31.3 ± 23.7
II
27
25.4 ± 23.5
III
13
38.8 ± 35.6
Total
53
30.1 ± 28.5
a
There was no statistically significant difference between three
groups (P = 0.389)
Peng et al. BMC Cancer (2016) 16:625
Page 4 of 7
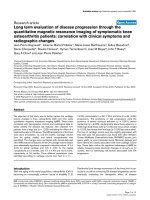
Fig. 2 Row a: T1 weightedimages, Row b: T2 weightedI image, Row c: arterial phase image, Row d: potal venous phase image, Row e: hepatobiliary
phase images; Row f: and Row g: T1 mapping of T1WI and hepatobiliary phase images; row h: corresponding pathological pictures. 1a-h, HCC
(Edmondson-Steiner grade I). Lesion appeared hyperintense on routine sequences and hypointense in hepatobiliary-phase; T1p 892ms, T1e
388 ms, T1d = 504 ms, T1d % = 56.50 %; cells showed abundant cytoplasm and minimal nuclear irregularity. 2a-h, HCC (Edmondson-Steiner
grade II), hypointense on T1WI and hepatobiliary phase images, “wash in and wash out”; T1p 1696 ms, T1e 1444 ms, T1d = 252 ms, T1d %
= 14.90 %. 3a-h, HCC (Edmondson-Steiner grade III), hyperintense on T2WI images, hypointense on T1WI and hepatobiliary phase images; T1p 2134
ms, T1e 1494 ms,T1d = 640 ms,T1d % = 30.00 %. 2-h and 3-h, nuclear pleomorphism increased with increase in Edmondson-Steiner grade
Peng et al. BMC Cancer (2016) 16:625
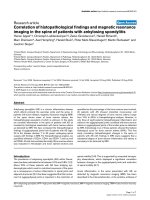
T1d % were measured and calculated, the results are
shown in Fig. 3. There was no statistical significance of
T1p and T1e between three groups (p = 0.144, 0.059).
But both T1d and T1d % showed statistical differences
between the groups. T1d ranged from 141ms to 1913ms,
and T1d % from 14.8 to 74.8 %. In general, T1d and
T1d % decreased with increase in Edmondson-Steiner
grade.
Mutivariate analysis showed there was statistical significance of T1d and T1d % between both grade I-grade
II and grade I-grade III (p < 0.05). However the data
from group II and group III were not different from one
another (p = 0.804,0.197) (Fig. 4).
Correlation analysis
Spearman Correlation analysis manifested positive correlation between T1e and Edmondson-Steiner grade
(P < 0.05), as well as negative correlations between T1d
and Edmondson-Steiner grade, T1d % and EdmondsonSteiner grade (P < 0.05). Of the above, T1d % had the best
correlation with a correlation index 0.676 (Table 4).
Discussion
This study showed that HCC of Edmondson-Steiner
grade I could be distinguished from grade II and III lesions using T1d and T1d %. The higher the grade, the
lower the T1d and T1d %. From the above, it was suggested that uptake of Gd-EOB-DTPA decreases with increase in Edmondson-Steiner grade. Generally, 5–10 %
of HCC are Edmondson-Steiner grade I lesions. But in
this study, grade I HCC accounted for 24.5 % (13/53) of
the samples, which could be due to the higher proportion of small HCC in the sample [26].
Gd-EOB-DTPA has been widely used in the HCC evaluation and proved to be helpful for its diagnosis, differential
diagnosis and grading. Some previous studies found that
hypointensity on gadoxetic acid–enhanced hepatobiliary
phase images and hyperintensity on high-b-value DWI
Page 5 of 7
suggest well-differentiated HCCs rather than benign hepatocellular nodules, and might predict worse histological
grades of HCC [27, 28]. Schelhorn et al. [29] also reported
that the enhancement patterns changed with different
grades of HCC. On the other hand, it has been shown that
50 % of well-differentiated HCCs exhibit isointensity or
hyperintensity in the hepatobiliary-phase, causing difficulty in imaging diagnosis, especially in patients with
worse Child-Pugh class [10, 11, 24, 25, 30]. It is known
that cell morphology of well-differentiated HCC is similar to that of normal liver cell. The ultra microstructures of well-differentiated HCC cells as revealed by
electron microscope also exhibit similarities in cell nucleus, organelle, contact of cell, etc. to that normal liver
cell. It is therefore believed that well-differentiated
HCC could have preserved liver cell functions [31],
which has also been suggested in an imaging study on
animal HCC model [32]. Uptake of Gd-EOB-DTPA in
hepatobiliary phase in HCC is determined by expression of OATP1B3, which expression varies in HCC of
different grades [33]. However, the minor difference between HCC of different grades, as well as between welldifferentiated HCC and normal liver tissue, could be
difficult to appreciate by qualitative assessment.
This study confirmed that quantitative analysis based
on T1 mapping allowed differentiation between different
grades of HCC. Of the different quantitative measurements studied, T1d % had the best correlation with
histological grades. The results showed that T1d % for
grade I lesions was 54.0 ± 12.2 %, and that for grade II
and III lesions were 31.5 ± 6.9 and 27.7 ± 6.7 % respectively. Therefore T1d % of higher than 50 % would suggest that an HCC is likely to be of Edmondson-Steiner
grade I. Theoretically, T1p and T1e, could also be different in different Edmondson-Steiner grades; however, this
was not supported by the results. It is suspected that this
could in part be related to abnormal blood perfusion
due to artery-to-vein or artery-to-portal vein shunting
Fig. 3 Values of T1p, T1e, T1d, T1d % in different groups and all of the studied lesions
Peng et al. BMC Cancer (2016) 16:625
Page 6 of 7
Fig. 4 The average value of T1d and T1d % in HCC of different Edmondson-Steiner grades. Box-and-whisker plots showed that there was
statistical significance of T1d and T1d % between grade I and the other two groups, but no statistically significant difference between grade II
and grade III lesions
[34], which would reduce the T1 shortening effect of
Gd-EOB-DTPA.
Previous studies have suggested that EdmondsonSteiner grade is an independent factor affecting prognosis/recurrence of HCC [15–20], which should be
taken into account when considering therapeutic strategy [16, 19]. In addition, liver cells take up Gd-EOBDTPA via the receptors OATP1B1, OATP1B3 and
NTCP. OATP1B3 is also the transport for some anticancer drugs [32, 35–39]. Therefore, tumor behavior
in terms of Gd-EOB-DTPA uptake might also predict
effect of therapy. The results obtained by this study
held promise to predict tumor grading patients prior
to surgery, which might also help to choose between
treatment options.
There are limitations in the current study. Firstly, the
retrospective nature of the study could not avoid sampling
bias. Secondly, due to the relatively small number of lesions, a model that describes the relations between the
best indicator of T1d % and the individual EdmondsonSteiner grades could not be formulated.
Conclusion
T1 mapping before and after Gd-EOB-DTPA administration can help to classify the HCC in terms of
Edmondson-Steiner grade. The percentage reduction of
T1 value after contrast in hepatobiliary phase was the
best indication for such classification of HCC.
Abbreviations
CEUS, contrast-enhanced ultrasonography; DCE-MRI, dynamic contrast-enhanced
magnetic resonance imaging; DW-MRI, diffusion weighted magnetic resonance
imaging; HCC, hepatocellular carcinoma; MDCT, multidetector computer
tomography; NAFLD, non-alcoholic fatty liver disease; NASH, non-alcoholic
steatohepatitis; NLK, Nemo-like kinase; PAK6, p21-activated protein kinase6;
PDI, protein disulfide isomerase
Acknowledgements
No.
Funding
This work was funded by National Natural Science Foundation of China
(81571750), Natural Science Foundation of Guangdong Province
(2014A030311018, 2014A030310484, 2015A030313043), S&T Programs
(2014A020212125) of Guangdong Province, Medical Scientific Research
Foundation of Guangdong Province (A2013196).
Availability of data and materials
The ethics approval was provided by The First Affiliated Hospital, Sun Yat-Sen
University, China. All the data and materials are available.
Table 4 Correlation analysis between T1p, T1e, T1d, T1d % and
Edmondson-Steiner grade
T1p
T1e
T1d
T1d %
−0.065
0.335
−0.570
−0.676a
P
0.643
0.014
0.000
0.000
N
53
53
53
53
Correlation index
a
T1d % had the best correlation with Edmondson-Steiner grade with a correlation
index 0.676
Authors’ contributions
All authors meet the requirements for authorship and manuscript submission.
ZP L and ST F conceived and carried out experiments. ZPP and MJ J carried out
experiments. HS C performed the MR scan on each subject. TC, ZD and YJL
collected and analysed data. All authors were involved in writing the paper and
had final approval of the submitted and published versions.
Competing interests
The authors declare that they have no competing interests.
Peng et al. BMC Cancer (2016) 16:625
Consent for publication
Not applicable.
Ethics approval and consent to participate
The study was conducted in accordance with ethical guidelines for
human research and was compliant with the Health Insurance Portability
and Accountability Act (HIPAA). As such, the study received IRB or ethical
committee approval, and the requirement for informed consent was waived.
Author details
1
Department of Radiology, The First Affiliated Hospital, Sun Yat-Sen
University, 58th, The Second Zhongshan Road, Guangzhou, Guangdong
510080, China. 2Department of Radiology, Hospital of Stomatology,
Guanghua School of Stomatology, Guangdong Provincial Key Laboratory of
Stomatology, Sun Yat-Sen University, Guangzhou 510055, China. 3Medical
Imaging Department, Union Hospital, Hong Kong, 18 Fu Kin Street, Tai Wai,
Shatin, N.T, Hong Kong.
Received: 22 April 2016 Accepted: 25 July 2016
References
1. Cancer research UK />cancer-statistics/worldwide-cancer 2014;2:14
2. Inoue T, Kudo M, Komuta M, et al. Assessment of Gd-EOB-DTPA-enhanced
MRI for HCC and dysplastic nodules and comparison of detection sensitivity
versus MDCT. J Gastroenterol. 2012;47(9):1036–47.
3. Ichikawa T, Sano K, Morisaka H. Diagnosis of pathologically early HCC with
EOB-MRI: experiences and current consensus. Liver Cancer. 2014;3(2):97–107.
4. Ding Y, Rao SX, Meng T, Chen C, Li R, Zeng MS. Usefulness of T1 mapping
on Gd-EOB-DTPA-enhanced MR imaging in assessment of non-alcoholic
fatty liver disease. Eur Radiol. 2014;24(4):959–66.
5. Yoshimura N, Saito K, Saguchi T, et al. Distinguishing hepatic hemangiomas
from metastatic tumors using T1 mapping on gadoxetic-acid-enhanced
MRI. Magn Reson Imaging. 2013;31(1):23–7.
6. Hamm B, Staks T, Muhler A, et al. Phase I clinical evaluation of Gd-EOB-DTPA
as a hepatobiliary MR contrast agent: safety, pharmacokinetics, and MR
imaging. Radiology. 1995;195(3):785–92.
7. Tanimoto A, Lee JM, Murakami T, Huppertz A, Kudo M, Grazioli L. Consensus
report of the 2nd International Forum for Liver MRI. Eur Radiol. 2009;19
Suppl 5:S975–89.
8. Haimerl M, Verloh N, Zeman F, et al. Assessment of clinical signs of liver
cirrhosis using T1 mapping on Gd-EOB-DTPA-enhanced 3T MRI. Plos One.
2013;8(12), e85658.
9. Chou CT, Chou JM, Chang TA, et al. Differentiation between dysplastic
nodule and early-stage hepatocellular carcinoma: the utility of conventional
MR imaging. World J Gastroenterol. 2013;19(42):7433–9.
10. Kim SH, Kim SH, Lee J, et al. Gadoxetic acid-enhanced MRI versus triplephase MDCT for the preoperative detection of hepatocellular carcinoma.
AJR Am J Roentgenol. 2009;192(6):1675–81.
11. Frericks BB, Loddenkemper C, Huppertz A, et al. Qualitative and quantitative
evaluation of hepatocellular carcinoma and cirrhotic liver enhancement
using Gd-EOB-DTPA. AJR Am J Roentgenol. 2009;193(4):1053–60.
12. Katsube T, Okada M, Kumano S, et al. Estimation of liver function using T1
mapping on Gd-EOB-DTPA-enhanced magnetic resonance imaging. Invest
Radiol. 2011;46(4):277–83.
13. Katsube T, Okada M, Kumano S, et al. Estimation of liver function using T2*
mapping on gadolinium ethoxybenzyl diethylenetriamine pentaacetic acid
enhanced magnetic resonance imaging. Eur J Radiol. 2012;81(7):1460–4.
14. Ding Y, Rao SX, Chen C, Li R, Zeng MS. Assessing liver function in patients
with HBV-related HCC: a comparison of T1 mapping on Gd-EOB-DTPAenhanced MR imaging with DWI. Eur Radiol. 2015;25(5):1392–8.
15. Zhou L, Rui JA, Wang SB, Chen SG, Qu Q. Early recurrence in large
hepatocellular carcinoma after curative hepatic resection: prognostic
significance and risk factors. Hepatogastroenterology. 2014;61(135):2035–41.
16. Zhou L, Rui JA, Wang SB, Chen SG, Qu Q. Risk factors of microvascular
invasion, portal vein tumor thrombosis and poor post-resectional survival in
HBV-related hepatocellular carcinoma. Hepatogastroenterology. 2014;
61(134):1696–703.
Page 7 of 7
17. Chou CT, Chen RC, Lin WC, Ko CJ, Chen CB, Chen YL. Prediction of
microvascular invasion of hepatocellular carcinoma: preoperative CT and
histopathologic correlation. AJR Am J Roentgenol. 2014;203(3):W253–9.
18. Kwon SK, Yun SS, Kim HJ, Lee DS. The risk factors of early recurrence after
hepatectomy in hepatocellular carcinoma. Ann Surg Treat Res. 2014;86(6):283–8.
19. Wang K, Liu G, Li J, et al. Early intrahepatic recurrence of hepatocellular
carcinoma after hepatectomy treated with re-hepatectomy, ablation or
chemoembolization: a prospective cohort study. Eur J Surg Oncol. 2015;
41(2):236–42.
20. Chen HW, Qiao HY, Li HC, et al. Prognostic significance of Nemo-like kinase
expression in patients with hepatocellular carcinoma. Tumour Biol. 2015.
doi:10.1007/s13277-015-3609-6.
21. Yu SJ, Won JK, Ryu HS, et al. A novel prognostic factor for hepatocellular
carcinoma: protein disulfide isomerase. Korean J Intern Med. 2014;29(5):580–7.
22. Chen H, Miao J, Li H, et al. Expression and prognostic significance of p21activated kinase 6 in hepatocellular carcinoma. J Surg Res. 2014;189(1):81–8.
23. Zhang Z, Qin C, Wu Y, Su Z, Xian G, Hu B. CCR9 as a prognostic marker and
therapeutic target in hepatocellular carcinoma. Oncol Rep. 2014;31(4):1629–36.
24. Vogl TJ, Stupavsky A, Pegios W, et al. Hepatocellular carcinoma: evaluation
with dynamic and static gadobenate dimeglumine-enhanced MR imaging
and histopathologic correlation. Radiology. 1997;205(3):721–8.
25. Nakamura Y, Tashiro H, Nambu J, et al. Detectability of hepatocellular
carcinoma by gadoxetate disodium-enhanced hepatic MRI: tumor-by-tumor
analysis in explant livers. J Magn Reson Imaging. 2013;37(3):684–91.
26. Chinese Ministry of Health. Guideline for management of primary HCC. Chin
Clin Oncol. 2011;16(10):929–46.
27. Lee MH, Kim SH, Parket MJ, et al. Gadoxetic acid-enhanced hepatobiliary
phase MRI and high-b-value diffusion-weighted imaging to distinguish welldifferentiated hepatocellular carcinomas from benign nodules in patients
with chronic liver disease. AJR Am J Roentgenol. 2011;197(5):W868–75.
28. Chang WC, Chen RC, Chou CT, et al. Histological grade of hepatocellular
carcinoma correlates with arterial enhancement on gadoxetic acid-enhanced
and diffusion-weighted MR images. Abdom Imaging. 2014;39(6):1202–12.
29. Schelhorn J, Best J, Dechene A, et al. Evaluation of combined Gd-EOB-DTPA
and gadobutrol magnetic resonance imaging for the prediction of
hepatocellular carcinoma grading. Acta Radiol. 2015. doi:10.1177/
0284185115616293.
30. Choi JW, Lee JM, Kim SJ, et al. Hepatocellular carcinoma: imaging patterns
on gadoxetic acid-enhanced MR Images and their value as an imaging
biomarker. Radiology. 2013;267(3):776–86.
31. Yang GH, Wu ZB. Chinese surgical pathology volume 1. Beijing: People's
Medical Publishing House; 2002.
32. Tsuda N, Kato N, Murayama C, Narazaki M, Yokawa T. Potential for
differential diagnosis with gadolinium-ethoxybenzyl-diethylenetriamine
pentaacetic acid-enhanced magnetic resonance imaging in experimental
hepatic tumors. Invest Radiol. 2004;39(2):80–8.
33. Narita M, Hatano E, Arizono S, et al. Expression of OATP1B3 determines
uptake of Gd-EOB-DTPA in hepatocellular carcinoma. J Gastroenterol. 2009;
44(7):793–8.
34. Motosugi U, Ichikawa T, Sou H, et al. Liver parenchymal enhancement of
hepatocyte-phase images in Gd-EOB-DTPA-enhanced MR imaging: which
biological markers of the liver function affect the enhancement? J Magn
Reson Imaging. 2009;30(5):1042–6.
35. Leonhardt M, Keiser M, Oswald S, et al. Hepatic uptake of the magnetic
resonance imaging contrast agent Gd-EOB-DTPA: role of human organic
anion transporters. Drug Metab Dispos. 2010;38(7):1024–8.
36. Ikema S, Takumi S, Maeda Y, et al. Okadaic acid is taken-up into the cells
mediated by human hepatocytes transporter OATP1B3. Food Chem Toxicol.
2015. doi:10.1016/j.fct.2015.06.006.
37. Chen C, Wu ZT, Ma LL, et al. Organic anion-transporting polypeptides
contribute to the hepatic uptake of berberine. Xenobiotica. 2015. doi:10.
3109/00498254.2015.
38. Ebner T, Ishiguro N, Taub ME. The use of transporter probe drug cocktails
for the assessment of transporter-based drug-drug interactions in a clinical
setting-proposal of a four component transporter cocktail. J Pharm Sci.
2015. doi:10.1002/jps.24489.
39. Takumi S, Ikema S, Hanyu T, et al. Naringin attenuates the cytotoxicity of
hepatotoxin microcystin-LR by the curious mechanisms to OATP1B1- and
OATP1B3-expressing cells. Environ Toxicol Pharmacol. 2015;39(2):974–81.