Role of autophagy and lysosomal drug sequestration in acquired resistance to doxorubicin in MCF-7 cells
Bạn đang xem bản rút gọn của tài liệu. Xem và tải ngay bản đầy đủ của tài liệu tại đây (3.32 MB, 18 trang )
Guo et al. BMC Cancer (2016) 16:762
DOI 10.1186/s12885-016-2790-3
RESEARCH ARTICLE
Open Access
Role of autophagy and lysosomal drug
sequestration in acquired resistance to
doxorubicin in MCF-7 cells
Baoqing Guo1, Adam Tam2, Stacey A. Santi1 and Amadeo M. Parissenti1,2,3,4*
Abstract
Background: The roles and mechanisms involved in starvation-induced autophagy in mammalian cells have been
extensively studied. However, less is known about the potential role for autophagy as a survival pathway in
acquired drug resistance in cancer cells under nutrient-rich conditions.
Methods: We selected MCF-7 breast tumor cells for survival in increasing concentrations of doxorubicin and
assessed whether the acquisition of doxorubicin resistance was accompanied by changes in doxorubicin and
lysosome localization and the activation of autophagy, as assessed by laser scanning confocal microscopy with or
without immunohistochemical approaches. The ultrastructure of cells was also viewed using transmission electron
microscopy. Cellular levels of autophagy and apoptosis-related proteins were assessed by immunoblotting
techniques, while protein turnover was quantified using a flux assay.
Results: As cells acquired resistance to doxorubicin, the subcellular location of the drug moved from the nucleus to
the perinuclear region. The location of lysosomes and autophagosomes also changed from being equally
distributed throughout the cytoplasm to co-localizing with doxorubicin in the perinuclear region. There was an
apparent temporal correlation between the acquisition of doxorubicin resistance and autophagy induction,
as measured by increases in monodansylcadaverine staining, LC3-II production, and co-localization of LAMP1 and
LC3-II immunofluorescence. Electron microscopy revealed an increase in cytoplasmic vacuoles containing
mitochondria and other cellular organelles, also suggestive of autophagy. Consistent with this view, a known
autophagy inhibitor (chloroquine) was highly effective in restoring doxorubicin sensitivity in doxorubicin-resistant
cells. Moreover, this induction of autophagy correlated temporally with increased expression of the selective cargo
receptor p62, which facilitates the delivery of doxorubicin-damaged mitochondria and other organelles to
autophagosomes. Finally, we suggest that autophagy associated with doxorubicin resistance may be distinct from
classical starvation-induced autophagy, since Beclin 1 and Atg7 expression did not change upon acquisition of
doxorubicin resistance, nor did recombinant Bcl2 overexpression or an Atg7 knockdown alter doxorubicin
cytotoxicity.
Conclusion: Taken together, our findings suggest that doxorubicin resistance in MCF-7 breast cancer cells is
mediated, at least in part, by the activation of autophagy, which may be distinct from starvation-induced
autophagy.
Keywords: Drug resistance, Doxorubicin, Autophagy, Drug sequestration, Lysosomes, Breast tumour cells,
* Correspondence:
1
Health Sciences North Research Institute, Sudbury, ON P3E 5J1, Canada
2
Department of Biology, Laurentian University, Sudbury, ON P3E 2C6, Canada
Full list of author information is available at the end of the article
© 2016 The Author(s). Open Access This article is distributed under the terms of the Creative Commons Attribution 4.0
International License ( which permits unrestricted use, distribution, and
reproduction in any medium, provided you give appropriate credit to the original author(s) and the source, provide a link to
the Creative Commons license, and indicate if changes were made. The Creative Commons Public Domain Dedication waiver
( applies to the data made available in this article, unless otherwise stated.
Guo et al. BMC Cancer (2016) 16:762
Background
Autophagy is a normal physiological mechanism for
cellular homeostasis, whereby damaged or defective cellular components, including mitochondria [1], the endoplasmic reticulum [2] and peroxisomes [3], are digested
within the cell by fusion with lysosomes. A basal level of
autophagy occurs in all cells to ensure that only functional organelles are retained [4]. Autophagy can also be
induced by external stressors such as growth factor
deprivation [5] or upon exposure to specific chemotherapy drugs [6–11]. The ultimate fate of cells under stress
depends upon the net effect of apoptotic versus survival
signals, often regulated by important cellular regulatory
proteins such as Bcl2 and p53 [12, 13]. Under nutrient
limiting conditions, autophagy permits cells to survive
by metabolizing their own organelles as a source of
energy. However, this survival mechanism is considered
a “double-edged sword”, since cells can also die by
prolonged autophagy (also referred to as type II
programmed cell death) [14–16].
A number of investigations suggest that autophagy
induction can promote resistance to cell death within
tumor cells and has important implications for resistance to chemotherapy in cancer treatment [17]. For
instance, up-regulation of autophagy by the drug rapamycin can protect several tumor cell lines from cell
death through apoptosis [18]. In addition, the DNA
damaging agents temozolomide and etoposide were
found to induce an autophagy-associated increase in
ATP production in multiple glioma cell lines, which
protects the cells from death, possibly contributing to
resistance to these drugs [19]. Activation of autophagy
was also observed when growth factors were withdrawn
in apoptosis-deficient cells [20]. It has also been suggested that autophagy induction may be associated with
imatinib resistance in mouse lymphoid cells [11].
However, a definitive role for autophagy in acquired
resistance to cytotoxic chemotherapy drugs, including a
temporal association between acquired drug resistance
and autophagy induction, has yet to be demonstrated.
It has been previously demonstrated that most of the
weakly basic chemotherapeutic drugs, such as DNAbinding anthracyclines, can accumulate in lysosomes,
especially in drug resistant cells [21–25]. Therefore,
sequestration of chemotherapy drugs in lysosomes is
widely considered to be a bona fide mechanism of resistance to weakly basic chemotherapy drugs in cancer cells.
The use of lysosomotropic agents to restore the sensitivity
of drug-resistant cells to chemotherapeutic drugs has been
widely investigated [26, 27], as reviewed by Agostinelli
[28] and Kaufmann [29]. As these agents inhibit vacuolar
H+-ATPase [30] or change lysosomal membrane permeability [31–33], they would be expected to block the
accumulation of weakly basic chemotherapy drugs in
Page 2 of 18
lysosomes. Lysosomotropic agents such as chloroquine
have recently been shown to promote the ability of the
chemotherapy drug paclitaxel to kill cancer stem cells
through the inhibition of autophagic survival [34].
In this study, we investigated the role of autophagy
and lysosomal drug sequestration in the acquisition of
doxorubicin resistance in MCF-7 breast tumor cells.
This involved the study of a panel of MCF-7 cells developed in our laboratory, whereby MCF-7 breast tumor
cells were selected for survival in increasing concentrations of doxorubicin (MCF-7DOX2 cells). Aliquots of cells
were retained at each doxorubicin dose elevation. These
cells do not express several drug transporters associated
with doxorubicin resistance in vitro, including Abcb1,
Abcc2, or Abcg2. We did, however, observe elevated expression of the Abcc1 protein at the highest doxorubicin
selection dose (dose 12) [35]. Using this panel of cell
lines, we show in this study a strong temporal association between the acquisition of doxorubicin resistance
and both the induction of autophagy and the sequestration of doxorubicin into lysosomes. We further provide
evidence suggesting that the autophagy associated with
doxorubicin resistance is distinct from starvationinduced autophagy. Blockage of this autophagy mechanism may represent a novel approach to cancer therapy,
in particular for treatment of recurrent disease after
prior chemotherapy administration.
Methods
This study did not require ethics approval from an ethics
review committee or board because the study did not
involve animals, humans, human data, or material collected from humans or animals.
Maintenance of MCF-7 cells and establishment of drug resistant variants
Human MCF-7 breast cancers cells (lot HTB-22, American
Tissue Culture Collection) were grown in Dulbecco’s H21
medium (Princess Margaret Hospital, Toronto, ON)
containing 10 % fetal bovine serum (FBS) (Hyclone), and
incubated at 37 °C in a humidified 5 % CO2 atmosphere.
Doxorubicin-resistant MCF-7DOX2 cells were generated in
our laboratory by selecting MCF-7 cells for resistance to
increasing concentrations (doses) of doxorubicin (PFS, USP,
Pfizer), as described previously [35]. The passage numbers
for the doxorubicin-resistant MCF-7 cell lines at selection
doses 8 through 12 are 203, 216, 220, 227 and 257, respectively. As controls, parental MCF-7 cells were identically “selected” in the absence of drug to identical passage numbers.
These cell lines are referred to as “co-cultured control cell
lines” for the above selection doses and help to account for
any changes in drug sensitivity or other cell phenotypes
associated with increased passage in culture. All of the cells
used in experiments were not subcultured for more than
Guo et al. BMC Cancer (2016) 16:762
10 passages after thawing from frozen stocks. The parental
cell line (MCF-7) has been authenticated by the American
Tissue Culture Collection and all cell lines are free of
mycoplasma contamination.
Measurement of cellular drug sensitivity
The sensitivity of cells to doxorubicin at various doxorubicin selection doses was measured using a clonogenic
assay as described previously [36]. The concentration of
doxorubicin at which the number of colonies formed in
the assay was reduced by 50 % (the IC50) was computed
for both MCF-7CC and MCF-7DOX2 cells. The degree of
drug resistance in MCF-7DOX2 cells (the resistance
factor) was then determined by dividing the IC50 value
for MCF-7DOX2 cells (at that selection dose) by the IC50
value for MCF-7CC cells (at a similar passage number).
As an example of cell nomenclature, MCF-7DOX2–10 and
MCF-7CC10 cells represent cells selected in the presence
of doxorubicin to dose level 10 and their co-cultured
control cells at that selection dose, respectively.
Localization of cellular organelles and proteins by
confocal microscopy
The location of mitochondria, lysosomes, and autophagosomes (and their possible co-localization with doxorubicin) in MCF-7CC10 and MCF-7DOX2–10 cells were
investigated using laser scanning confocal microscopy
after staining with MitoTracker® (red fluorescence) or
LysoTracker® (green fluorescence), both from Molecular
Probes, Thermo Fisher Scientific), or monodansyl cadeverine (MDC) from Sigma-Aldrich Chemicals, respectively. All images were obtained by confocal miscroscopy
(model 510 Meta, Carl Zeiss, Toronto, ON) using lasers
at specific wavelengths or under UV light. The location
of doxorubicin was also visualized through confocal
microscopy, since the drug naturally has red fluorescence. For the above experiments, MCF-7CC10 and
MCF-7DOX2–10 cells were grown on glass coverslips for
2 days in the absence of drug in a 6 cm tissue culture
plate covered with tissue culture medium. The cells were
then treated with 2 μM doxorubicin [alone or together
with 10 μM chloroquine (Sigma-Aldrich Chemicals)] for
8 and 48 hours for MCF-7CC10 and MCF-7DOX2–10 cells,
respectively. The concentration of doxorubicin chosen
for these experiments, while much higher than necessary
for cytotoxicity, was the minimum concentration that
permitted reliable visualization of the drug’s location in
cells by its fluorescence. After staining with 50 nM LysoTracker® (using the manufacturer’s protocol) or staining
with 50 μM MDC for 10 min, the coverslips were
washed briefly in PBS and mounted on glass slides for
examination by laser scanning confocal microscopy. All
the images were taken using the same parameters for accurate comparison between treatments in one particular
Page 3 of 18
experiment, with the aid of an Argon laser excitation at
488 nm and emission at 560 nm (with a LP filter for
doxorubicin fluorescence) and excitation at 458 nm and
emission at 505–530 nm (with a BP filter for LysoTracker® fluorescence). Cells were stained with MDC
after LysoTracker® staining. The filters for obtaining
images by laser scanning microscope were set to Fset01
(blue), Fset17 (green) and Fset28 (red) and excited with
UV light.
The locations of autophagosomes and lysosomes were
also assessed by immunofluorescence using antibodies
against LC3 (Cat# 2775, Cell Signaling) and LAMP1
(Cat# Sc-20011 H4A3, Santa Cruz), respectively, in an
approach similar to that described by Nakagawa et al.
[37]. According to the manufacturer, the former
antibody preferentially binds to LC3 conjugated to phosphatidylethanolamine (LC3-II), which is recruited to
autophagosomal membranes [38]. Hence, it is highly
useful for visualizing the location of autophagosomes.
Mitochondria were visualized by laser scanning confocal
microscopy after staining with MitoTracker™ (Thermo
Fisher). Both MCF-7DOX2–10 and MCF-7CC10 cells were
grown on glass coverslips with or without prior
treatment with 50 nM bafilomycin A1 for 24 h (to block
the turnover of LC3-II, once formed). The cells on
coverslips were fixed with 4 % formaldehyde in PBS.
Immunocytochemical staining of cells with either
anti-LC3 or anti-LAMP1 antibodies was performed as
described by the manufacturer (Cell Signaling). Goat
anti-rabbit IgG-TR (Cat# sc-2780, Santa Cruz) and goat
anti-mouse IgG-FITC (Cat# sc-2010, Santa Cruz)
secondary antibodies were used for detection of the LC3
or LAMP1 antibodies. To confirm the consistency of
LC3 and LAMP1 staining, two fluorophores were
switched between two secondary antibodies for the two
color staining. For assessment of the location of mitochondria and autophagosomes, cells were labeled with
50 nM MitoTracker™ for 15 min prior to fixation.
Immunostaining was then performed using the antiLC3-II and goat anti-rabbit IgG-FITC antibodies. The
settings for fluorescence detection were the same as
described above. Images chosen were highly representative of cells views in a minimum of 5 fields (5–10 cells
per field) from duplicate slides obtained in 2 to 3
independently performed experiments.
Transmission electron microscopy
For visualization of cellular ultrastructure by electron
microscopy, cells were grown in 10 cm petri dishes to
about 70 % confluence, after which the cells were
released by trypsin treatment, washed once with PBS,
and harvested by centrifugation. The cell pellet was
resuspended in 10 ml of ice cold 3 % glutaraldehyde
fixative in 0.1 M sodium cacodylate buffer (pH 7.2) for
Guo et al. BMC Cancer (2016) 16:762
35 min at 4 °C. The cells were then collected by centrifugation and resuspended in 1 ml of ice cold 0.2 M
sodium cacodylate buffer (pH 7.2). The samples were
then sent to the University of Western Ontario with cold
packs for embedding, sectioning, and visualization by
electron microscopy.
Immunoblotting experiments using whole cell lysates
Whole cell extracts of cells were prepared in modified
RIPA buffer containing 1 % NP40, 0.5 % sodium deoxycholate, 1 % SDS, and 1 Complete™ protease inhibitor
tablet for every 50 ml of buffer. Cultured cells were
grown as a monolayer for 2 days until cell density
reached 50–60 % confluence in 10 cm tissue culture
plates. Twenty-four hours prior to protein extraction,
the cells were treated with or without 50 nM bafilomycin A1 for 24 h under standard mammalian cell culture
conditions. The culture medium was removed and the
cells rinsed twice with PBS. To each plate, 0.7 ml of
chilled modified RIPA buffer was added. The cells were
scraped from the plates using a cell lifter, transferred to
a 1.5 ml microfuge tube, and passed through a 21 gauge
needle repeatedly to ensure efficient cell lysis and to
shear any DNA present. The protein concentration for
the whole cell extracts was determined using the BCA
protein assay reagent kit (Pierce). Protein samples
(30 μg) from whole cell extracts were used for
SDS-PAGE analysis on 12 % or 10 % polyacrylamide gels
based on the molecular weight of the target protein.
Electrophoresis, protein transfer and immunoblotting
were performed using standard procedures.
Measurement of the degradation of long-lived proteins
(flux assay)
The degradation of long-lived proteins was measured using
a modification of the standard “flux assay” [39]. Cells were
seeded in 6-well plates for 48 h in DMEM-H21 medium
with 5 % FBS in a humidified incubator with 5 % CO2.
When the cell density reached about 50–60 % confluence,
the medium was replaced with fresh medium supplemented with 0.2 μCi/mL [14C (U)] L-valine (MC-277,
Moravek Biochemicals) and incubated for 24 h at 37 °C.
Unincorporated radioisotope was then removed by three
PBS washes. Cells were then incubated with 10 mM
unlabeled valine (Sigma-Aldrich) for 3 h to allow for shortlived protein turnover. The medium was then replaced with
fresh medium containing 10 mM unlabeled valine in the
absence or presence of 10 μM chloroquine or 1 μM
rapamycin (R8781, Sigma-Aldrich) in order to inhibit or
activate autophagy, respectively. After a 24 or 48 h incubation period, the medium was collected from the wells. The
medium with some detached cells was mixed with BSA
(5 mg/ml final concentration) and 10 % trichloroacetic acid
(TCA; Sigma-Aldrich), after which proteins in the medium
Page 4 of 18
were allowed to precipitate at 4 °C for 30 min. The precipitated proteins (along with detached cells) were harvested by
centrifugation at 600 × g for 10 min, leaving behind soluble
radiolabeled proteins in the supernatant. The adherent cells
remaining in the tissue culture flasks were also collected by
scraping in 0.5 ml of 10 % TCA, after which proteins were
allowed to precipitate at 4 °C for 30 min. The cells and
precipitated proteins where then harvested by centrifugation at 600 × g for 10 min, again leaving behind soluble
proteins in the supernatant. Fifty μl of the supernatant from
cells and 222 μl of supernatant from the medium were
combined and added to scintillation vials with 5 ml of
scintillation fluid. This mixture represents the acid-soluble
radioactivity from degraded proteins. The TCA-precipitated
protein preparations from the detached cells in the medium
and adherent cells were each solubilized in 500 μl of
solubilization buffer (0.1 N NaOH + 0.1 % SDS). Fifty μl
from each solubilized pellet was then added to scintillation
vials with 5 ml of scintillation fluid. This mixture constituted the TCA-percipitable radioactivity from both
detached and adherent cells. After allowing the vials to sit
overnight at room temperature, the radioactivity in the vials
was quantified by liquid scintillation counting (Beckman
Coulter LS6500). The total protein degradation (% proteolysis) was measured by dividing the TCA-soluble
radioactivity by the radioactivity in the precipitated
proteins. For all experiments, values were reported as
means ± S.D. (n = 3). Statistical differences between the two
groups were determined by the Student’s t-test with Sigma
plot 11.0 for Microsoft Windows. An identical experiment
without isotope labeling was performed for protein extraction and immunoblot analysis of LC3-II expression after
48 h treatment.
Inhibition of ATG7 expression by siRNA interference
MCF-7CC10 and MCF-7DOX2–10 cells were grown on
10 cm plates to 30–40 % confluence in antibiotic-free
DMEM medium supplemented with 10 % FBS and left
to adhere overnight. The next day, the culture media
was removed and the cells were washed with PBS, after
which 12 ml of Opti-MEM I media (Invitrogen) were
added to each plate prior to cell transfection with Lipofectamine 2000 (Invitrogen), using the manufacturer’s
instructions. Briefly, an ATG7-specific siRNA oligo
(Ambion Silencer® Select) was added to 1.5 ml of OptiMEM I medium at a 20 nM final concentration in 1 well
of a 6-well plate. In a separate well, 30 μl of Lipofectamine 2000 was added to 1.5 ml of Opti-MEM I medium.
After 5 min incubation, the two solutions were mixed
(3 ml in total). An identical procedure was performed
for a Silencer® Select negative control siRNA (Ambion).
The mixture was incubated for 20 min, then added to
cultures of the above cell lines. The plates were incubated at 37 °C for 24 h, after which the medium was
Guo et al. BMC Cancer (2016) 16:762
removed and replaced with antibiotic-free DMEM
medium, supplemented with 10 % FBS. At 48 h posttransfection, the cells were washed, trypsinized, counted,
and plated for either a clonogenic assay or a flux assay
(as described above). An aliquot of cells was retained
from each transfection and proteins extracted (also as
described above) in order to assess the efficiency of gene
knockdown using immunoblotting experiments. The
siRNA sequences used in the study are as follows: ATG7-1:
5′-GGAACACUGUAUAACACCAtt-3′ and 5′-UGGUGU
UAUACAGUGUUCCaa-3′. ATG7-3: 5′-GAAGCUCCCA
AGGACAUU-Att-3′ and 5′-UAAUGUCCUUGGGAGCU
UCat-3′.
Results
Acquisition of resistance to doxorubicin in MCF-7 cells
and restoration of sensitivity by chloroquine treatment
Using clonogenic assays to measure drug sensitivity, we
observed that resistance to doxorubicin in MCF-7 cells
Page 5 of 18
was acquired when the doxorubicin selection concentration reached or exceeded a specific ‘threshold’ dose, as
we described previously [35]. The doxorubicin concentrations corresponding to the various selection doses
(1 through 12) have been previously published [35]. Drug
resistance was acquired at selection dose 9 (IC50 of
29 nmol/L; resistance factor 1.4; Fig. 1b). Cell lines were
named to distinguish them from a prior round of selection
(selection 2 in this case) and to reflect the maximum dose
to which cells were selected. For example, MCF-7DOX2
cells selected in doxorubicin to dose level 10 were referred
to as MCF-7DOX2–10 cells, while equivalent MCF-7CC cells
“selected” in the absence of drug to the same passage
number were referred to as MCF-7CC10 cells. Strong
resistance to doxorubicin (>2-fold) was only achieved
when the doxorubicin selection dose reached 44 nmol/L
(dose 10; IC50 of 75 nmol/L; resistance factor 2.5–2.7, as
depicted in Figs. 1a and b. Resistance then progressively
increased with increasing doxorubicin concentrations up
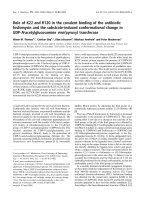
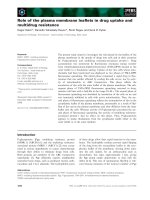
Fig. 1 Doxorubicin sensitivity for various cell lines with or without the autophagy inhibitor chloroquine. The sensitivity of MCF-7DOX2 cells to
doxorubicin was measured using a clonogenic assay. Cells were selected in increasing concentrations of doxorubicin to selection doses 7
(6.5 nM), 8 (19 nM), 9 (29 nM), 10 (44 nM), 11 (65 nM) and 12 (98.1 nM). The doxorubicin sensitivity of MCF-7 cells selected in the absence of
doxorubicin to a passage number equal to dose level 10 (MCF-7CC10 cells) was also assessed (panels a and b). The sensitivity of the MCF-7DOX2–10
and MCF-7CC10 cell lines to doxorubicin in the absence or presence of chloroquine was also assessed (c). Chloroquine was dissolved in water, thus
negating the need for a vehicle control in these experiments. Resistance factors represent the extent of resistance to doxorubicin, as calculated
by dividing the IC50 of the drug-selected cell lines by the IC50 for its co-cultured control at the same passage number. The data points in Fig. 1a
represent the average (± S. E.) of six independent experiments. The data points in Fig. 1b and c are representative of three
independent experiments
Guo et al. BMC Cancer (2016) 16:762
to a maximally tolerated selection dose of 98 nmol/L at
dose 12 (IC50 of 200 nmol/L; resistance factor 21). Data
for selection doses 8 to 12 are depicted in Fig. 1b. Selection doses 8, 9, 10, 11, and 12 were 6.5, 19, 29, 44, 65, and
98 nM doxorubicin, respectively. “Co-cultured control”
(MCF-7CC) cells exhibited little change in sensitivity to
doxorubicin, despite long-term propagation in cell culture
(data not shown).
To begin to assess whether autophagy might be
involved in doxorubicin resistance, doxorubicin sensitivity was examined for MCF-7CC and MCF-7DOX2 cells in
the absence or presence of chloroquine—a compound
known to inhibit autophagy by blocking the fusion of
autophagosomes to lysosomes [40, 41]. As demonstrated
in Fig. 1c, chloroquine treatment strongly increased
sensitivity of MCF-7DOX2–10 cells to doxorubicin. In fact,
sensitivity of MCF-7DOX2–10 cells to doxorubicin in the
presence of chloroquine was almost equivalent to MCF7CC10 cells. Interestingly, chloroquine had no effect on
doxorubicin sensitivity in MCF-7CC10 cells (Fig. 1b).
These findings suggest that acquisition of doxorubicin
resistance at dose level 10 (44 nM selection dose) may
be associated with induction of autophagy, since blockage of autophagy restored sensitivity to doxorubicin.
Altered doxorubicin localization in MCF-7DOX2–10 cells
Because of the autofluorescent property of doxorubicin,
the distribution of this drug within cells could be
observed using laser scanning confocal microscopy. We
thus used this approach to visualize the location of
doxorubicin within wildtype and doxorubicin-resistant
cells. The drug was clearly localized predominantly
within the nucleus of MCF-7CC10 cells, with some very
minor punctate fluorescence within the cytoplasm
(Fig. 2b). While single plane images of these cells suggest that most of doxorubicin is localized to the nuclear
membrane, three dimensional views by stacking of the
planar images indicated that the drug localized to
regions within the nucleus (data not shown). A very
small amount of drug appeared to be located on the
nuclear membrane. In contrast, doxorubicin fluorescence was considerably reduced in MCF-7DOX2–10 cells,
even after 48 h of incubation with the drug. The majority of the drug was localized to the perinuclear region
in these cells (Fig. 2e). These findings suggest reduced
doxorubicin accumulation into MCF-7DOX2–10 cells, of
which the majority of the drug was not associated with
its target (extranuclear). This could account, at least in
part, for the observed resistance to doxorubicin. Subsequent drug uptake studies with radiolabelled doxorubicin confirmed the strongly reduced drug accumulation
into MCF-7DOX2–10 cells relative to MCF-7CC10 cells
(data not shown).
Page 6 of 18
Clustering of lysosomes upon selection for doxorubicin
resistance
To identify the organelles within the perinuclear region
to which doxorubicin may localize in MCF-7DOX2 cells,
we visualized the location of lysosomes and mitochondria in MCF-7CC10 and MCF-7DOX2–10 cells using Lysotracker® and Mitotracker™, respectively. Interestingly, we
observed that the distribution of lysosomes changed as
cells developed resistance to doxorubicin. Lysosomes
were evenly distributed throughout the cytoplasm in
MCF-7CC10 cells (Fig. 2a). In contrast, these organelles
were found to be clustered within the perinuclear region
in MCF-7DOX2–10 cells, as indicated by intense punctate
staining in a crescent shape towards one side of the
nucleus (Fig. 2d). Moreover, unlike in MCF-7CC10 cells,
the lysosomes in MCF-7DOX2–10 cells exhibited a very
similar subcellular distribution pattern to that of doxorubicin, although some doxorubicin remained associated
with the nucleus in MCF-7DOX2–10 cells (compare Fig. 2d
and e).
Co-localization of doxorubicin and Lysotracker® staining
in MCF-7DOX2–10 cells
As both doxorubicin and Lysotracker® staining in MCF7DOX2–10 cells appeared as clustered granules in the
perinuclear region, we then assessed whether there was
co-localization of doxorubicin and Lysotracker® staining
by incubating MCF-7CC10 and MCF-7DOX2–10 cells with
LysoTracker® after doxorubicin treatment. It was found
that doxorubicin staining in MCF-7DOX2–10 cells co-localized for the most part with Lysotracker® staining, as
visualized in the overlay images of green and red fluorescence exhibited in Fig. 2f. Some areas of clear green
fluorescence in the overlay images (Fig. 2f) suggested
that not all lysosomes contained doxorubicin. Addition
of bafilomycin A1, a vacuolar H+-ATPase inhibitor that
reduces vesicle acidification [42–44] almost completely
eliminated the punctate lysosomal staining by LysoTracker® in MCF-7DOX2–10 cells (data not shown). In
addition, the 30 min pre-incubation of these cells with
bafilomycin A1 caused a complete loss of perinuclear
doxorubicin accumulation, with no co-localization with
lysosomes in the vast majority of cells (data not
shown).
Perinuclear lysosomes containing doxorubicin also exhibit
positive monodansyl cadaverine staining
Monodansyl cadaverine (MDC) is an autofluorescent
dye shown empirically to localize to late autophagolysosomes but not endosomes in cells [45] This dye, when
trapped in acidic and membrane-rich organelles, exhibits
increased fluorescence. To provide evidence of a link
between the acquisition of doxorubicin resistance and
increased autophagy (which requires the formation of
Guo et al. BMC Cancer (2016) 16:762
Page 7 of 18
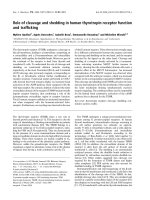
Fig. 2 Distribution of lysosomes and doxorubicin in MCF-7CC10 and MCF-7DOX2–10 cells. Lysosomes in cells were visualized by laser scanning confocal
microscopy after labelling with LysoTracker® and appeared green in colour. Doxorubicin distribution is depicted in red due to its autofluorescent nature.
The images in this figure are representative of approximately 100 cells viewed on two separately stained slides in two independent experiments. Each
image represents at least 10 microscopic photos taken from the two experiments. The localization of lysosomes and doxorubicin was also confirmed in
three dimensions using stacked images obtained by confocal microscopy (data not shown) in two replicate experiments
autophagolysosomes), we then compared the MDC
staining of MCF-7CC10 and MCF-7DOX2–10 cells after
incubation with doxorubicin, followed by Lysotracker®
staining. Visualization of the blue MDC staining and the
green Lysotracker® staining in MCF-7DOX2–10 cells
revealed that, for the most part, there was a strong
co-localization of the blue and green fluorescence, yielding autophagolysosomes exhibiting a bright blue hue
(Fig. 3b). If cells were treated with red-fluorescing
doxorubicin prior to staining with MDC and Lysotracker®, there was a strong co-localization of blue,
green, and red fluorescence, yielding lysosomes of a
bright violet color (Fig. 3d). These findings suggested
that many of the lysosomes containing doxorubicin may
also have been autophagolysosomes. Similar experiments
in MCF-7CC10 cells revealed, not surprisingly, that there
was some co-localized Lysotracker® and MDC staining
(ie. some of the lysosomes were autophagolysosomes),
Guo et al. BMC Cancer (2016) 16:762
Fig. 3 (See legend on next page.)
Page 8 of 18
Guo et al. BMC Cancer (2016) 16:762
Page 9 of 18
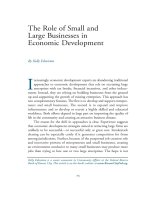
(See figure on previous page.)
Fig. 3 Laser scanning confocal microscope images of fluorescently labelled live MCF-7CC10 and MCF-7DOX2–10 cells (a-d) or identical cell lines fixed and
immunohistochemically-stained with epitope-specific antibodies (e-h). Panels A through D represent cells stained with MDC (blue) and LysoTracker®
(green) with or without doxorubicin treatment. In panels E and F, cells were fixed in formaldehyde and immunohistochemically stained with anti-LC3-II
(green) and anti LAMP1 (red) antibodies. For panels G and H, cells were labelled with MitoTracker™ (red) and followed by formaldehyde fixation and
immunocytochemical staining with an anti-LC3-II antibody (green) after 24 h treatment with 10 μM chloroquine (CQ) prior to labelling. The images in this
figure are representatives of approximately 100 cells examined on two separately stained slides. Each image represents one of 10 microscopic photos taken
from two independent experiments. The staining and phenotype consistency were also confirmed in at least two biological replicates by 3D image/video
(data not shown)
but doxorubicin resided clearly in the nucleus of these
cells (Figs. 3a and c). The partial co-localization of lysosomes with autophagosomes in doxorubicin-resistant
cells was further confirmed by immunohistochemical
approaches. Lysosomes and autophagosomes were visualized in MCF-7DOX2–10 cells by immunofluoresence
with LAMP1 and LC3-II antibodies, respectively. As
shown in Fig. 3f, a strong proportion of the red fluorescence generated by the LAMP antibody co-localized
with the green fluorescence produced by the LC3-II
antibody, producing a yellow hue. There was some red
LAMP1-related fluorescence that did not co-localize
with LC3-II fluorescence. This is understandable, since
all lysosomes would not be expected to be autophagolysosomes. It is important to note that single staining with
each primary antibody with an appropriate secondary
antibody did not produce detectable “bleed-through”
between the red, green, and blue regions of the fluorescent spectrum (data not shown).
Unlike MCF-7DOX2–10 cells, MCF-7CC10 cells showed
very low levels of LC3-II and LAMP1-related immunofluorescence and this fluorescence was equally distributed throughout the cytoplasm (Fig. 3e). Taken together,
our findings suggest that upon acquisition of doxorubicin resistance, autophagy is increased through changes
in cellular LC3-II levels and localization, as exhibited by
the change from a weak, diffuse, punctate pattern to
strong clustered staining in the perinuclear region.
Moreover, our observations are consistent with previously described changes in the localization of LC3-II
upon induction of autophagy.
Partial co-localization of Mitotracker™ Fluorescence with
LC3-II Immunofluoresence
Autophagosomes in perinuclear region of MCF-7DOX2–10
cells not only co-localized with lysosomes, but also partially
co-localized with mitochondria. This co-localization was
revealed by immunohistochemical staining with the LC3-II
antibody after MitoTracker™ labeling. As shown in Fig. 3g,
both mitochondria (red) and autophagosomes (green) are
evenly distributed throughout the cytoplasm in MCF-7CC10
cells, with a small amount of overlapping staining (yellow).
In contrast, MitoTracker™ labeling and LC3-II staining in
MCF-7DOX2–10 cells localized predominantly in the
perinuclear region, with strong co-localization of staining
(Fig. 3h). Such structures staining positively for both LC3-II
antibody and MitoTracker™ are most likely autophagosomes containing mitochondria, suggesting that selection
for doxorubicin resistance resulted in the strong induction
of mitophagy. This was confirmed by subsequent experiments (see below).
Clustering of organelle-containing vacuoles in the perinuclear region upon acquisition of doxorubicin resistance
A characteristic property of autophagy is the formation
of perinuclear vacuoles called autophagosomes that
engulf other organelles [46], which can be visualized by
electron microscopy. To further support our hypothesis
of autophagy induction upon acquisition of doxorubicin
resistance, transmission electron microscopy was used to
visualize organelles with high resolution in MCF-7CC10
and MCF-7DOX2–10 cells. As shown in Fig. 4a and c,
electron microscopy images of MCF-7CC10 cells revealed
that organelles of high electron density (including mitochondria) were well distributed throughout the cytoplasm and were generally not contained within vacuoles
(suggesting a lack of organelle autophagy). In contrast,
MCF-7DOX2–10 cells exhibited numerous cytoplasmic
vacuoles in the perinuclear region, some of which
contained electron dense organelles. These observations
were similar to our findings by confocal microscopy.
The presence of abundant organelle-containing vacuoles
within the perinuclear region of MCF-7DOX2–10 cells
(Fig. 4b and d), supports the hypothesis of autophagosome formation upon acquisition of doxorubicin resistance. Some of the electron dense structures in
MCF-7DOX2–10 cells appear to have cristae reminiscent
of mictochondria, and may be late autophagic vacuoles
(autophagolysosomes).
Autophagy as a mechanism for reducing or eliminating
organelles damaged by reactive oxygen species in MCF7DOX2–10 cells
A well-studied type of autophagy is selective mitophagy,
which mediates cargo-specific removal of damaged mitochondria [47]. Doxorubicin is well known to induce
reactive oxygen species (ROS) [29] which results in
oxidative damage to both nuclear and mitochondrial
Guo et al. BMC Cancer (2016) 16:762
Page 10 of 18
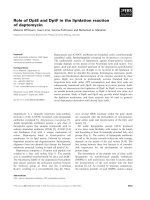
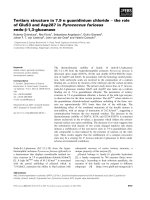
Fig. 4 Electron microscopic images of MCF-7CC10 and MCF-7DOX2–10 cells. Differences in the ultrastructure of MCF-7CC10 cells (panel a) and
MCF-7DOX2–10 cells (panel b) were visualized by transmission electron microscopy, with Figures c and d depicting boxed sections in panels
(a and b) at a higher magnification, respectively. Arrows indicate the presence of mitochondria being engulfed by double membrane structures. Five
representative images were taken, with 1 image of each cell lines being depicted in the figure
DNA [48, 49]. Mitochondria are especially prone to
ROS-mediated damage. Our observations using transmission electron microscopy (Fig. 4) and confocal microscopy studies (Fig. 3g and h) did reveal a large
increase in the number of cytoplasmic vacuoles in
doxorubicin-resistant cells, with a large number of
electron dense organelles (likely mitochondria) in or
near vacuoles. Thus, selective mitophagy may help
doxorubicin-resistant cells rid themselves of damaged
mitochondria formed by the continuous exposure to
doxorubicin, possibly increasing their survival. Autophagy induction can also neutralize or eliminate the effects
of ROS through the Beclin 1-binding protein HMGB1
[50]. To elucidate a possible mechanism for autophagy
induction in doxorubicin resistance, the expression of
key proteins involved autophagy induction was assessed
in MCF-7CC10 and MCF-7DOX2-10 cells in the presence
of bafilomycin. Bafilomycin A1 was added to cells to
prevent degradation of proteins through the drug’s
ability to block the fusion of autophagosomes with lysosomes as well as the dynamic flux of protein hydrolysis
through lysosomes, leading to the accumulation of
autophagosomal structures [42].
Sequestosome 1 (p62) is an ubiquitin-binding adaptor
protein, which binds to parkin-ubiquitinated mitochondrial substrates and mediates both the clustering of
mitochondria and recruitment of ubiquitylated cargo
into autophagosomes by binding to LC3 [51, 52]. In fact,
both ubiquitinated protein aggregates and dysfunctional
mitochondria are recruited to autophagy machinery
through LC3 [52–54]. Consistent with this view,
bafilomycin-treated MCF-7DOX2 cells exhibited higher
levels of p62 than similar-treated MCF-7CC cells (Fig. 5).
Moreover, there appeared to be a trend towards increasing p62 expression as doxorubicin selection dose was increased from dose level 7 to dose level 12. Interestingly,
the increase in p62 expression (dose 7) preceded the acquisition of doxorubicin resistance at selection dose 9.
These findings suggest that selection of breast tumour
cells for survival in the presence of doxorubicin results
in increasing p62 expression, which helps promote clearance of mitochondria damaged by drug-induced ROS.
Guo et al. BMC Cancer (2016) 16:762
Fig. 5 Immunoblots depicting the level of LC3, LAMP1, Beclin 1, Bcl-2,
p62 and Atg7 proteins in MCF-7DOX2 cells at selection doses 7 through
12 (7–12) grown in the presence of bafilomycin A1. Immunoblots also
depict the level of these proteins in MCF-7CC10 cells (cc), grown in the
absence of bafilomycin A1. Bafilomycin (50 nM) was added to block
degradation of the proteins by lysosomal proteases. For control
MCF-7CC10 cells (cc, lane1), a volume of ethanol equal to that of
added bafilomycin A1 was used as a vehicle control. All images are
representative of at least three independent experiments. Molecular
weight standards are depicted in lane M
Up-stream proteins involved in the regulation of
canonical autophagy appear not to be associated with
doxorubicin resistance-related autophagy
The above findings provide several lines of evidence
indicating that selection for doxorubicin resistance
results in the promotion of autophagy. To begin to
explore the mechanisms associated with autophagy
induction, the expression of additional key autophagyrelated proteins was examined in MCF-7CC10 and MCF7DOX2 cells in the presence of bafilomycin. As shown in
immunoblotting experiments depicted in Fig. 5, the
expression of LAMP1 (a lysosomal protein biomarker
indicative of cellular lysosome content) was significantly
Page 11 of 18
elevated in MCF-7DOX2 cells compared to MCF-7CC10
cells, with a trend towards increasing LAMP1 expression
with increasing selection dose. In contrast, similar to the
β-tubulin loading control, cellular Beclin 1 and Atg7
levels remained unchanged upon selection for doxorubicin resistance. Interestingly, Bcl-2 levels at low selection
doses (up to dose 7) were clearly higher than in MCF7 cc cells at equivalent selection doses. However, Bcl-2
expression then decreased dramatically as selection dose
was progressively increased, such that expression was
barely detectable in MCF-7DOX2 cells at selection dose
12 (Fig. 5). Given that Bcl-2 binds to Beclin 1 to inhibit
autophagy [55], this reduction in cellular Bcl-2 levels
provides some insight into possible mechanisms by
which selection for doxorubicin resistance activates
autophagy (see Discussion).
LC3 conjugation to the nascent autophagic vacuolar
membrane is required for the initiation of autophagy
and the late steps of autophagy after the isolation
membrane has formed [44]. This involves conjugation of
LC3-I to phosphatidylethanolamine [56], which, in turn,
causes a change in LC3 localization from the cytoplasm
(LC3-I) to the autophagosomal membrane (LC3-II). As
shown in Fig. 5, cellular levels of LC3-II (a wellestablished biomarker of late autophagy) were very
strongly increased when the doxorubicin selection dose
was equal to or above dose 10. Interestingly, this corresponded very well with the selection doses where strong
levels of doxorubicin resistance were obtained (resistance factors >2-fold; Fig. 1). Moreover, we observed that
LC3-I levels were extremely low at the beginning of
selection but increased slightly as doxorubicin resistance
was achieved. This elevated expression of LC3-II was
not due to blocked flux to lysosomes in MCF-7DOX2–10
cells because LC3-II protein levels in all samples were
assessed in the presence of bafilomycin A1, which blocks
the degradation of LC3-II (Fig. 5).
Atg7 plays an important role in late autophagosome
formation. We thus assessed whether siRNA-mediated
knockdown of ATG7 transcript expression could block
autophagy in MCF-7DOX2–10 cells in the presence of doxorubicin, thereby restoring doxorubicin sensitivity. As
shown in Fig. 6b, a siRNA specific for the ATG7 transcript
(Atg7-1) was able to strongly reduce Atg7 protein expression in both MCF-7CC10 and MCF-7DOX2–10 cells, as measured in immunoblotting experiments with an Atg7
specific antibody. Another siRNA (Atg7-3) was able, to a
lesser extent, to suppress Atg7 expression in MCF-7CC10
cells, but had only a small effect on Atg7 expression in
MCF-7DOX2–10 cells. These siRNAs had no effect on
β-tubulin protein expression, nor did a control scrambled Atg7 siRNA sequence have any effect on Atg7 or
β-tubulin protein expression. Nevertheless, despite the
effects of the Atg7 siRNAs on Atg7 expression, these
Guo et al. BMC Cancer (2016) 16:762
Fig. 6 Effect of ATG7-specific siRNAs (Atg7-1 or Atg7-3) or a scrambled
control siRNA (Scramble) on doxorubicin sensitivity and expression of
Atg7 protein in MCF-7CC10 and MCF-7DOX2–10 cells. Doxorubicin sensitivity
was assessed using clonogenic assays (a), while the efficiency of gene
knockdown was assessed in immunoblotting experiments (b) using
antibodies specific for the Atg7 protein. A γ-tubulin antibody was used
as a loading control
siRNAs had no significant effect on doxorubicin sensitivity in either MCF-7CC10 or MCF-7DOX2–10 cells
(Fig.6a). Taken together, these and the above findings
suggest that changes in Atg7 and Beclin 1 expression
did not appear to be associated with the induction of
drug resistance in MCF-7DOX2–10 cells.
The canonical autophagy pathway is intact in MCF-7DOX2–
10 cells but does not appear to be involved in autophagy
associated with doxorubicin resistance
We have provided evidence of increased autophagy in
MCF-7 cells upon selection for doxorubicin resistance,
including changes in the expression and localization of
LC3-II. Such cells with increased autophagy would be
expected to exhibit higher rates of protein turnover,
since autophagy promotes degradation of damaged or
defective proteins or cellular organelles. We thus examined the rate of protein turnover in MCF-7CC10 and
MCF-7DOX2–10 cells in a standard flux assay used in the
assessment of autophagy. As shown in Fig. 7a, the autophagy activator rapamycin and the autophagy inhibitor
chloroquine stimulated and inhibited protein turnover in
the flux assay, respectively, in both MCF-7CC10 and
MCF-7DOX2–10 cells. While there was no statistically
significant difference in the rates of protein turnover
Page 12 of 18
between the MCF-7CC10 and MCF-7DOX2–10 cells at
24 h. At 48 h, MCF-7DOX2–10 cells exhibited higher
rates of protein turnover than MCF-7CC10 cells (Fig. 7a
and b). However, this difference in the flux rates
between MCF-7DOX2–10 cells and MCF-7CC10 cells was
not observed in the presence of rapamycin or chloroquine.
Taken together, the above findings question whether increased protein turnover through an autophagic process
was responsible for the observed resistance to doxorubicin
in MCF-7DOX2–10 cells, in particular because the rates of
protein turnover were only marginally different between
MCF-7DOX2–10 cells and MCF-7CC10 cells. The above
findings thus suggest that a functional canonical autophagic
pathway is present in both cell lines and that autophagic
protein turnover is higher in MCF-7DOX2–10 than in
MCF-7CC10 cells. However, when we examined the effect of
these agents on cellular LC3-II levels, we observed that
chloroquine significantly increased LC3-II levels in both
MCF-7CC10 and MCF-7DOX2–10 cells (Fig. 7a, lower panel).
This was particularly striking in the latter cell line. In
repeated experiments, rapamycin was found to reproducibly increase LC3-II levels in MCF-7CC10 cells, but the
magnitude of increase was generally small and variable.
These findings suggest that the increased rate of protein
turnover induced by rapamycin in both cell lines may be
through an autophagic mechanism not involving mTORBeclin 1-Atg7 pathway. Although Atg7 is a critical protein
in canonical autophagy, the expression of Atg7 was not
changed during selection for doxorubicin resistance. Atg7
siRNA knockdown did not alter the hydrolysis of long lived
proteins as shown in the flux assay (Fig. 7b, upper panel),
despite the clearly reduced expression of Atg7 protein in
cells transfected with the Atg7 siRNAs (Fig. 7b, lower
panel). Chloroquine did not affect localization of lysosomes
or doxorubicin in MCF-7CC10 cells (Fig. 7c) or MCF7DOX2–10 cells (Fig. 7d).
Given all of our experimental findings to date,
MCF-7DOX2–10 cells appear to exhibit elevated autophagy,
based on the clustering and co-localization of lysosomes
and organelles in the perinuclear region, increased cytoplasmic vacuoles containing mitochondria and other electrondense organelles, elevated MDC staining, increased LC3-II
production, and increased protein turnover (autophagic
flux). Further evidence that autophagy is nevertheless
occurring in MCF-7DOX2–10 cells comes from our observations that chloroquine (which inhibits autophagy by
blocking the fusion of autophagosomes with lysosomes) inhibits protein flux in MCF-7DOX2–10 cells (Fig. 7a) and
blocks the ability of these cells to resist killing by doxorubicin (Fig. 1). This is despite no change in the localization of
doxorubicin in MCF-7DOX2–10 cells in the presence of
chloroquine (Fig. 7c), even when clustering of lysosomes is
observed. Thus, chloroquine does not appear to be increasing doxorubicin cytotoxicity by altering the localization of
Guo et al. BMC Cancer (2016) 16:762
Page 13 of 18
Fig. 7 Effect of rapamycin, chloroquine, an ATG7-specific siRNA or an scrambled control siRNA on long lived protein turnover (flux assay), LC3-II levels, or
lysosome and doxorubicin localization in MCF-7CC10 and MCF-7DOX2–10 cells. The flux assay was conducted to examine the overall hydrolysis of long lived
proteins through autophagy after cells are treated with the autophagy activator rapamycin (Rap), the autophagy inhibitor chloroquine (CQ) (A, upper
panel), or siRNAs specific for the ATG7 gene or a scrambled control (B, upper panel). Immunoblot analysis was used to assess LC3-II protein accumulation in
the cells that were treated with either rapamycin (Rap) or chloroquine (CQ) for 24 h compared to a control solution DMSO (vehicle; veh) (a, lower panel).
The efficiency of Atg7 protein knockdown by siRNA interference (b, lower panel) compared to scramble control (scr) was also assessed in this experiment
using immunoblot analysis with anti-Atg7 antibodies. Confocal microscopy examination (panel c) was also performed to show the effect of chloroquine
on the subcellular distribution of lysosomes (green) and doxorubicin (red) in MCF-7CC10 cells (c, left) and MCF-7DOX2–10 cells (c, right). MCF-7 cc10 cells were
treated with 10 μM of chloroquine and 2 μM of doxorubicin for 8 h, and MCF-7DOX2-10 cells were treated with 10 μM of chloroquine and 2 μM
of doxorubicin for 48 h. The images in panel C represent one of the 10 microscopic photos from two sets of separately stained slides in two
independent experiments. The staining and phenotype were very consistent throughout 100 viewed cells
doxorubicin, but rather through its ability to inhibit
autophagy.
Discussion
While previous studies have suggested a link between autophagy and chemotherapy drug resistance [57–61], a temporal association between the acquisition of chemotherapy
resistance and induction of autophagy has yet to be established. Moreover, it is unclear how this relates to drug
uptake and drug localization in drug-resistant cells. In this
study, we report for the first time that the acquisition of
doxorubicin resistance can be temporally correlated with
both enhanced drug sequestration into clustered perinuclear lysosomes and enhanced autophagy. The induction
Guo et al. BMC Cancer (2016) 16:762
of autophagy upon acquisition of drug resistance is associated with increased and decreased cellular p62 and Bcl-2
levels, respectively. Inhibition of autophagy by chloroquine
promotes doxorubicin-induced cell death in MCF-7DOX2–10
cells, but not in drug-sensitive MCF-7CC10 cells.
It has been well established that LC3 is a reliable
marker of the formation of autophagosomes in mammalian cells [62]. Its localization within cells changes from
a diffuse cytosolic pattern to a punctate pattern representing its recruitment to the autophagosomal membrane during the induction of autophagy [63]. The
findings of our study are consistent with this view, since
MCF-7 cells selected for survival in increasing concentrations of doxorubicin exhibited increased levels of
LC3-II and this increase was temporally associated with
acquisition of doxorubicin resistance. Moreover, the
location of autophagosomes (LC3-II) and lysosomes
(LAMP1) changed upon selection for doxorubicin resistance from a diffuse pattern throughout the cytoplasm to
being clustered in the perinuclear region (Fig. 3). Similar
to our observations in MCF-7DOX2 cells, lysosomal
clustering and increased cellular LC3-II levels took place
during independent selection of MCF-7 cells for
acquired resistance to several other chemotherapy drugs,
including an analog of doxorubicin (epirubicin), and
both the taxanes paclitaxel and docetaxel. These changes
took place at or above selection doses where drug resistance was obtained (data not shown). Taken together,
these observations suggest that increased autophagy
and/or sequestration of drugs in lysosomes are highly
reproducible and common mechanisms through which
tumor cells acquire resistance to cytotoxic chemotherapy
drugs.
Doxorubicin may have at least four possible fates upon
entry into MCF-7DOX2–10 cells. In a prior study, we have
provided evidence that doxorubicin may be metabolized by
cytoplasmic aldo-keto reductases (AKRs) into a considerably less toxic metabolite (13-OH doxorubicinol) in breast
tumor cells [64]. Alternatively, the drug may be sequestrated into lysosomes (either as doxorubicin or its 13-OH
metabolite), due to its properties as a weak base [21, 65].
Thirdly, before reaching the nucleus, doxorubicin may bind
to mitochondrial DNA and induce oxidative damage to
mitochondria (due to the drug’s ability to generate ROS).
This, in turn, may result in the activation of DNA damage
response/survival pathways [66]. Finally, we have previously
provided evidence that at higher selection doses, doxorubicin may simply be actively effluxed from MCF-7DOX2–10
cells through the induced expression of drug transporters
such as Abcc1 [61]. All of these mechanisms may explain
why only a small amount of doxorubicin appears to be
present in the nuclei of MCF-7DOX2–10 cells (Fig. 2).
During selection for doxorubicin resistance, it would be
expected that doxorubicin would bind to mitochondrial
Page 14 of 18
DNA, thereby exposing the organelles to ROS produced
by doxorubicin [66]. This may result in large numbers of
damaged mitochondria, which would be targeted for
degradation by activation of a particular form of autophagy (namely mitophagy). This would be consistent with
observations of many vesicularized mitochondria in
MCF-7DOX2–10 cells (Fig. 4). In addition, activation of
autophagy has been reported to increase cellular capacity
to survive stress associated with exposure to ROS [67].
Since canonical autophagy requires the involvement of all
Atg proteins [68] and since knockdown of Atg7 did not
significantly reduce doxorubicin resistance, this suggests
that acquisition of doxorubicin resistance may be associated with the induction of non-canonical autophagy [9].
The mechanism for autophagy associated with selection
for doxorubicin resistance may involve selective delivery
of damaged organelles into autophagosomes that then
fuse with lysosomes for hydrolytic degradation [69, 70],
even under nutrient-rich conditions. This form of non-canonical autophagy is often referred to as selective
autophagy.
It has been suggested that p62, as a selective cargo receptor, is involved in linking ubiquitinated protein aggregates to the autophagy machinery through LC3 [52, 54].
In addition, p62 mediates the clustering and aggregation
of dysfunctional mitochondria and binds to LC3-II to
deliver aggregated mitochondria to autophagosomes
[53]. Increased p62 expression upon selection for
survival in increasing concentrations of doxorubicin (beginning at selection dose 7) would help facilitate this
delivery of dysfunctional mitochondria to autophagosomes. While Atg7 and Beclin1 levels remained
unchanged, Bcl-2 protein levels varied throughout selection for doxorubicin resistance (Fig. 5). For example,
relative to co-cultured MCF-7CC cells, MCF-7DOX2 cells
selected to dose level 7 (6.5 nM doxorubicin) showed
considerably higher expression of Bcl-2. This increase in
cellular Bcl-2 levels likely enabled MCF-7DOX2 cells to
survive doxorubicin concentrations up to dose level 7,
due to the ability of Bcl-2 to inhibit doxorubicininduced apoptosis [63, 71, 72]. However, at selection
doses above 6.5 nM doxorubicin, Bcl-2 expression began
to decline in a dose-dependent manner (Fig. 5). Since,
Bcl-2 can negatively regulate autophagy by forming
complexes with Beclin 1 [55, 73], the loss of Bcl-2 might
help promote autophagy at higher selection doses by
promoting Beclin 1-dependent autophagy. There was,
however, no change in the expression of Beclin 1 and
Atg7 throughout selection for doxorubicin resistance,
which is often seen in canonical autophagy. This
suggests the activation of non-canonical or selective autophagy. There is some recent evidence that, in addition
to canonical autophagy, Bcl-2 can regulate noncanonical autophagy, since knockdown of Bcl-2 activity
Guo et al. BMC Cancer (2016) 16:762
by the Bcl-2 inhibitor Z18 induces autophagy that is
unaffected by Beclin 1 and phosphatidyl inositol 3kinase inhibition [74]. However, overexpression of Bcl-2
in MCF-7DOX2–10 cells did not result in autophagy inhibition (as determined by LC3-II expression levels), nor
did it increase cellular sensitivity to doxorubicin (data
not shown).
Our data clearly illustrates that MCF-7DOX2–10 cells
demonstrated a higher level of autophagy (as measured
by LC3-II expression and electron microscopy) than
equivalent co-cultured control cells. However, the rate of
long lived protein hydrolysis as measured by the flux
assay (a functional indicator of autophagy) was only
marginally higher in MCF-7DOX2–10 cells than in MCF7CC10 cells (Fig. 7). This may be because the high level
of protein hydrolysis seen in canonical autophagy is used
to either degrade long lived proteins for housekeeping
purposes or energy production under starvation conditions. However, when cells undergo treatment with
chemotherapy drugs, there is no shortage of nutrients
and growth factors. Thus, organelle damage might be
the main effect of drug treatment, and it may be preferable for cells in such instances to activate selective
autophagy to eliminate damaged organelles rather than
activation of canonical autophagy and protein hydrolysis
to support cellular metabolism. After drug entry into
tumor cells, mitochondria may be the first target to be
affected by doxorubicin prior to its binding to nuclear
DNA. Therefore, doxorubicin resistance could be partially attributed to enhanced clearance of the damaged
mitochondria caused by doxorubicin via mitophagy.
Autophagy is a process that receives inputs from multiple
pathways. The well documented canonical pathways
regulating starvation-induced autophagy [75–77] may or
may not be applicable to autophagy induced by other stress
inducers, such as chemotherapy agents. For example, the
neurotoxin MMP+ induces autophagy in SHSY5Y human
neuroblastoma cells through a pathway distinct from
starvation-induced autophagy. Classic inhibitors of amino
acid deprivation-associated autophagy do not inhibit the
autophagic response elicited by MMP+ treatment, despite
confirmation that the pathway is operative in SHSY5Y cells
[10]. Similarly, MCF-7 cells show Beclin 1-hVps34independent autophagy or non-canonical autophagy in response to resveratrol treatment [9, 78].
In a recent study, Sun et al. provided evidence of
increased autophagy upon exposure of MCF-7 cells to
epirubicin and that autophagy facilitates resistance to
epirubicin [59]. Our manuscript supports the general
themes of the prior study, but differs from it in several respects. Firstly, our study demonstrates a clear
dose-dependent and temporal relationship between
doxorubicin selection dose and both the acquisition
of doxorubicin resistance and increased autophagy, in
Page 15 of 18
particular at selection doses at or above 44 nM
doxorubicin. We show much greater LC3-II production (autophagy) than that observed by Sun et al.
when the selection dose reaches 44 nM or greater.
Our study also provides evidence that autophagy induction
upon selection for doxorubicin resistance appears unrelated
to starvation-induced (canonical) autophagy, as siRNAmediated downregulation of Atg7 had no effect on the
sensitivity of MCF-7DOX2–10 cells to doxorubicin and
induction of the cargo protein p62 is typically associated
with non-canonical or selective autophagy.
There is emerging evidence that autophagy may be
highly relevant to chemotherapy drug resistance and
improving the efficacy of chemotherapy treatment in
cancer patients. For example, the combined inhibition of
autophagy by the mTOR inhibitor temsirolimus and by
the lysosomotropic agent chloroquine in a phase I study,
showed the combination to be safe, with clear evidence
of autophagy inhibition. 67 % of patients achieved stable
disease at the maximally tolerated dose (MTD) of this
regimen in patients with solid tumours. Moreover, 74 %
of melanoma patients achieved stable disease at the
MTD of this regimen [79]. The combination of an
mTOR and autophagy inhibitor may be important for
clinical efficacy, as a study in prostate tumour xenograft
models found that the combination of the mTOR inhibitor AZD5363 and chloroquine significantly reduced
tumour volume, while either drug alone did not [80].
Further evidence of the potential link between autophagy and response to chemotherapy stems from a phase
II study on the efficacy of sorafenib in patients with
refractory lymphoma. Patients clinically responsive to
sorafenib had higher baseline levels of an autophagic
biomarker and experienced a significant reduction in
this biomarker during treatment [81]. These previous
investigations and our current study in drug-resistant
breast tumour cells provide a compelling rationale for
investigating the potential of autophagy inhibitors (possibly in combination with mTOR inhibitors) to improve
clinical response to chemotherapy. This is particularly
important for invasive breast cancer (not including
ductal carcinoma in situ), which affects approximately 1
in 8 women in the U.S. ( />symptoms/understand_bc/statistics ). According to the
ClinicalTrials.gov website, two phase II clinical trials are
currently recruiting patients to assess the effect of the
lysosomotropic autophagy inhibitor chloroquine (alone)
in patients with breast cancer or ductal carcinoma in
situ prior to surgery.
Conclusion
This study provides new insight into the multiple mechanisms involved in acquired doxorubicin resistance in
breast tumour cells. In addition to previously the known
Guo et al. BMC Cancer (2016) 16:762
Page 16 of 18
mechanism involving the increased production of the
Abcc1 drug efflux transporter, the cells acquire doxorubicin resistance by sequestering the drug into lysosomes and by activating non-canonical autophagy
through increased production of LC3-II and p62.
3.
Abbreviations
CQ: Chloroquine; LC3: Microtubule-associated protein 1 light chain 3; MCF7 cc: Co-cultured MCF-7 cells; MCF-7DOX2: Doxorubicin resistant MCF-7 cells;
MDC: Monodansylcadaverine; Rap: Rapamycin; Scr: Scramble siRNA
6.
7.
Acknowledgements
This work was supported by core support to A.M.P from the Northern Cancer
Foundation, Sudbury, Ontario, Canada.
9.
Funding
This study was supported by the Northern Cancer Foundation, Sudbury,
Ontario, Canada.
Availability of data and materials
The experiments described in this study did not require access to or
assembly of large datasets or spreadsheets. Study findings did not stem from
analyses of genomic, proteomic, crystallographic, or clinical datasets.
Experimental data are depicted graphically or through representative
microscopic images. There is thus no need to provide links to study data.
The cell lines described in this study are available to investigators upon
request.
Authors’ contributions
BG participated in writing of the manuscript and performed most of the
experiments including microscopic imaging, immunoblots and flux assays.
AT performed clonogenic assays statistical analysis. SS conducted some of
the immunoblot experiments. AP devised and supervised the performance
of the study, acquired grant funding to support the study, and helped write
and revise the manuscript. He is also the corresponding author for this
manuscript. All authors have read and approved the manuscript.
Competing interests
The authors declare that they have no competing interests with respect to
the content of this manuscript.
Consent for publication
All authors have read and have consented to the publication of this study.
This study does not include any data from humans for whom consent to
publish would need to be obtained.
Ethics approval and consent to participate
The findings described in this manuscript did not stem from
experimentation involving human or animal subjects. Therefore, approval by
animal care or human ethics committees or informed consent forms were
not required to complete this study. Procedures were approved by the
Biohazards Safety Committee of Health Sciences North and complied with
committee standards.
Author details
1
Health Sciences North Research Institute, Sudbury, ON P3E 5J1, Canada.
2
Department of Biology, Laurentian University, Sudbury, ON P3E 2C6, Canada.
3
Division of Medical Sciences, Northern Ontario School of Medicine, Sudbury,
ON P3E 2C6, Canada. 4Faculty of Medicine, Division of Oncology, University
of Ottawa, Ottawa, ON K1H 8M5, Canada.
4.
5.
8.
10.
11.
12.
13.
14.
15.
16.
17.
18.
19.
20.
21.
22.
23.
24.
25.
26.
27.
Received: 9 April 2016 Accepted: 15 September 2016
28.
References
1. Rodriguez-Enriquez S, He L, Lemasters JJ. Role of mitochondrial permeability
transition pores in mitochondrial autophagy. Int J Biochem Cell Biol.
2004;36:2463–72.
2. Yorimitsu T, Klionsky DJ. Endoplasmic reticulum stress: a new pathway to
induce autophagy. Autophagy. 2007;3:160–2.
29.
30.
Sakai Y, Oku M, van dK I, Kiel JA. Pexophagy: autophagic degradation of
peroxisomes. Biochim Biophys Acta. 2006;1763:1767–75.
Kuma A, Mizushima N. Physiological role of autophagy as an intracellular
recycling system: with an emphasis on nutrient metabolism. Semin Cell Dev
Biol. 2010;21:683–90.
Levine B, Klionsky DJ. Development by self-digestion: molecular
mechanisms and biological functions of autophagy. Dev Cell. 2004;6:463–77.
Kondo Y, Kondo S. Autophagy and cancer therapy. Autophagy. 2006;2:85–90.
Maiuri MC, Zalckvar E, Kimchi A, Kroemer G. Self-eating and self-killing: crosstalk
between autophagy and apoptosis. Nat Rev Mol Cell Biol. 2007;8:741–52.
Kondo Y, Kanzawa T, Sawaya R, Kondo S. The role of autophagy in cancer
development and response to therapy. Nat Rev Cancer. 2005;5:726–34.
Scarlatti F, Maffei R, Beau I, Codogno P, Ghidoni R. Role of non-canonical
Beclin 1-independent autophagy in cell death induced by resveratrol in
human breast cancer cells. Cell Death Differ. 2008;15:1318–29.
Zhu JH, Horbinski C, Guo F, Watkins S, Uchiyama Y, Chu CT. Regulation of
autophagy by extracellular signal-regulated protein kinases during 1-methyl4-phenylpyridinium-induced cell death. Am J Pathol. 2007;170:75–86.
Mishima Y, Terui Y, Mishima Y, Taniyama A, Kuniyoshi R, Takizawa T, et al.
Autophagy and autophagic cell death are next targets for elimination of
the resistance to tyrosine kinase inhibitors. Cancer Sci. 2008;99:2200–8.
Kang R, Zeh HJ, Lotze MT, Tang D. The Beclin 1 network regulates
autophagy and apoptosis. Cell Death Differ. 2011;18:571–80.
White E. Autophagy and p53. Cold Spring Harb Perspect Med. 2016;6(4):
a026120.
Shintani T, Klionsky DJ. Autophagy in health and disease: a double-edged
sword. Science. 2004;306:990–5.
Sui X, Chen R, Wang Z, Huang Z, Kong N, Zhang M, et al. Autophagy and
chemotherapy resistance: a promising therapeutic target for cancer
treatment. Cell Death Dis. 2013;4:e838.
Green DR, Llambi F. Cell Death Signaling. Cold Spring Harb Perspect Biol.
2015;7(12).
Huang Z, Zhou L, Chen Z, Nice EC, Huang C. Stress management by
autophagy: Implications for chemoresistance. Int J Cancer. 2016;139:23–32.
Ravikumar B, Berger Z, Vacher C, O’Kane CJ, Rubinsztein DC. Rapamycin pretreatment protects against apoptosis. Hum Mol Genet. 2006;15:1209–16.
Katayama M, Kawaguchi T, Berger MS, Pieper RO. DNA damaging agentinduced autophagy produces a cytoprotective adenosine triphosphate
surge in malignant glioma cells. Cell Death Differ. 2007;14:548–58.
Lum JJ, Bauer DE, Kong M, Harris MH, Li C, Lindsten T, et al. Growth factor
regulation of autophagy and cell survival in the absence of apoptosis. Cell.
2005;120:237–48.
Hindenburg AA, Gervasoni Jr JE, Krishna S, Stewart VJ, Rosado M, Lutzky J, et al.
Intracellular distribution and pharmacokinetics of daunorubicin in
anthracycline-sensitive and -resistant HL-60 cells. Cancer Res. 1989;49:4607–14.
Coley HM, Amos WB, Twentyman PR, Workman P. Examination by laser
scanning confocal fluorescence imaging microscopy of the subcellular
localisation of anthracyclines in parent and multidrug resistant cell lines. Br J
Cancer. 1993;67:1316–23.
Rutherford AV, Willingham MC. Ultrastructural localization of daunomycin in
multidrug-resistant cultured cells with modulation of the multidrug
transporter. J Histochem Cytochem. 1993;41:1573–7.
Janicke RU, Sprengart ML, Wati MR, Porter AG. Caspase-3 is required for
DNA fragmentation and morphological changes associated with apoptosis.
J Biol Chem. 1998;273:9357–60.
Kuma A, Hatano M, Matsui M, Yamamoto A, Nakaya H, Yoshimori T, et al.
The role of autophagy during the early neonatal starvation period. Nature.
2004;432:1032–6.
Erdal H, Berndtsson M, Castro J, Brunk U, Shoshan MC, Linder S. Induction of
lysosomal membrane permeabilization by compounds that activate p53independent apoptosis. Proc Natl Acad Sci U S A. 2005;102:192–7.
Fehrenbacher N, Jaattela M. Lysosomes as targets for cancer therapy.
Cancer Res. 2005;65:2993–5.
Agostinelli E, Seiler N. Lysosomotropic compounds and spermine enzymatic
oxidation products in cancer therapy (review). Int J Oncol. 2007;31:473–84.
Kaufmann AM, Krise JP. Lysosomal sequestration of amine-containing drugs:
analysis and therapeutic implications. J Pharm Sci. 2007;96:729–46.
Ouar Z, Bens M, Vignes C, Paulais M, Pringel C, Fleury J, et al. Inhibitors of
vacuolar H + −ATPase impair the preferential accumulation of daunomycin
in lysosomes and reverse the resistance to anthracyclines in drug-resistant
renal epithelial cells. Biochem J. 2003;370:185–93.
Guo et al. BMC Cancer (2016) 16:762
31. Boya P, Kroemer G. Lysosomal membrane permeabilization in cell death.
Oncogene. 2008;27:6434–51.
32. Groth-Pedersen L, Ostenfeld MS, Hoyer-Hansen M, Nylandsted J, Jaattela M.
Vincristine induces dramatic lysosomal changes and sensitizes cancer cells
to lysosome-destabilizing siramesine. Cancer Res. 2007;67:2217–25.
33. Ostenfeld MS, Hoyer-Hansen M, Bastholm L, Fehrenbacher N, Olsen OD,
Groth-Pedersen L, et al. Anti-cancer agent siramesine is a lysosomotropic
detergent that induces cytoprotective autophagosome accumulation.
Autophagy. 2008;4:487–99.
34. Choi DS, Blanco E, Kim YS, Rodriguez AA, Zhao H, Huang TH, et al.
Chloroquine eliminates cancer stem cells through deregulation of Jak2 and
DNMT1. Stem Cells. 2014;32:2309–23.
35. Hembruff SL, Laberge ML, Villeneuve DJ, Guo B, Veitch Z, Cecchetto M, et al.
Role of Drug Transporters and Drug Accumulation in the Temporal
Acquisition of Drug Resistance. BMC Cancer. 2008;8:318.
36. Guo B, Hembruff SL, Villeneuve DJ, Kirwan AF, Parissenti AM. Potent killing
of paclitaxel- and doxorubicin-resistant breast cancer cells by calphostin C
accompanied by cytoplasmic vacuolization. Breast Cancer Res Treat.
2003;82:125–41.
37. Nakagawa I, Amano A, Mizushima N, Yamamoto A, Yamaguchi H, Kamimoto
T, et al. Autophagy defends cells against invading group A Streptococcus.
Science. 2004;306:1037–40.
38. Holt SV, Wyspianska B, Randall KJ, James D, Foster JR, Wilkinson RW. The
development of an immunohistochemical method to detect the
autophagy-associated protein LC3-II in human tumor xenografts. Toxicol
Pathol. 2011;39:516–23.
39. Ferree A, Guillily M, Li H, Smith K, Takashima A, Squillace R, et al. Regulation
of physiologic actions of LRRK2: focus on autophagy. Neurodegener Dis.
2012;10:238–41.
40. Harhaji-Trajkovic L, Vilimanovich U, Kravic-Stevovic T, Bumbasirevic V,
Trajkovic V. AMPK-mediated autophagy inhibits apoptosis in cisplatintreated tumour cells. J Cell Mol Med. 2009;13:3644–54.
41. Xu L, Liu JH, Zhang J, Zhang N, Wang ZH. Blockade of autophagy aggravates
endoplasmic reticulum stress and improves Paclitaxel cytotoxicity in human
cervical cancer cells. Cancer Res Treat. 2015;47:313–21.
42. Yamamoto A, Tagawa Y, Yoshimori T, Moriyama Y, Masaki R, Tashiro Y.
Bafilomycin A1 prevents maturation of autophagic vacuoles by inhibiting
fusion between autophagosomes and lysosomes in rat hepatoma cell line,
H-4-II-E cells. Cell Struct Funct. 1998;23:33–42.
43. Yoshimori T, Yamamoto A, Moriyama Y, Futai M, Tashiro Y. Bafilomycin A1,
a specific inhibitor of vacuolar-type H(+)-ATPase, inhibits acidification and
protein degradation in lysosomes of cultured cells. J Biol Chem. 1991;266:
17707–12.
44. Paglin S, Hollister T, Delohery T, Hackett N, McMahill M, Sphicas E, et al. A
novel response of cancer cells to radiation involves autophagy and
formation of acidic vesicles. Cancer Res. 2001;61:439–44.
45. Biederbick A, Kern HF, Elsasser HP. Monodansylcadaverine (MDC) is a
specific in vivo marker for autophagic vacuoles. Eur J Cell Biol. 1995;66:3–14.
46. Korolchuk VI, Saiki S, Lichtenberg M, Siddiqi FH, Roberts EA, Imarisio S, et al.
Lysosomal positioning coordinates cellular nutrient responses. Nat Cell Biol.
2011;13:453–60.
47. Twig G, Elorza A, Molina AJ, Mohamed H, Wikstrom JD, Walzer G, et al.
Fission and selective fusion govern mitochondrial segregation and
elimination by autophagy. EMBO J. 2008;27:433–46.
48. Ichikawa Y, Ghanefar M, Bayeva M, Wu R, Khechaduri A, Prasad SV, et al.
Cardiotoxicity of doxorubicin is mediated through mitochondrial iron
accumulation. J Clin Invest. 2014;124(2):617–30.
49. Sharples RA, Cullinane C, Phillips DR. Adriamycin-induced inhibition of
mitochondrial-encoded polypeptides as a model system for the
identification of hotspots for DNA-damaging agents. Anticancer Drug Des.
2000;15:183–90.
50. Tang D, Kang R, Zeh III HJ, Lotze MT. High-mobility group box 1, oxidative
stress, and disease7. Antioxid Redox Signal. 2011;14:1315–35.
51. Youle RJ, Narendra DP. Mechanisms of mitophagy. Nat Rev Mol Cell Biol.
2011;12:9–14.
52. Pankiv S, Clausen TH, Lamark T, Brech A, Bruun JA, Outzen H, et al. p62/
SQSTM1 binds directly to Atg8/LC3 to facilitate degradation of ubiquitinated
protein aggregates by autophagy. J Biol Chem. 2007;282:24131–45.
53. Narendra D, Kane LA, Hauser DN, Fearnley IM, Youle RJ. p62/SQSTM1 is
required for Parkin-induced mitochondrial clustering but not mitophagy;
VDAC1 is dispensable for both. Autophagy. 2010;6:1090–106.
Page 17 of 18
54. Bjorkoy G, Lamark T, Brech A, Outzen H, Perander M, Overvatn A, et al. p62/
SQSTM1 forms protein aggregates degraded by autophagy and has a
protective effect on huntingtin-induced cell death. J Cell Biol. 2005;171:603–14.
55. Marquez RT, Xu L. Bcl-2:Beclin 1 complex: multiple, mechanisms regulating
autophagy/apoptosis toggle switch. Am J Cancer Res. 2012;2:214–21.
56. Sou YS, Tanida I, Komatsu M, Ueno T, Kominami E. Phosphatidylserine in
addition to phosphatidylethanolamine is an in vitro target of the
mammalian Atg8 modifiers, LC3, GABARAP, and GATE-16. J Biol Chem.
2006;281:3017–24.
57. Yoon JH, Ahn SG, Lee BH, Jung SH, Oh SH. Role of autophagy in
chemoresistance: regulation of the ATM-mediated DNA-damage signaling
pathway through activation of DNA-PKcs and PARP-1. Biochem Pharmacol.
2012;83:747–57.
58. Ajabnoor GM, Crook T, Coley HM. Paclitaxel resistance is associated with
switch from apoptotic to autophagic cell death in MCF-7 breast cancer
cells. Cell Death Dis. 2012;3:e260.
59. Sun WL, Chen J, Wang YP, Zheng H. Autophagy protects breast cancer cells
from epirubicin-induced apoptosis and facilitates epirubicin-resistance
development. Autophagy. 2011;7:1035–44.
60. Vazquez-Martin A, Oliveras-Ferraros C, Menendez JA. Autophagy facilitates
the development of breast cancer resistance to the anti-HER2 monoclonal
antibody trastuzumab. PLoS One. 2009;4:e6251.
61. Cufi S, Vazquez-Martin A, Oliveras-Ferraros C, Corominas-Faja B,
Urruticoechea A, Martin-Castillo B, et al. Autophagy-related gene 12 (ATG12)
is a novel determinant of primary resistance to HER2-targeted therapies:
utility of transcriptome analysis of the autophagy interactome to guide
breast cancer treatment. Oncotarget. 2012;3:1600–14.
62. Kabeya Y, Mizushima N, Ueno T, Yamamoto A, Kirisako T, Noda T, et al. LC3,
a mammalian homologue of yeast Apg8p, is localized in autophagosome
membranes after processing. EMBO J. 2000;19:5720–8.
63. Ugarenko M, Nudelman A, Rephaeli A, Kimura K, Phillips DR, Cutts SM.
ABT-737 overcomes Bcl-2 mediated resistance to doxorubicin-DNA adducts.
Biochem Pharmacol. 2010;79:339–49.
64. Veitch ZW, Guo B, Hembruff SL, Bewick AJ, Heibein AD, Eng J, et al. Induction of
1C aldoketoreductases and other drug dose-dependent genes upon acquisition
of anthracycline resistance. Pharmacogenet Genomics. 2009;19:477–88.
65. Hurwitz SJ, Terashima M, Mizunuma N, Slapak CA. Vesicular anthracycline
accumulation in doxorubicin-selected U-937 cells: participation of
lysosomes. Blood. 1997;89:3745–54.
66. Sanchez-Prieto R, Rojas JM, Taya Y, Gutkind JS. A role for the p38
mitogen-acitvated protein kinase pathway in the transcriptional activation
of p53 on genotoxic stress by chemotherapeutic agents. Cancer Res.
2000;60:2464–72.
67. Scherz-Shouval R, Elazar Z. Regulation of autophagy by ROS: physiology and
pathology. Trends Biochem Sci. 2011;36:30–8.
68. Codogno P, Mehrpour M, Proikas-Cezanne T. Canonical and non-canonical
autophagy: variations on a common theme of self-eating? Nat Rev Mol Cell
Biol. 2012;13:7–12.
69. Kim I, Rodriguez-Enriquez S, Lemasters JJ. Selective degradation of
mitochondria by mitophagy. Arch Biochem Biophys. 2007;462:245–53.
70. Tolkovsky AM. Mitophagy. Biochim Biophys Acta. 2009;1793:1508–15.
71. Lock RB, Stribinskiene L. Dual modes of death induced by etoposide in
human epithelial tumor cells allow Bcl-2 to inhibit apoptosis without
affecting clonogenic survival. Cancer Res. 1996;56:4006–12.
72. Kamesaki S, Kamesaki H, Jorgensen TJ, Tanizawa A, Pommier Y.
Cossman J: bcl-2 protein inhibits etoposide-induced apoptosis through
its effects on events subsequent to topoisomerase II-induced DNA
strand breaks and their repair. Cancer Res. 1993;53:4251–6.
73. Oberstein A, Jeffrey PD, Shi Y. Crystal structure of the Bcl-XL-Beclin 1
peptide complex: Beclin 1 is a novel BH3-only protein. J Biol Chem. 2007;
282:13123–32.
74. Tian S, Lin J, Jun ZJ, Wang X, Li Y, Ren X, et al. Beclin 1-independent
autophagy induced by a Bcl-XL/Bcl-2 targeting compound, Z18. Autophagy.
2010;6:1032–41.
75. Petiot A, Ogier-Denis E, Blommaart EF, Meijer AJ, Codogno P. Distinct
classes of phosphatidylinositol 3′-kinases are involved in signaling
pathways that control macroautophagy in HT-29 cells. J Biol Chem.
2000;275:992–8.
76. Pattingre S, Tassa A, Qu X, Garuti R, Liang XH, Mizushima N, et al. Bcl-2
antiapoptotic proteins inhibit Beclin 1-dependent autophagy. Cell.
2005;122:927–39.
Guo et al. BMC Cancer (2016) 16:762
Page 18 of 18
77. Nishida Y, Arakawa S, Fujitani K, Yamaguchi H, Mizuta T, Kanaseki T, et al.
Discovery of Atg5/Atg7-independent alternative macroautophagy. Nature.
2009;461:654–8.
78. Scarlatti F, Maffei R, Beau I, Ghidoni R, Codogno P. Non-canonical
autophagy: an exception or an underestimated form of autophagy?
Autophagy. 2008;4:1083–5.
79. Rangwala R, Chang YC, Hu J, Algazy KM, Evans TL, Fecher LA, et al.
Combined MTOR and autophagy inhibition: phase I trial of
hydroxychloroquine and temsirolimus in patients with advanced solid
tumors and melanoma. Autophagy. 2014;10:1391–402.
80. Lamoureux F, Zoubeidi A. Dual inhibition of autophagy and the AKT
pathway in prostate cancer. Autophagy. 2013;9:1119–20.
81. Guidetti A, Carlo-Stella C, Locatelli SL, Malorni W, Pierdominici M, Barbati C,
et al. Phase II study of sorafenib in patients with relapsed or refractory
lymphoma. Br J Haematol. 2012;158:108–19.
Submit your next manuscript to BioMed Central
and we will help you at every step:
• We accept pre-submission inquiries
• Our selector tool helps you to find the most relevant journal
• We provide round the clock customer support
• Convenient online submission
• Thorough peer review
• Inclusion in PubMed and all major indexing services
• Maximum visibility for your research
Submit your manuscript at
www.biomedcentral.com/submit