Prognostic factors for future mental, physical and urogenital health and work ability in women, 45–55 years: A six-year prospective longitudinal cohort study
Bạn đang xem bản rút gọn của tài liệu. Xem và tải ngay bản đầy đủ của tài liệu tại đây (620.13 KB, 10 trang )
Rindner et al. BMC Women's Health
(2020) 20:171
/>
RESEARCH ARTICLE
Open Access
Prognostic factors for future mental,
physical and urogenital health and work
ability in women, 45–55 years: a six-year
prospective longitudinal cohort study
Lena Rindner1,2,3* , Lena Nordeman2,4, Gunilla Strömme1,2, Irene Svenningsson3,5, Åsa Premberg6,7,
Dominique Hange2,3,8, Ronny Gunnarsson2,3 and Gun Rembeck2,3,9
Abstract
Background: Impaired health due to stress is a common cause of long-term illness in women aged 45–55 years. It
is a common cause for visits to primary health care (PHC) and may influence work-ability. The aim of this study was
to investigate prognostic factors for future mental, physical and urogenital health as well as work-ability in a
population of average women aged 45–55 years.
Methods: This longitudinal cohort study initially assessed 142 women from PHC centers in southwestern Sweden.
One houndred and ten accepted participation and were followed for 6 years. They were assessed using the selfreported questionnaires: the Menopause Rating Scale (MRS), the Montgomery-Asberg Depression Rating Scale
(MADRS-S), the Short-Form Health Survey (SF-36). Descriptive data are presented of health, education, relationships
and if they are working. Multicollinearity testing and logistic regression were used to test the explanatory variables.
Result: Severity of symptoms in the MRS somatic and urogenital domains decreased while they increased in the
psychological and depressive domains. Having tertiary education was associated with decreased overall mental
health, vitality and social role functioning. Living with a partner was associated with increased physical role
functioning, social role functioning and emotional role functioning.
Conclusion: Quality of life seems to be enhanced by a good relationship with the partner, social support and
work/life balance. Therefore, to improve women health women should early discuss ways in which these issues can
be incorporated as they pursue their academic or career goals. Hence, we emphasize the importance of supporting
women to gain increased awareness about a healthy life balance and to have realistic goals in work as well as in
their social life.
Keywords: Menopause, women’s health, Workability, Sick leave, Social support, Primary health care, Mental health,
Physical and urogential health
* Correspondence:
1
Närhälsan, Södra Torget Health Care Center, Kvarngatan 4, SE-503 36 Borås,
Sweden
2
Region Västra Götaland, Research and Development Primary Health Care,
Research and Development Center Södra Älvsborg, Borås, Sweden
Full list of author information is available at the end of the article
© The Author(s). 2020 Open Access This article is licensed under a Creative Commons Attribution 4.0 International License,
which permits use, sharing, adaptation, distribution and reproduction in any medium or format, as long as you give
appropriate credit to the original author(s) and the source, provide a link to the Creative Commons licence, and indicate if
changes were made. The images or other third party material in this article are included in the article's Creative Commons
licence, unless indicated otherwise in a credit line to the material. If material is not included in the article's Creative Commons
licence and your intended use is not permitted by statutory regulation or exceeds the permitted use, you will need to obtain
permission directly from the copyright holder. To view a copy of this licence, visit />The Creative Commons Public Domain Dedication waiver ( applies to the
data made available in this article, unless otherwise stated in a credit line to the data.
Rindner et al. BMC Women's Health
(2020) 20:171
Background
Impaired health due to various forms of mental stress is
a common cause of long-term illness in women in the
age 45–55 years and a common cause of visits to
primary health care (PHC) [1, 2]. Women suffer from
long-term sickness and poor health to a greater degree
than men [3]. Furthermore, women’s physical and mental health in Sweden shows a marked decrease around
the ages 45–55 years [3]. During this phase in life, which
often coincides with menopause, women undergo a hormonal conversion with reduced levels of oestrogen as
well as bio-psyho-social changes [4–6].
The peri-menopausal period means the time around
the menopause and also include the final menstrual
period (FMP) [5]. The average age of FMP differs between women globally but women commonly reaches
FMP in the ages 45–55 ([5, 6]. This period is often
linked with symptoms from the vasomotor system, cardiovascular system, the skeleton, joints, muscles and
urogenital tract [5–7]. Mental illness, particularly depressive symptoms, also show a marked increase during
the ages 45–55 [8]. This phase in womens’ life has been
labelled “the window of vulnerability” [9].
Health
The World Health Organization (WHO) define health as
“a state of complete physical, mental, and social wellbeing and not merely the absence of disease or infirmity”. Furthermore they define mental health as:” a state
of well-being in which the individual realizes his or her
own abilities, can cope with the normal stresses of life,
can work productively and fruitfully, and is able to make
a contribution to his or her community” [10].
Women’s health: sick leave, prevalence and severity of
symptoms
Adaptation disorders and stress reactions increase in
Sweden as well as in other Organisation for Economic
Co-operation and Development (OECD) countries and
around one-third of working population suffers from
poor mental health [1, 11]. The number of women on
sick leave increased in Sweden from 58,000 to 99,000 between 2010 and 2015 which correspond to an increase
of 71% psychiatric diagnoses increased the most and
accounted for 59% of the increase in Sweden [1]. Stress,
somatic symptoms, poor mental health and unhealthy
relationships has become a very common cause for sick
leave among women “in the prime of life” [3, 7, 12].
Good health and social support appear to be important
prognostic factors for coping ability and having a future
high quality of life [13, 14].
An important coping mechanism is that a women can
identity their resources and use these to meet requirements and handle stress. It also include awareness of
Page 2 of 10
psychosocial resources in the woman’s surroundings.
Differences in the ability to manage resources and social
support may explain why some women exposed to stress
don’t experience poor mental health [15].
The most prevalent and severe symptoms in women
aged 45–55 years are muscle pain, sleep disorders, physical and mental fatigue, depression, sexual problems and
characteristic hot flashes [7, 12]. Prognostic factors such
as age, menopausal status, chronic diseases and sociodemographic characteristics, social support, income and
educational level are associated with the frequency and
severity of these symptoms [7, 12].
It should be noted that increased symptoms in this age
group may not necessarily be correlated to a change in
oestrogen levels [16]. Many of these issues involve the
normal changes in this phase of life, but cause much
concern and increased illness for some women [16].
Hence, mental health, social relations as well as income,
working conditions and critical life events all seem to be
related to each other [2, 10, 12, 14].
Work ability
Participation in work are an important part of life and
are essential for health and wellbeing. Physical, mental
and urogenital symptoms in the age range 45–55 years
are negatively associated with work ability [17]. Inability
to work are more common (OR 8.4, 95% CI 4.1–17) in
women suffering from mental, somatic and urogenital
complaints compared to women not experiencing such
discomfort [17].
High work-related stress combined with a large unpaid
work load in the household increases the risk for both
long term and short term sick leave [2, 18]. The association between partner relationships and sick leave have
impact on the health and the ability to return to work
[14]. A supportive partner relation may act as a buffer
and counteract the effect of negative work-related stress
[14]. Hence, important resources to increase return to
work for women on long-term sick-leave can often be
found in circumstances outside work, such as supportive
relationships. Social support from co-workers, a healthy
working relationships and good leadership styles of managers are of course also important facilitators for return
to work [15].
The remaining dilemma
The increasing number of long-term sick leave, ill
health, increased risk for various diseases and increased
number of visits to PHC among women in the age 45–
55 years indicate the importance of specifically studying
why the health of these women is deteriorating.
Conventional risk factors such as diabetes, hypertension, coronary artery disease or cardiac arrhythmia is, as
for men and women in any age, also correlated with
Rindner et al. BMC Women's Health
(2020) 20:171
mortality in middle-aged women [19]. Serious physical
and mental stress perceived to be related to work, family
and homework indicated an increased risk of prolonged
sick-leave in the working population [15, 20].
Risk factors for future poor health in women have in
previous studies focused primarily on a wider age range
than 45–55 years [15] and in both men and women
combined [2]. Moreover, with a short follow up time
[20], focused on a special work places [15], conducted in
low-income countries [19] or did not focus on patients
attending PHC [15, 19, 20]. Furthermore, most previous
studies focused on women with various specific chronic
diseases or with specific risk factors and have often
included lifestyle interventions with or without drug
administrations and they did not take place in PHC [19].
To our knowledge, no previous study focused on a longterm follow-up of a population of a population of
average women 45–55 year.
This study aims to investigate prognostic factors for
long-term future mental, physical and urogenital health
as well as work ability in a population of average women
aged 45–55 year.
Methods
Study design and selection of patients
This study was a 6-year longitudinal cohort study to
evaluate prognostic factors for future work-ability and
health of middle-aged women attending PHC. One hundred and forty-two patients were previously invited to a
cross-sectional study [21] with a following randomized
controlled clinical trial [22]. Six years later they were
asked to participate in a second assessment.
The study was approved by the Regional Ethical
Review Board in Gothenburg Sweden (registration number 041–09; T503–14). Written informed consent was
obtained from all participants and confidentiality was
ensured.
The women were recruited from March 2009 until December 2010. Women that, for any reason, visited the
PHC centers in two municipalities in southwestern
Sweden were consecutively asked to participate in the
study. All participants were given a description of the
study and informed about the right to decline participation or to withdraw from participation. All women
accepting participation and meeting the inclusion criteria were invited to enroll in the study. The inclusion
criteria were: female gender, 45 to 55 years of age and
fluently understanding Swedish. The exclusions criteria
were: unwillingness to continue participation in the
study and new onset of severe mental illness.
To broaden the information of these women’s health
situation, the present study added questionnaires at the
six-year follow-up including more variables, such as the
occurrence of the number of sick leave days in the last
Page 3 of 10
90 days, work-ability, quality of life, current medication
for high blood pressure and cardiovascular health. The
questionnaires were mailed home with a pre-paid return
envelope. A reminder envelope was sent if no questionnaires were returned within 3 weeks.
Data collection
Demographic data including age, educational level, family situation, working status/capacity, menopause status,
health status, current medication for high blood pressure
and cardiovascular health was obtained. Health status included perceived mental, physical and urogenital health
obtained from self-administrated questionnaires; The
Menopause Rating Scale (MRS), The MontgomeryAsberg Depression Rating Scale (MADRS-S) and The
Short-Form Health Survey (SF-36). The questionnaires
MRS and MADRS-S were used in the first and second
assessment while SF-36 was used only in the second
assessment.
Working status/capacity and sick leave
The work status asked for was currently working/studying, sick leave full-time, sick leave part-time, disability
pension (full-time), disability pension (part-time), unemployed full-time or unemployed part-time. Sick leave
was measured with self-assessed work ability and number of days on sick leave during the preceding 90 days.
Menopausal status
Menopausal status was asked for and defined according
to the criteria of the Stages of Reproductive Aging
Workshop as: premenopausal (women having regular
menses), perimenopausal (irregularities > 7 days from
their normal cycle) and postmenopausal (no menses in
the last 12 months) [7].
Cardiovascular history
Presence of known high blood pressure was asked for by
presenting the following alternatives: never had high
blood pressure, or had high blood pressure only during
previous pregnancy, or think they previously have had
hypertension unrelated to pregnancy, or currently have
high blood pressure but does not take any medication
for this, or have high blood pressure and is currently
taking medication for this. Any previous history of myocardial infarction or cerebrovascular illness was also
asked for.
Menopause rating scale (MRS)
For evaluation of the prevalence and severity of menopausal symptoms the MRS, as developed by Heinemann
and validated in Sweden, was used [23]. The MRS is a
self-administrated questionnaire consisting of 11 items,
divided into three subscales reflecting; somatic
Rindner et al. BMC Women's Health
(2020) 20:171
Page 4 of 10
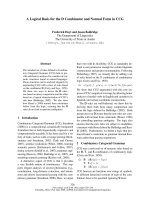
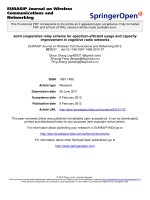
Initial assessment for eligibility (n = 142)
Not included (n = 32)
Not meeting inclusion criteria (n = 0)
Declined participation (n = 32)
Assessed at baseline (n=110)
Lost to follow-up (n = 39)
Stated had no time n=5
Migrated and could not be reached n=11
Died n=1
Did not state reason n=22
Assessed at the six-year follow-up (n=71)
Fig. 1 Participant flowchart
symptoms - hot flushes, chest discomfort (such as irregular heart rhythm or feeling extra heart beats), sleeping problems and muscle and joint problems; mental
symptoms - depressive mood, irritability, anxiety and
physical and mental exhaustion; and urogenital symptoms - sexual problems, bladder problems and vaginal
dryness. Each item ranged from 0 (not present) to 4 (1 =
mild; 2 = moderate; 3 = severe; 4 = very severe). The MRS
total score is the sum of the scores obtained for each
subscale. Values equal or above 9 (somatic), 7 (mental),
4 (urogenital), and 17 (total) were used to define severe
menopausal symptoms [23]. The MRS total score and
somatic, urogenital and mental subscale score were calculated separately.
Montgomery-Asberg depression rating scale (MADRS-S)
For the assessment of depression the MADRS-S was
used [24]. It consists of nine questions, each scored from
0 to 6, where higher score indicates more severe symptoms; 1) Apparent Sadness 2) Inner Tension 3) Reduced
Sleep 4) Reduced Appetite 5) Concentration Difficulties
6) Lassitude 7) Inability to Feel 8) Pessimistic Thoughts
and 9) Suicidal Thoughts. The total MADRS-S score,
calculated according to the manual [24], was interpreted
as follows; 0–6 no depression, 7–19 mild depression,
20–34 moderate depression, > 34 severe depression [24].
The short-form health survey (SF-36)
To examine the overall health, physical and mental, the
short-form health survey (SF-36) was used [25]. The
questionnaire consists of 36 items, divided into eight
subscales: Physical Functioning (PF), Role-Physical (RF),
Bodily Pain (BP), Mental Health (MH), Role-Emotional
(RE), Vitality (VT), General Health (GH) and Social
Functioning (SF). Scores on the subscales are between 0
and 100, higher value indicates better perceived health.
Physical Component Summary (PCS) and Mental
Component Summary (MCS) represents an overall
health index of physical or mental health (range 0–100).
Statistics
Descriptive data are presented by means and standard
deviation (SD), median and percentiles, number and
percentages at baseline and 6 years follow-up according
to data level.
For all eight subscales, of SF-36 a cut-off was introduced at the mean value for Swedish women aged 46–
54 years [25]. Being equal to or higher than the mean
was coded as 1 and being worse off coded as 0. Several
multivariable logistic regressions were made to identify
potential prognostic factors, one for each of the
following dependent variables estimated at the 6 year
follow-up: workability, presence of hypertension and the
dichotomization of all eight sub-scales in SF-36.
Rindner et al. BMC Women's Health
(2020) 20:171
Page 5 of 10
Table 1 Participant Characteristics at First Assessment (n = 71)
Mean (SD)
Age (y)a
Median (IR)
N (%)
50 (3.1)
Education (y)b
Primary school (≤ 9)
15 (21)
Secondary school (10–12)
31 (44)
Tertiary school (> 12)
25 (35)
Work status/ Employment statusb
Currently working/studyingc
61 (86)
Sick leave full-time
0 (0.0)
Sick leave part-time
0 (0.0)
Disability pension (full-time)
3 (4.0)
Disability pension (part-time)
2 (3.0)
Unemployed full-time
5 (7.0)
Unemployed part-time
0 (0.0)
Family statusb
Living with a partner
66 (93)
Children at home
17 (24)
Still menstruatingb,d
34 (63)
Average MRS scoree
Somatic
4.3 (3.0)
4.0 (2–6)
Urogenital
2.4 (2.5)
2.0 (0–4)
Psychological
3.7 (3.1)
3.0 (1–6)
Total MRS
10 (6.9)
9.0 (0–15)
7.3 (5.5)
6.0 (3–11)
Average depression scoref,g
a
First figure mean value (SD)
b
n (%)
c
Work more than 1 h a w = work more than one hour per week
d
34/54 are still menstruating. Information is missing in 17 women
e
Subscale and total Menopause Rating Scale (MRS) scoring. First figure mean
(SD) second figure median (25th and 75th percentile). Degree of severity of
the MRS and its domains indicated; Psychological domain; No, little (0–1), Mild
(2–3), Moderate (4–6), Severe (7+), Somatic domain; No, little (0–2), Mild (3–4),
Moderate (5–8), Severe (9+), Urogenital domain; No, little (0), Mild (1),
Moderate (2–3), Severe (4+), Total score; No, little (0–4), Mild (5–8), Moderate
(9–16), Severe (17+)
f
Montgomery-Asberg Depression Rating Scale (MADRS) scoring. First figure
mean (SD) second figure median (25th and 75th percentile). International
standards; 0–6 p no depression, 7–19 p, mild depression, 20–34 p moderate
depression, > 34 p severe depression
g
Information is missing in 5 women (66/71)
Multicollinearity testing was made before logistic regression by exploring the value of tolerance and variance
inflator factor (VIF) between independent variables. Independent explanatory variables from the baseline measurement in the logistic regression were: age, working,
living with a partner, having children living at home,
have completed an exam at tertiary level (highest completed education), being in any kind of paid work, any
depression measured with MADRS ≥7, MRS somatic
symptoms ≥9, MRS urogenital symptoms ≥4, MRS
mental symptoms ≥7 and MRS total score ≥ 17, received
active intervention (to adjust for any intervention given
in the previous RCT). The level of significance was set
to P < 0.05. The IBM SPSS Windows version 22 was
used for statistical analyses.
Results
Sixty-five percent (n = 71/110) of the participants could
be followed up after 6 years (Fig. 1). At baseline their
average age was 50 years, most had an education of at
least 10 years, were studying or working, living with a
partner and 63% reported still menstruating (Table 1).
Participants had moderate MRS mental and urogenital
symptoms while the MRS somatic symptoms showed
mild severity at baseline (Table 1). Information about
menstruation was missing for 16 women due to 13 still
using contraceptive treatments with hormones, one had
a previous hysterectomy and two did not provide a clear
statement on menstruation.
Changes from baseline to the 6-year follow-up
No women were on sick leave at baseline while four
women stated they were on part time sick leave at the
6 year follow up. None of these stated the number of
days on sick leave. A decrease in severity of total MRS
score, somatic symptoms and urogenital symptoms was
seen while mental and depressive symptoms increased
(Table 2). As expected, the proportion of women having
children living at home decreased by 59%.
Cardiovascular symptoms at the 6-year follow-up
Current medication for high blood pressure was reported at the follow-up by 28/71 women. Another three
women reported having high blood pressure but was not
taking any medication. Four women described they have
Table 2 Changes from baseline to the 6-year follow-up (n = 71)
Family status
Children at home
a
Being in work
−59%
−3%
Menopausal Symptomsb
Somatic
−0.23
(2.5)
Urogenital
−0.52
(2.5)
Psychological
+ 0.52
(3.0)
Total MRS
−3.5
(5.6)
+ 0.38
(4.3)
Depressive Symptomsc,d
a
Work more than 1 h a w = work more than one hour per week
b
Menopause Rating Scale (MRS) subscale: Somatic symptoms - hot flushes,
heart discomfort, sleeping problems and muscle and joint problems,
Psychological symptoms - depressive mood, irritability, anxiety and physical
and mental exhaustion, Urogenital symptoms - sexual problems, bladder
problems and vaginal dryness, Total score - all subscales added. Higher score
indicates more severe symptoms. Values are mean change
(standard deviation)
c
Montgomery-Asberg Depression Rating Scale (MADRS) scoring. Higher score
indicates more severe symptoms
d
Information is missing in 5 women (66/71)
Rindner et al. BMC Women's Health
(2020) 20:171
Page 6 of 10
had high blood pressure in connection with pregnancy.
Myocardial infarction or cerebral hemorrhage were reported by 5 women.
Baseline prognostic factors s for good health and workability at the 6 year follow-up
The lowest tolerance and the highest VIF for any independent variable was 0.32 and 3.1 respectively. Hence,
multicollinearity was not deemed to be a problem in any
regression. Having tertiary education was associated with
decreased overall mental health (MCS in SF 36)
(Table 3), decreased vitality (VT) and social role
functioning (SF) (Table 4). Living with a partner was
associated with significantly increased physical role functioning (RF), social role functioning (SF) (Table 4) and
emotional role functioning (RE) (Table 5).
Discussion
This study showed that women in ages 45–55 years living with a partner appear to have a better chance for
having good health 6 years later than those living as singles in physical role functioning (RF), social role
functioning (SF) and emotional role functioning (RE)
(Table 3, 4). Having a tertiary education was associated
with a higher risk for decreased mental health (MCS in
SF 36), vitality (VF) and social role functioning (SF)
(Table 4). It appears that level of education might be an
important aspect to take into consideration in women
with poor mental health.
Health and role-functioning
The role-functioning in SF-36 suggests that important
factors to mental health is the ability to participate in
social interaction in and outside the home as well as the
ability to participate in work or other regular activities
without being hampered by emotional problems [26]. In
addition to role functioning a Swedish study showed that
women in Sweden have higher level of education then
men but the average income was lower. Women also
experienced more anxiety and experienced their health
as worse compared with men [2].
Social determinants of health are related to the extent
the woman lives in an equally, friendly, harmless and
safe environment with their partner. Other factors
Table 3 Predictors for good health, workability and presence of hypertension at 6 year follow-up
Predictors
d
Mental Healtha
Physical Healtha
Work ability
Hypertensionb
(n = 69) MCS
SF36
≥ 50
(n = 69) PCS SF36
≥ 50b
(n = 71)
(n = 71)
p-value
p-value
p-value
Effect sizec
Effect sizec
Effect sizec
p-value
Effect sizec
Age
0.0056
1.5 (1.1–1.9)
0.67
0.96 (0.78–1.2)
0.46
1.1 (0.83–1.5)
0.13
1.2 (0.96–1.4)
Tertiary education
0.019
0.16 (0.034–0.74)
0.54
0.65 (0.17–2.6)
0.73
0.71 (0.10–4.8)
0.53
1.3 (0.40–4.4)
Work abilitye
0.66
0.60 (0.061–5.8)
0.017
21 (1.7–250)
0.0025
51 (4.0–670)
0.023
0.12 (0.018–0.85)
Living with a partner
0.12
9.4 (0.56–160)
0.75
1.5 (0.13–17)
1.0
0.00 (0.00-.∞)
0.80
1.1 (0.10–13)
Children at home
0.61
1.6 (0.28–8.3)
0.41
2.0 (0.39–11)
0.47
2.5 (0.22–28)
0.26
0.51 (0.11–2.4)
Depressionf
0.027
0.15 (0.027–0.81)
0.012
0.16 (0.037–0.67)
0.50
2.2(0.22–22)
0.88
1.1 (0.30–4.3)
0.95
1.1 (0.090–13)
1.0
1.0 (0.12–8.4)
0.44
0.34 (0.22–5.3)
0.57
0.55 (0.071–4.2)
Psychologic
0.0069
0.035 (0.0032–0.40)
0.93
1.1 (0.23–5.1)
0.065
0.11 (0.011–1.1)
0.27
2.0 (0.45–9.2)
Urogenitalg
0.47
1.9 (0.34–10)
0.71
1.3 (0.32–5.3)
0.32
4.1 (0.26–12)
0.84
0.96 (0.25–3.7)
0.66
0.74 (0.19–2.8)
0.99
1.0 (0.29–3.4)
0.54
1.8 (0.27–12)
0.26
2.0 (0.61–6.3)
MRS
Somaticg
g
h
Active intervention
Nagelkirke R square
0.53
Hosmer-Lemeshow test
0.88
Area Under Curveg
< 0.001
Omnibus test of model
0.00006
a
0.36
0.35
0.87 (0.78–0.95)
< 0.001
0.019
0.49
0.29
0.81 (0.70–0.91)
< 0.001
0.0005
0.26
0.49
0.87 (0.77–0.98)
< 0.001
0.76 (0.64–0.87)
0.12
Cut of norm for Swedish women 45–54 years, SF36
b
The part of the women stated having hypertension
c
Effect size is Odds Ratio and (95% CI) for all predictors. First figure is p-value, second figure is predicted probability and CI, the odds ratio increase in score value
d
Odds Ratio for an increase in age of 1 year between 45 and 55 years
e
Working at least one hour/week
f
Montgomery-Asberg Depression Rating Scale (MADRS) score ≥ 7 indicating at least mild depression. Information is missing in 5 women (66/71)
g
Menopause Rating Scale and total Menopause Rating Scale (MRS) scoring. Somatic symptoms - hot flushes, heart discomfort, sleeping problems and muscle and
joint problems; Psychological symptoms - depressive mood, irritability, anxiety and physical and mental exhaustion; Urogenital symptoms - sexual problems,
bladder problems and vaginal dryness. Higher score indicates more severe symptoms
h
The active group intervention is just as an adjustment and it is not the focus of this study
Rindner et al. BMC Women's Health
(2020) 20:171
Page 7 of 10
Table 4 Prognostic factors for good health estimated by the SF36 subscales Role Function, Physical Function, Vitality and Social
Function at 6 year follow-up
PF n = 70
≥ 86a
RF n = 71
≥ 84a
Predictors
c
Age
VT n = 70
≥ 68a
SF n = 70
≥ 88a
P-value
Effect sizeb
P-value
Effect sizeb
P-value
Effect sizeb
P-value
Effect sizeb
0.60
1.06 (0.86–1.3)
1.0
1.0 (0.83–1.2)
0.12
1.3 (0.94–1.7)
0.078
0.12 (0.98–1.5)
Tertiary education
0.12
0.34 (0.089–1.3)
0.78
0.83 (0.22–3.1)
0.033
0.18 (0.035–0.87)
0.0051
0.12 (0.28–0.50)
Work abilityd
0.065
7.3 (0.89–59)
0.028
8.7 (1.3–61)
0.21
5.5 (0.39–80)
0.62
1.6 (0.24–11)
Living with a partner
0.016
32 (1.9–530)
0.87
1.2 (0.12–11)
0.60
0.47 (0.027–8.1)
0.031
21 (1.3–320)
Children at home
0.76
0.78 (0.16–3)
0.19
3.0 (0.59–15)
0.15
4.0 (0.61–26)
0.34
0.46 (0.91–2.3)
Depressione
0.077
0.28 (0.065–1.2)
0.021
0.20 (0.050–0.78)
0.014
0.092 (0.014–0.61)
0.11
0.31 (0.072–1.3)
Somaticf
0.51
0.45 (0.043–4.7)
0.96
0.96 (0.15–6.2)
0.47
2.6 (0.19–36)
0.23
0.25 (0.025–2.4)
Psychologicf
0.45
0.56 (0.12–2).5)
0.88
1.1 (0.25–5.2)
1.0
0.00 (0.00-∞)
0.25
0.40 (0.085–1.9)
Urogenital
0.65
1.4 (0.32–6.2)
0.47
1.7 (0.42–6.6
0.64
1.5 (0.26–8.7)
0.29
0.46 (0.11–2.0)
Active interventiong
0.059
3.0 (0.85–1.04)
0.14
2.6 (0.73–9.4)
0.10
3.4 (0.78–15)
0.065
0.31(0.87–1.1)
MRS symptoms
f
Nagelkirke R square
0.38
Hosmer-Lemeshow test
0.63
Area Under Curvef
0.031
Omnibus test of model
0.009
0.27
0.57
0.47
0.65 (0.52–0.78)
0.015
0.91
0.68 (0.54–0.81)
0.12
0.005
0.40
0.80
0.70 (0.58–0.83)
< 0.001
0.000
0.82 (0.72–0.91)
0.006
a
Cut of for norm Swedish women age 46–54 years, SF36. SF36 subscales; Role function (RF), Physical function (PF), Vitality (VT) and Social function (SF). Higher
score indicated better health
b
Effect size is Odds Ratio and (95% CI) for all predictors. First figure is p-value, second figure is predicted probability and CI. The odds ratio increase in score value
c
Odds Ratio for an increase in age of 1 year between 45 and 55 years
d
Working more than one hour/week
e
Montgomery-Asberg Depression Rating Scale (MADRS) score ≥ 7 indicating at least mild depression. Information is missing in 5 women (66/71)
f
Menopause Rating Scale and total Menopause Rating Scale (MRS) scoring. Somatic symptoms - hot flushes, heart discomfort, sleeping problems and muscle and
joint problems; Psychological symptoms - depressive mood, irritability, anxiety and physical and mental exhaustion; Urogenital symptoms - sexual problems,
bladder problems and vaginal dryness. Higher score indicates more severe symptoms
g
The active group intervention is just as an adjustment and it is not the focus of this study
related to women’s health are the ability to cope and
solve problems in life, if there is a balance in life between work and leisure and if there is time for recovery.
Tertiary education
Historically we know people with shorter education
more often suffer from mental health problems and experience their health as poor compared to those who
have a longer education [18]. Hence, women with higher
education have previously been noted to have lower sick
leave than women with shorter education [18]. However,
the last 5 to 10 years has seen a dramatic change where
the largest increase in sick leave has been in the group
with longer education [27]. High demands at work and
home as well as psychosocial factors seems involved
resulting in stress related diagnoses increasing more for
academics than for women with shorter education [18].
Higher education for women will have benefits but
may also be linked to higher exposure to certain risks,
for example including patriarchal systems that hinder
women’s progress in business and academia, excessive
burdens from taking care of others, the tension between
traditional administrations and realities in life and
violence and sexual harassment in the workplace. Hence,
higher education may be linked to a higher exposure to
some risks, most of which may be improved through action from the state [2, 10]. A previous Swedish report
showed a strong increase in long-term sick leave, mainly
among female academics, where the most common
problems were caused by stress-related illness and depression [27]. Our findings seem to support this showing
that higher education was associated with future lower
mental health, lower vitality and lower social role function. It is important for women to maintain awareness
about a healthy balance in life and to have realistic goals
in work as well as in their social life.
Living with a partner
Pervious research showed that social support and to be
happily married were important factors for good mental
health with an association between marital status and
good health [28]. Midlife happily married women reported better mental health and life satisfaction compared with women unhappy with their marriages and
single women [28, 29]. This was further confirmed in a
meta-analysis describing associations between marital
Rindner et al. BMC Women's Health
(2020) 20:171
Page 8 of 10
Table 5 Prognostic factors for good health estimated by the SF36 subscales Mental health, General health, Role emotional and
Bodily pain at 6 years follow-up
MH n = 70
≥ 80a
Predictors
c
Age
GH n = 70
≥ 75a
RE n = 71
≥ 87a
BP n = 69
≥ 71a
p-value
Effect sizeb
p-value
Effect sizeb
p-value
Effect sizeb
p-value
Effect sizeb
0.11
1.4 (0.94–2.0)
0.071
1.2 (0.98–1.5)
0.062
1.2 (0.99–1.5)
0.93
0.99 (0.82–1.2)
Tertiary education
0.47
0.52 (0.092–3.0)
0.14
0.37 (0.10–1.4)
0.085
0.25 (0.050–1.2)
0.88
1.2 (0.33–3.6)
Work abilityd
0.64
2.1 (0.093–48)
0.025
18 (1.4–220)
0.82
1.3 (0.16–10)
0.14
4.3 (0.62–29)
Living with a partner
0.74
1.9 (0.060–58)
0.12
8.3 (0.59–116)
0.017
29 (1.8–460)
0.43
0.37 (0.029–4.5)
Children at home
0.94
1.1 (0.094–13)
0.47
1.7 (0.39–7.6)
0.97
0.97 (0.18–5.3)
0.98
0.98 (0.22–4.4)
0.16
0.18 (0.017–1.9)
0.13
0.33 (0.080–1.4)
0.24
0.38 (0.075–2.0)
0.062
0.30 (0.083–1.1)
Somaticf
1.0
0.00 (0.00- ∞)
0.73
0.67 (0.070–6.5)
0.64
0.59 (0.061–1.9)
0.98
0.98 (0.14–7.1)
Psychologicf
1.0
0.00 (0.00-∞)
0.37
0.46 (0.084–2.5)
0.011
0.11 (0.020–0.61)
0.99
1.01 (0.22–4.6)
0.44
2.1 (0.32–14)
0.52
0.63 (0.16–2.5)
0.74
1.3 (0.23–61)
0.75
1.2 (0.33–4.6)
0.89
1.2 (0.24–5.2)
0.87
9.1 (0.34–3.6)
0.25
0.43 (0.10–1.8)
0.55
1.4 (0.46–4.3)
Depression
e
MRS symptoms
Urogenital
f
Active interventiong
Nagelkirke R square
0.35
Hosmer & Lemeshow
0.94
Area Under Curveg
0.001
Omnibus test of model
0.13
0.33
0.40
0.33
0.84 (0.75–0.94)
< 0.001
0.47
0.79 (0.68–0.90)
0.029
< 0.001
0.010
0.22
0.98
0.85 (0.75–0.95)
0.001
0.72 (0.60–0.85)
0.28
a
Cut of norm for Swedish women 45–54 years, SF36. SF36 Subscales; Mental health (MH), General health (GH), Role emotional (RE) and Bodily pain (BP). Higher
score indicated better health
b
Effect size is Odds Ratio and (95% CI) for all predictors. First figure is p-value, second figure is predicted probability and CI. The odds ratio increase in score value
c
Odds Ratio for an increase in age of 1 year between 45 and 55 years
d
Working more than one hour/week
e
Montgomery-Asberg Depression Rating Scale (MADRS) score ≥ 7 indicating at least mild depression. Information is missing in 5 women (66/71)
f
Menopause Rating Scale and total Menopause Rating Scale (MRS) scoring. Somatic symptoms - hot flushes, heart discomfort, sleeping problems and muscle and
joint problems; Psychological symptoms - depressive mood, irritability, anxiety and physical and mental exhaustion; Urogenital symptoms - sexual problems,
bladder problems and vaginal dryness. Higher score indicates more severe symptoms
g
The active group intervention is just as an adjustment and it is not the focus of this study
status and physical health showing that a higher marital quality was associated with a better health and lower risk of mortality [28]. This study confirms these previous findings
showing that living with a partner indicated a better chance
for having a good health 6 years later compared to those living
as singles in respect of physical role functioning (RF), social
role functioning (SF) and emotional role functioning (RE). A
key to good health may be effective communication in the
partner relationship [29]. Hence, it is important to be aware of
and consider asking about marital status and quality of the
partner relation when discussing health issues with women in
age 45–55 years.
Strengths and limitations
The use of validated questionnaires such as MRS and SF-36 is
a strength and allow comparisons with other studies. A potential limitation is that we did not include information about being pre and post-menopausal at baseline as a prognostic factor
because we lacked information about this variable in 17
women (Table 1). Some women didn’t know or could not
state if they were postmenopausal due to the use of contraceptives [30]. Another limitation is that we didn’t used the questionnaire SF-36 at the first assesmet.
Conclusion
This six-year long cohort-study of women’s health in the
age 45–55 years shows that living in a good relation with
a partner seems to be a strong factor for good perceived
health 6 years later while higher education seem be a
risk factor for poorer mental health 6 years later. Hence,
awareness needs to be raised that higher education,
while being beneficial in some aspects, might also be
linked to higher exposure to certain risks.
The preventive focus should be on social determinants
and striving to live life as best as possible, ensure maintaining a social network, invest in having a good relationship with partners and continue to learning.
Hence, it is important to early discuss with women if
the life they live are creating a lower quality of life for
them. If so, an important subsequent discussion should
be held about reevaluating the way they live and the
need for change. This includes the partner relationship
and social support structures. A reasonable conclusion
would be that women in the age 45–55 years attending
PHC should be supported to gain increased awareness
about a healthy balance in life and to have realistic goals
in work as well as in their social life.
Rindner et al. BMC Women's Health
(2020) 20:171
Abbreviations
PHC: Primary health care; MRS: The menopause rating scale; MADRS-S: The
montgomery-asberg depression rating scale; SF-36: The short-form health
survey; PF: Physical functioning; RF: Role-physical; BP: Bodily pain; MH: Mental
health; RE: Role-emotional; VT: Vitality; GH: General health; SF: Social
functioning; PCS: Physical component summary; MCS: Mental component
summary; SD: Standard deviation; VIF: Variance inflator factor
Acknowledgements
The authors would like to acknowledge the study participants for their time
and engagement in the study and who made this article possible. Financial
support was provided by The Local Research and Development Council
Södra Älvsborg and The Healthcare sub-committee, Region Västra Götaland.
Authors’ contributions
LR, designed the study, and contributed to the analysis and interpretation of
data, and revision of the manuscript. LN, designed the study, and
contributed to the analysis and interpretation of data, and revision of the
manuscript. GS, took part in patient selection, and contributed to the analysis
and interpretation of data, and revision of the manuscript. IS contributed to
the analysis and interpretation of data, and revision of the manuscript. ÅP
contributed to the analysis and interpretation of data, and revision of the
manuscript. DH designed the study, and contributed to the analysis and
interpretation of data, and revision of the manuscript. RG designed the
study, and contributed to the analysis and interpretation of data, and
revision of the manuscript. GR designed the study, and contributed to the
analysis and interpretation of data, and revision of the manuscript. All
authors read and approved the final manuscript.
Funding
This trial is supported by grants from Financial support was provided by The
Local Research and Development Council Södra Älvsborg. The funding
source has no involvement in the study. Open access funding provided by
University of Gothenburg.
Availability of data and materials
The authors make available the data set used for the study.
Ethics approval and consent to participate
The study was approved by the Regional Ethical Review Board in
Gothenburg Sweden (registration number 041–09; T503–14). Regional Ethical
Review Board, Guldhedsgatan 5a, 413 20 Göteborg, Sweden.
Written informed consent was obtained from all participants included in the
study.
Consent for publication
Not Applicable.
Competing interests
The authors declare that they have no competing interests.
Author details
1
Närhälsan, Södra Torget Health Care Center, Kvarngatan 4, SE-503 36 Borås,
Sweden. 2Region Västra Götaland, Research and Development Primary
Health Care, Research and Development Center Södra Älvsborg, Borås,
Sweden. 3Primary Health Care, Public Health and Community Medicine,
School of Public Health, Institute of Medicine, the Sahlgrenska Academy,
University of Gothenburg, Gothenburg, Sweden. 4Institute of Neuroscience
and Physiology Department of Health and Rehabilitation, Unit of
Physiotherapy, University of Gothenburg, Sahlgrenska Academy, Gothenburg,
Sweden. 5Region Västra Götaland, Research and Development Primary
Health Care, Research and Development Center Fyrbodal, Gothenburg,
Sweden. 6Region Västra Götaland, Research and Development Primary
Health Care, Research and Development Center Gothenburg, Gothenburg,
Sweden. 7Institute of Health and Care Sciences, University of Gothenburg,
Sahlgrenska Academy, Gothenburg, Sweden. 8Närhälsan, Svenljunga Health
Care Center, Svenljunga, Sweden. 9Närhälsan Borås Youth Centre, Region
Västra Götaland, Borås, Sweden.
Page 9 of 10
Received: 7 October 2019 Accepted: 7 July 2020
References
1. Försäkringskassan: Mental illness 2016:2 In. Stockholm; 2016: Psykisk ohälsa
2016:2012. Stockholm. 2016.
2. Lidwall U, Bill S, Palmer E, Olsson Bohlin C. Mental disorder sick leave in
Sweden: A population study. Work (Reading, Mass). 2018;59(2):259–72.
3. Lytsy P, Larsson K, Anderzen I. Health in women on long-term sick leave
because of pain or mental illness. Int J Rehabil Res. 2015;38(1):27–33.
4. Gracia CR, Freeman EW. Onset of the menopause transition: the earliest
signs and symptoms. Obstet Gynecol Clin N Am. 2018;45(4):585–97.
5. WHO. Research on the Menopause in the 1990s, WHO Technical Services
Report 866. Geneva: World Health Organization; 1996.
6. Harlow SD, Gass M, Hall JE, Lobo R, Maki P, Rebar RW, Sherman S, Sluss PM,
de Villiers TJ. Executive summary of the Stages of Reproductive Aging
Workshop + 10: addressing the unfinished agenda of staging reproductive
aging. Menopause (New York). 2012;19(4):387–95.
7. Blumel JE, Chedraui P, Baron G, Belzares E, Bencosme A, Calle A, Danckers L,
Espinoza MT, Flores D, Gomez G, et al. Menopausal symptoms appear
before the menopause and persist 5 years beyond: a detailed analysis of a
multinational study. Climacteric. 2012;15(6):542–51.
8. Freeman EW, Sammel MD, Boorman DW, Zhang R. Longitudinal pattern of
depressive symptoms around natural menopause. JAMA Psychiatry. 2014;
71(1):36–43.
9. Dennerstein L, Soares CN. The unique challenges of managing depression
in mid-life women. World Psychiatry. 2008;7(3):137–42.
10. Organization WWH. Promoting Mental Health - World Health Organization.
In: The world health report 2001 - Mental Health: New - WHO 2001a, p1;
2004.
11. OECD. Mental Health and Work. Sweden, OECD. In: OECD Publishing; 2015.
vol. Mental Health and Work. Sweden, OECD. Publishing 2015. Sweden:
OECD; 2015.
12. Makara-Studzinska MT, Krys-Noszczyk KM, Jakiel G. Epidemiology of the
symptoms of menopause - an intercontinental review. Przeglad
menopauzalny. 2014;13(3):203–11.
13. Kanadys K, Wiktor-Stoma A, Lewicka M, Sulima M, Wiktor H. Predictors of
the quality of life of women in peri-menopausal period. Ann Agric Environ
Med. 2016;23(4):641–8.
14. Dellve L, Ahlborg T. Partner relationships and long-term sick leave among
female workers: consequences and impact on dimensions of health and
return to work. Scand J Caring Sci. 2012;26(4):720–9.
15. Rydstrom I, Dalheim Englund L, Dellve L, Ahlstrom L. Importance of social
capital at the workplace for return to work among women with a history of
long-term sick leave: a cohort study. BMC Nurs. 2017;16:38.
16. Nelson HD. Menopause. Lancet. 2008;371(9614):760–70.
17. Geukes M, van Aalst MP, Robroek SJ, Laven JS, Oosterhof H. The impact of
menopause on work ability in women with severe menopausal symptoms.
Maturitas. 2016;90:3–8.
18. Molarius A, Granstrom F. Educational differences in psychological distress?
Results from a population-based sample of men and women in Sweden in
2012. BMJ Open. 2018;8(4):e021007.
19. Blumel JE, Aedo S, Arteaga E, Vallejo MS. Risk factors of long-term mortality
in middle-aged women: a 27-year follow-up cohort. Climacteric. 2018;21(6):
554–8.
20. Geukes M, Anema JR, van Aalst MP, de Menezes RX, Oosterhof H.
Improvement of menopausal symptoms and the impact on work ability: a
retrospective cohort pilot study. Maturitas. 2019;120:23–8.
21. Rindner L, Stromme G, Nordeman L, Wigren M, Hange D, Gunnarsson R,
Rembeck G. Prevalence of somatic and urogenital symptoms as well as
psychological health in women aged 45 to 55 attending primary health
care: a cross-sectional study. BMC Womens Health. 2017;17(1):128.
22. Rindner L, Stromme G, Nordeman L, Hange D, Gunnarsson R, Rembeck G.
Reducing menopausal symptoms for women during the menopause
transition using group education in a primary health care setting-a
randomized controlled trial. Maturitas. 2017;98:14–9.
23. Heinemann K, Ruebig A, Potthoff P, Schneider HP, Strelow F, Heinemann
LA, Do MT. The menopause rating scale (MRS) scale: a methodological
review. Health Qual Life Outcomes. 2004;2:45.
24. Montgomery SA, Asberg M. A new depression scale designed to be
sensitive to change. Br J Psychiatry. 1979;134:382–9.
Rindner et al. BMC Women's Health
(2020) 20:171
25. Sullivan M, Karlsson J, Ware JE Jr. The Swedish SF-36 Health Survey--I.
Evaluation of data quality, scaling assumptions, reliability and construct
validity across general populations in Sweden. Soc Sci Med (1982). 1995;
41(10):1349–58.
26. Orwelius L, Fredrikson M, Kristenson M, Walther S, Sjoberg F. Health-related
quality of life scores after intensive care are almost equal to those of the
normal population: a multicenter observational study. Critical care (London).
2013;17(5):R236.
27. Andrén T. Psykisk ohälsa bland akademiker. Svårt att bota men lättare att
förhindra. In: vol. Psykisk ohälsa bland akademiker. Svårt att bota men lättare
att förhindra. Avaliable on: />dokument/rapporter/2017-psykisk-ohalsa-bland-akademiker.pdf; 2017.
28. Tatangelo G, McCabe M, Campbell S, Szoeke C. Gender, marital status and
longevity. Maturitas. 2017;100:64–9.
29. Zaheri F, Dolatian M, Shariati M, Simbar M, Ebadi A, Azghadi SB. Effective
factors in marital satisfaction in perspective of Iranian women and men: a
systematic review. Electron Physician. 2016;8(12):3369–77.
30. Rodstrom K, Weman L, Sandin L, Hange D, Bjorkelund C. Is it possible to
investigate menopausal age? A comparative cross-sectional study of five
cohorts between 1968 and 2017 from the population study of women in
Gothenburg, Sweden. Menopause (New York). 2020;27(4):430–436.
Publisher’s Note
Springer Nature remains neutral with regard to jurisdictional claims in
published maps and institutional affiliations.
Page 10 of 10