Functional microRNA high throughput screening reveals miR-9 as a central regulator of liver oncogenesis by affecting the PPARA-CDH1 pathway
Bạn đang xem bản rút gọn của tài liệu. Xem và tải ngay bản đầy đủ của tài liệu tại đây (2.17 MB, 11 trang )
Drakaki et al. BMC Cancer (2015) 15:542
DOI 10.1186/s12885-015-1562-9
RESEARCH ARTICLE
Open Access
Functional microRNA high throughput
screening reveals miR-9 as a central regulator of
liver oncogenesis by affecting the PPARA-CDH1
pathway
Alexandra Drakaki1,2, Maria Hatziapostolou3, Christos Polytarchou3, Christina Vorvis3, George A. Poultsides4,
John Souglakos2, Vassilis Georgoulias2 and Dimitrios Iliopoulos3*
Abstract
Background: Hepatocellular carcinoma (HCC) is the second leading cause of cancer-related deaths, reflecting the
aggressiveness of this type of cancer and the absence of effective therapeutic regimens. MicroRNAs have been
involved in the pathogenesis of different types of cancers, including liver cancer. Our aim was to identify
microRNAs that have both functional and clinical relevance in HCC and examine their downstream signaling
effectors.
Methods: MicroRNA and gene expression levels were measured by quantitative real-time PCR in HCC tumors and
controls. A TargetScan algorithm was used to identify miR-9 downstream direct targets.
Results: A high-throughput screen of the human microRNAome revealed 28 microRNAs as regulators of liver
cancer cell invasiveness. MiR-9, miR-21 and miR-224 were the top inducers of HCC invasiveness and also their
expression was increased in HCC relative to control liver tissues. Integration of the microRNA screen and expression
data revealed miR-9 as the top microRNA, having both functional and clinical significance. MiR-9 levels correlated
with HCC tumor stage and miR-9 overexpression induced SNU-449 and HepG2 cell growth, invasiveness and their
ability to form colonies in soft agar. Bioinformatics and 3′UTR luciferase analyses identified E-cadherin (CDH1) and
peroxisome proliferator-activated receptor alpha (PPARA) as direct downstream effectors of miR-9 activity. Inhibition
of PPARA suppressed CDH1 mRNA levels, suggesting that miR-9 regulates CDH1 expression directly through
binding in its 3′UTR and indirectly through PPARA. On the other hand, miR-9 inhibition of overexpression
suppressed HCC tumorigenicity and invasiveness. PPARA and CDH1 mRNA levels were decreased in HCC relative to
controls and were inversely correlated with miR-9 levels.
Conclusions: Taken together, this study revealed the involvement of the miR-9/PPARA/CDH1 signaling pathway in
HCC oncogenesis.
Keywords: miR-9, Hepatocellular oncogenesis, Functional screen, PPARA, E-cadherin
* Correspondence:
3
Center for Systems Biomedicine, Division of Digestive Diseases, David
Geffen School of Medicine, University of California, Los Angeles, 650 Charles
E. Young Dr., CHS 44-133, Los Angeles, CA 90095-7278, USA
Full list of author information is available at the end of the article
© 2015 Drakaki et al. This is an Open Access article distributed under the terms of the Creative Commons Attribution License
( which permits unrestricted use, distribution, and reproduction in any medium,
provided the original work is properly credited. The Creative Commons Public Domain Dedication waiver (http://
creativecommons.org/publicdomain/zero/1.0/) applies to the data made available in this article, unless otherwise stated.
Drakaki et al. BMC Cancer (2015) 15:542
Background
Hepatocellular cancer (HCC) is the most frequent type
of malignancy originating from the liver with a recently
rising incidence in the United States [1]. It is the second
most common cause of cancer-related death worldwide
with more than 500,000 new cases per year. The incidence of the disease approximates the death rate, which
reflects the aggressiveness of this tumor [2]. HCC is one
of the few types of cancer in which the various risk factors are well characterized. Specifically, infections with
the hepatitis B and C virus as well as aflatoxin B1 (AFB)
are responsible for almost 80 % of the cases [3].
At the same time, the molecular mechanisms that lead
to the pathogenesis of HCC are not completely understood. Up to date, there are several genes involved in the
signaling pathways essential for the initiation and progression of hepatocellular carcinogenesis and these include, but are not limited to, c-myc, PTEN, e-cadherin,
cyclin D1 and p53 [4].
MicroRNAs are small non-coding RNA molecules,
18–25 nt long, that act as negative regulators of gene
expression, through binding in the 3′UTR of the coding
sequence of genes [5]. Previous studies have identified
different microRNAs to be deregulated in liver precancerous and cancer stages [6, 7]. Specifically, microRNAs have been identified to regulate cell cycle through
regulation of cyclin G1 [8]. In addition, miR-21 was identified to have a potent oncogenic potential in HCC by
blocking directly the PTEN tumor suppressor gene [9]. Furthermore, another study revealed a 20-microRNA metastasis signature that could significantly predict primary HCC
tissues with venous metastases from metastasis-free solitary
tumors with 10-fold cross-validation [10]. Interestingly,
Xu Y et al. showed that a polymorphism in the promoter
region of miR-34b/c was associated with an increased
risk for primary hepatocellular carcinoma [11]. Also,
serum microRNAs were found to potentially serve as
biomarkers for HBV infection and diagnosis of HBVpositive HCC [12], suggesting the potential of measuring circulating microRNA levels as biomarkers in HCC.
However, it has not been extensively studied which
microRNAs have both clinical and functional relevance
in this type of cancer. Here, we are describing that miR-9
is potentially a novel oncogene in liver cancer, regulating
the tumor initiation, growth and metastatic potential of
liver cancer cells. On the other hand, inhibition of miR-9
expression blocks the tumor properties of liver cancer cells,
including cell growth and migration, suggesting its therapeutic potential. Interestingly, we found that miR-9 suppressed CDH1 mRNA expression levels, directly through
binding in its 3′UTR and indirectly through regulation of
PPARA expression levels. Taken together, this study reveals
a novel role for the miR-9/PPARA/CDH1 signaling pathway in HCC oncogenesis.
Page 2 of 11
Methods
RNA from HCC and liver control samples
RNA was extracted from 24 Fixed-Formalin- ParaffinEmbedded (FFPE) HCC and 14 liver control (adjacent nontumor) tissue specimens obtained from consenting patients
in the Department of Surgery at Stanford University and
were approved by the Ethics Committee of the Stanford
University Medical School.
MicroRNA library screen
SNU-449 liver cancer cells were plated in 96-well plates
and transfected with a microRNA library consisting of 316
microRNA mimics and 2 negative control microRNAs
(100 nM) (Dharmacon Inc). At 48 h post-transfection,
SNU-449 cell invasiveness was evaluated in Boyden
chamber invasion plates. Assays were conducted according
to manufacturer’s protocol, using 2 % FBS as a chemoattractant. Invading cells were fixed and stained with 0.1 %
crystal violet, 24 h post seeding. The cells that migrated
through the filter were quantified by counting the entire
area of each filter. MicroRNAs that affected >2-fold (50 %)
SNU-449 invasiveness relative to microRNA negative control treated SNU-449 cells were considered as positive hits.
Invasion assay
We performed invasion assays in SNU-449 cells 24 h
after transfection with miR-9 or anti-miR-9 and their respective controls. Invasion in matrigel has been conducted
by using standardized conditions with BD BioCoat Matrigel
invasion chambers (BD Biosciences). Assays were conducted according to manufacturer’s protocol, using 2 %
FBS as the chemoattractant. Non-invading cells on the
top side of the membrane were removed, while invading
cells were fixed and stained with 0.1 % crystal violet,
24 h post-seeding. The cells that migrated through
the filter were quantified by counting the entire area
of each filter, using a grid and an Optech microscope
at a 20× magnification.
Real-time PCR analysis
Quantitative real-time RT-PCR was performed to determine the expression levels of miR-9, miR-21 and miR224 in 24 human HCC (stage I n = 5; stage II n = 9; stage
III n = 6; stage IV n = 4) and 11 liver control tissues.
RNA was isolated using Trizol, according to manufacturer’s instructions (Invitrogen). Real-time RT-PCR was
assessed on a CFX384 detection system (BioRad) using
the Exiqon PCR primer sets according to manufacturer’s
instructions. MicroRNA expression levels were normalized to the levels of U6 small nuclear snRNA (203907,
Exiqon). Normalized miRNA levels were quantified relative
to the levels of a given control tissue. Real-time PCR was
employed to determine the expression levels of CDH1,
PPARA, vimentin and PDK4. Reverse transcription was
Drakaki et al. BMC Cancer (2015) 15:542
carried out using the Retroscript Kit (AM1710, Applied
Biosystems). Real-time PCR was carried out using the
IQ SYBR Green Supermix (170–8882, BioRad). Gene
expression levels were normalized to the levels of
Glyceraldehyde-3-phosphate dehydrogenase (GAPDH)
and β-actin. Normalized gene expression levels were
quantified to the respective control. The sequences of
the primers used are the following:
CDH1-F: 5′-TGAAGGTGACAGAGCCTCTGGAT-3′
CDH1-R: 5′-TGGGTGAATTCGGGCTTGTT-3′
PPARA-F: 5′-GGCGAGGATAGTTCTGGAAGC-3′
PPARA-R: 5′-CACAGGATAAGTCACCGAGGAG -3′
Vimentin-F: 5′-CCAAACTTTTCCTCCCTGAACC -3′
Vimentin-R: 5′-GTGATGCTGAGAAGTTTCGTTGA -3′
PDK4-F: 5′-CCCCGAGAGGTGGAGCAT-3′
PDK4-R: 5′-GCATTTTCTGAACCAAAGTCCAGTA-3′
Colony formation assay
SNU-449 and HepG2 liver cancer cell lines were transfected with miR-9 or anti-miR-9 and their respective controls. Then, triplicate samples of 2×10⁵ cells from each cell
line were assayed for colony formation using the CytoSelect
Cell Transformation kit (Cell Biolabs, Inc). The number of
colonies were counted after 7 days.
Cell growth assay
SNU-449 and HepG2 liver cancer cell lines were transfected with miR-9 or the respective control and plated on a
96-well plate (5×10³ cells/well). 48 and 72 h later, cell
growth was assessed using the Cell-Titer Glo Luminescence
Cell Viability Assay (Promega).
Liver tumor sphere formation assay
SNU-449 liver cancer cell lines were transfected with
miR-9 or anti-miR-9 were plated in ultra-low attachment
plates (Corning), 24 h post-transfection and were grown
in DMEM F12 (Invitrogen) medium supplemented with
B-27 (Gibco), bFGF and EGF in the culture medium containing 1 % methyl cellulose to prevent cell aggregation.
The number of spheres was evaluated 6 days post plating.
3′UTR luciferase assay
SNU-449 cells were transfected with the reporter vectors carrying the 3′UTR of CDH1 (cat. no 25038,
Addgene) or PPARA (cat. no HmiT054001-MT06,
Genecopoeia). The constructs harbored the seed sequence of miR-9 (wildtype) or had a deletion of this sequence (miR-9 mutant). At 24 h, they were transfected
with miR-9 or miR-control and at 48 h luciferase activity was measured using the Dual Luciferase Reporter
Assay System (Promega).
Page 3 of 11
Statistical analysis
All experiments were performed in triplicate unless otherwise stated. Statistical analyses were performed with the use
of Origin software, version 8.6. Student’s t-test was used to
examine the statistical difference in miR-9 expression between control and HCC tissues. The correlation significance was determined by means of Spearman and Pearson
correlation analyses. A P-value of 0.05 or less was considered statistically significant.
Results
Strategy for the identification of functional and clinically
relevant microRNAs in hepatocellular (HCC) oncogenesis
The identification of microRNAs that are differentially
expressed between HCC and control tissues cannot predict which of these microRNAs are functionally important in HCC pathogenesis, while on the other hand the
identification of microRNAs affecting liver cancer cellular properties does not always suggest that these microRNAs would have human relevance. Thus, we have
developed an experimental strategy, aiming to reveal the
microRNAs that have both functional and human relevance in HCC (Fig. 1a). Specifically, we followed a dual
experimental approach by performing first a highthroughput microRNA screen in SNU-449 liver cancer
cells and secondly, evaluated the expression levels of the
microRNAs derived from this screen in human liver cancer and control tissues.
Identification of microRNAs regulating HCC invasiveness
by performing a human microRNAome library screen in
liver cancer cells
We were interested in identifying the top microRNAs that
were functioning as activators or suppressors of HCC invasiveness. To address this question, we performed a
microRNA library screen in SNU-449 liver cancer cells.
Specifically, we transfected a library of 316 microRNAs
and two microRNA negative controls (miR-NC) and 48 h
post transfection, SNU-449 cell invasiveness was measured by performing a cell invasion Boyden chamber assay
(Fig. 1b). MicroRNAs that induced >2-fold SNU-449
invasiveness were characterized as microRNA invasion
inducers and the microRNAs that suppressed >2-fold
SNU-449 invasiveness were named as microRNA invasion
suppressors (Fig. 1c). Our screen revealed five microRNAs
(miR-9, -224, -21, -24, -27a) as HCC invasion inducers
and 23 microRNAs (miR-29a, -145, -29b, -507, -26a,
-122a, -375, -195, -203, -26b, -199b, -125a, -223, -1, -101,
-199a, -124a, -125b, let-7b, let-7a, miR-148a, -152, -148b)
as HCC invasion suppressors. Overexpression of miR-9
was found to be the top inducer of SNU-449 cell invasiveness (Fig. 1d).
Drakaki et al. BMC Cancer (2015) 15:542
A
Page 4 of 11
C
B
D
miR-NC1
miR-NC2
miR-9
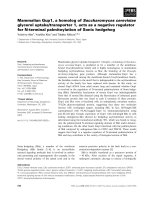
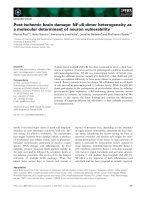
Fig. 1 High-throughput screening identifies microRNAs that control HCC invasiveness. a Steps followed for identification of microRNAs with both
functional and clinical significance in HCC. b Strategy workflow: A library of 316 microRNAs was transfected in SNU-449 liver cancer cells and their
invasiveness was measured 48 h post transfection in Boyden chamber invasion plates. c Screen data plotted as different microRNAs transfected in
SNU-449 cells (x-axis) and their invasiveness (cells/field) compared to scrambled sequence controls (no effect, value = 50) (y-axis). The red circle
represents miR-9, while the blue and yellow circles the microRNA negative controls (miR-NC1, miR-NC2). d SNU-449 cells stained with crystal
violet in BioCoat Matrigel invasion chambers after treatment with miR-NC1, miR-NC and miR-9. Invading cells were fixed and stained with 0.1 %
crystal violet, 24 h post-seeding. The cells that migrated through the filter were quantified by counting the entire area of each filter, using a grid
and an Optech microscope at a 20X magnification
Expression levels of microRNAs, acting as invasion
inducers, in HCC patient tissues
Due to the fact that we were interested in studying a
microRNA that we could therapeutically target by a
microRNA inhibitor, we focused our interest on the
microRNAs that acted as inducers of HCC invasiveness.
The screen above revealed that the top three microRNAs
as statistically significant inducers of liver cancer cell invasiveness were miR-9, miR-224 and miR-21. Thus, we
evaluated their expression levels in 24 HCC tumors and
11 liver control tissues by real-time quantitative PCR
analysis. MiR-9 was found to be 6.5-fold up-regulated in
HCC relative to control tissues (Fig. 2a) and miR-21 expression levels were increased 4.4-fold in HCC relative
to controls (Fig. 2b). In addition, miR-224 was found to
be 6.4-fold up-regulated in HCC relative to controls
(Fig. 2c). Next, we have examined if there is any correlation between miR-9, miR-21 and miR-224 expression
levels and HCC tumor stage. MiR-9 levels were found to
increase during HCC progression (Fig. 2d), having lower
levels in early stages (stage I) and increasing until late
stages (IV). MiR-21 expression was statistically different
between stage I and II HCC tumors, while miR-224 expression was not statistically different between different
HCC tumor stages (Additional file 1: Figure S1).
The next step was to integrate the microRNA library
and tissue profiling data. This analysis revealed that
miR-9 is the microRNA that has the highest ability to induce HCC invasiveness, it is highly expressed in HCC
tumors and its expression correlates with HCC tumor
stage, suggesting both its functional and human relevance in HCC.
MiR-9 is an inducer of HCC cancer cell properties
To evaluate the oncogenic potential of miR-9 activity
in HCC, we performed a series of cancer cell assays, by
overexpressing miR-9 in SNU-449 and HepG2 liver
cancer cell lines (Fig. 3a, Additional file 1: Figure S2a).
First, we examined if miR-9 affects liver cancer cell
growth properties. Specifically, miR-9 was overexpressed in SNU-449 and HepG2 liver cancer cells and
the total cell number was measured 48 and 72 h posttransfection (Fig. 3b, Additional file 1: Figure S2b). We
found that miR-9 induced liver cancer cell growth in
Drakaki et al. BMC Cancer (2015) 15:542
Page 5 of 11
A
B
C
D
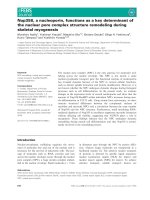
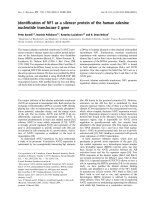
Fig. 2 Relative microRNA expression levels in HCC and liver control tissues. a MiR-9, (b) miR-21 and (c) miR-224 expression levels in 24 HCC
tumors and 11 control liver tissues assessed by real-time RT-PCR analysis. d MiR-9 expression levels in different stages of HCC tumors relative
to controls. Data are represented as mean ± SE. ***P < 0.001, in comparison to control
both cell lines, more significantly 72 h post transfection. Second, we studied miR-9 effects on HCC invasiveness. MiR-9 overexpression induced SNU-449 invasiveness
(Fig. 3c, Additional file 1: Figure S2c), consistent with our
primary microRNA library screen analysis. Furthermore,
miR-9 overexpression induced ~2.3-fold HepG2 cell invasiveness, revealing that the effects of miR-9 on liver cancer
cell invasiveness are not SNU-449 cell line specific. Third,
miR-9 overexpression induced significantly the ability of
both SNU-449 and HepG2 cells to form colonies in soft
agar (Fig. 3d, Additional file 1: Figure S2d). Finally, due to
the fact that miR-9 may function as an oncogene, we examined its ability to regulate liver tumor sphere formation.
We found that miR-9 overexpression increased the ability
of SNU-449 cells to form spheres in suspension (Fig. 3e).
Taken together, these functional assays suggest that miR-9
plays an oncogenic role in HCC, affecting both cancer cell
proliferation and invasiveness rates.
PPARA and E-cadherin (CDH1) as direct downstream targets
of miR-9 in HCC
We were interested in examining the downstream gene effectors of miR-9 oncogenic activity in HCC. Bioinformatics
analysis by using the TargetScan algorithm revealed that
miR-9 has very strong and highly conserved binding sites
on the 3′ untranslated regions (UTRs) of PPARA and
CDH1 genes. Specifically, miR-9 has sequence complementarity in the position 7624-31 nt of the 3′UTR of PPARA
and also in the position 1327-33 nt of the 3′UTR of CDH1
(Fig. 4a). To examine the direct interactions between miR-9
and these potential downstream direct targets, we performed 3′UTR luciferase assays. MiR-9 was overexpressed
in SNU-449 cells that were co-transfected with a construct
harboring the 3′UTR of PPARA or CDH1 under luciferase
activity. We found that miR-9 overexpression suppressed
both CDH1 and PPARA 3′UTR luciferase activities, having
a stronger effect on CDH1 (Fig. 4b). Mutation of the miR-9
binding sites in the 3′UTR PPARA and CDH1 luciferase
vectors abolished the suppressive effects of miR-9. These
data validate at the molecular level of the direct interactions
between miR-9 and PPARA or CDH1 genes.
Next, we examined miR-9 effects on CDH1 mRNA expression levels. Overexpression of miR-9 suppressed significantly CDH1 mRNA levels, while inhibition of miR-9
expression by an antisense-miR-9 resulted in up-regulated
of CDH1 mRNA levels, in both SNU-449 and HepG2 liver
cancer cells, assessed by qPCR analysis (Fig. 4c). Due to the
fact that CDH1 is an epithelial marker gene [13] and its loss
Drakaki et al. BMC Cancer (2015) 15:542
A
Page 6 of 11
B
C
miR-Ctrl
miR-9
E
D
miR-Ctrl
miR-9
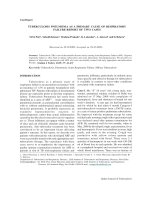
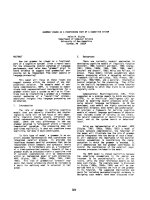
Fig. 3 Effects of miR-9 overexpression on liver cancer cellular properties. a Relative miR-9 expression levels in SNU-449 cells after transfection with miR
control or miR-9, 48 h post-transfection. b Cell growth of SNU-449 liver cancer cells transfected with miR negative control (miR-Control) or miR-9, 48 h and
72 h post-transfection. c Invasion of SNU-449 after transfection with miR negative control (miR-Control) or miR-9, 48 h post-transfection. d Soft agar colony
assay in SNU-449 overexpressing miR-9 or miR-Control. e Effects of miR-9 overexpression on the number of SNU-449 liver tumor spheres. All data are
represented as mean ± SE. ***P < 0.001, **P < 0.01
has been correlated with epithelial mesenchymal transition,
we examined the expression levels of the mesenchymal
marker [14], vimentin. Real-time PCR analysis showed that
miR-9 overexpression increased significantly vimentin
mRNA levels (Fig. 4d). In addition, miR-9 overexpression
reduced PPARA mRNA levels in SNU-449 cells (Fig. 4e).
To further validate the miR-9/PPARA interaction, we
examined PDK4 expression levels after miR-9 overexpression in liver cancer cells. PDK4 is a known downstream direct target of the PPARA transcription factor
in hepatocytes [15, 16]. MiR-9 overexpression resulted
in ~50 % reduction of PDK4 mRNA levels, assessed by
real-time PCR analysis (Fig. 4f ). Previous studies have
identified a positive correlation between E-cadherin
and the PPARA signaling pathways [17, 18]. So, we
inhibited PPARA expression levels using an siRNA against
PPARA (siPPARA) in SNU-449 and HepG2 cells and
assessed levels of CDH1 mRNA by real-time PCR. Inhibition of PPARA resulted in >60 % reduction in CDH1
mRNA expression levels in both cell lines (Fig. 4g). Taken
together, these data suggest that miR-9 regulates CDH1 expression directly through binding to its 3′UTR and indirectly by controlling PPARA expression. PPARA inhibition
resulted in suppression of CDH1 mRNA levels, while
CDH1 inhibition, by using an siRNA against CDH1, did
not affect PPARA mRNA levels (Additional file 1: Figure
S3), suggesting that there is not a bi-directional regulation
between PPARA and CDH1.
Suppression of the miR-9 signaling pathway on HCC cell
properties
To evaluate the therapeutic potential of miR-9 in HCC
oncogenesis, we used an anti-sense miR-9 molecule
(anti-miR-9) and performed a series of experiments.
First, we found that miR-9 inhibition suppressed significantly the ability of SNU-449 cells to form colonies in
soft agar (Fig. 5a), reduced their invasiveness (Fig. 5b)
and also their ability to form liver tumor spheres
(Fig. 5c). All these data reveal the therapeutic potential
of targeting miR-9 in liver cancer. To further evaluate
these findings, we examined the effects of PPARA inhibition on liver cancer cells. We found that inhibition of PPARA expression, by an siRNA (siPPARA),
induced the ability of SNU-449 cells to form colonies
in soft agar (Fig. 5d) and increased their cellular invasiveness (Fig. 5e), suggesting that PPARA has a tumor
suppressive function in HCC.
Drakaki et al. BMC Cancer (2015) 15:542
Page 7 of 11
A
PPARA
CDH1
8376
1
7624-31
2042
1
3’UTR
3’UTR
B
C
20
10
16
SNU-449
HepG2
D
8
12
6
8
E
1327-33
4
4
2
0
0
F
G
SNU-449
HepG2
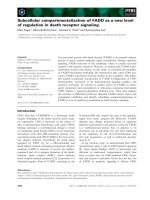
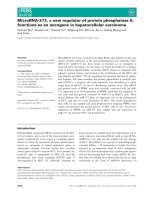
Fig. 4 CDH1 and PPARA as direct targets of miR-9 in HCC. a Sequence complementarity between miR-9 seed sequence and the 3′UTRs of PPARA and
CDH1. b CDH1 and PPARA 3′UTR luciferase assay activity in SNU-449 cells transfected with miR-Ctrl or miR-9, 48 h post-transfection. MiR-9 sequence was
wildtype or mutated (miR-9 mut). c CDH1 mRNA levels in SNU-449 and HepG2 cells transfected with miR-9 or anti-miR-9, 48 h post-transfection, assessed
by real-time RT-PCR. d Vimentin, (e) PPARA and (f) PDK4 mRNA levels in SNU-449 cells transfected with miR-9, 48 h post-transfection, assessed by real-time
PCR. g CDH1 mRNA levels in SNU-449 and HepG2 cells transfected with an siRNA against PPARA (siPPARA) or an siRNA negative control (siCtrl), 48 h
post-transfection. All data are represented as mean ± SE. ***P < 0.001, **P < 0.01, *P < 0.05
MiR-9/PPARA/CDH1 pathway expression levels in
HCC tissues
To study the human relevance of the miR-9/PPARA/CDH1
signaling pathway, we examined PPARA and CDH1 expression levels in 24 HCC and 11 control liver tissues.
Real-time PCR analysis showed that CDH1 had >40 %
down-regulation of its mRNA levels in HCC relative to
controls (Fig. 6a) and PPARA had >50 % reduced levels in
HCC relative to control tissues (Fig. 6b). Furthermore,
we performed correlation analysis, evaluating the significance of correlation between miR-9 and PPARA or CDH1
mRNA levels in HCC tissues. Consistent with our in vitro
findings, miR-9 was inversely correlated with both CDH1
(R2 = 0.5824) (Fig. 6c) and PPARA (R2 = 0.7131) (Fig. 6d)
mRNA levels in HCC tissues. Taken together, these findings reveal the human relevance of the miR-9 signaling
pathway in HCC oncogenesis.
Discussion
Different signaling pathways have been implicated in
HCC pathogenesis [19], however the role of non-coding
RNAs has not been studied extensively until recently.
Non-coding RNAs consist primarily of the microRNAs
and long non-coding RNA (lincRNAs) and several studies have implicated their role in HCC initiation and progression [6, 7, 20, 21]. Specific microRNA signatures
have been identified to be deregulated in HCC patient
tissues and also to correlate with different clinicopathological parameters [10, 22]. Furthermore, microRNAs
have been associated with hepatitis infection, cirrhosis
and patient survival [23].
In this study, we have screened the human microRNAome, aiming to identify microRNAs that are potent
regulators of HCC invasiveness. Interestingly, we found 28
microRNAs to affect significantly (>2-fold) the invasiveness
Drakaki et al. BMC Cancer (2015) 15:542
A
Page 8 of 11
C
B
anti-miR-C
D
anti-miR-9
E
siCtrl
siPPARA
Fig. 5 Effects of miR-9 inhibition on liver cancer cellular properties. a Soft-agar colony formation assay; (b) cellular invasion assay and
(c) tumor sphere formation assay in SNU-449 cells transfected with an antisense microRNA negative control (anti-miR-C) or an antisense
microRNA-9 (anti-miR-9). d Effects of PPARA inhibition by an siRNA (siPPARA) or an siRNA negative control (siCtrl) on the ability of SNU-449
cells to form colonies in soft-agar and (e) SNU-449 cell invasiveness. All data are represented as mean ± SE. ***P < 0.001, **P < 0.01
B
A
D
CDH1 mRNA levels
PPARA mRNA levels
C
miR-9 levels
miR-9 levels
Fig. 6 MiR-9 signaling pathway levels in HCC tissues. a CDH1 and (b) PPARA mRNA relative expression levels in 24 HCC tumors and 11 control
liver tissues assessed by real-time RT-PCR analysis. Gene expression levels were normalized to the levels of GAPDH and β-actin. Normalized gene
expression levels were quantified relative to the levels of a given control tissue. c Correlation analysis between miR-9 and CDH1 mRNA levels in
24 HCC tissues. d Correlation analysis between miR-9 and PPARA mRNA levels in 24 HCC tissues. Data are represented as mean ± SE. ***P < 0.001,
in comparison to control
Drakaki et al. BMC Cancer (2015) 15:542
of SNU-449 liver cancer cells. Five of these microRNAs behaved as HCC invasion inducers, while 23 microRNAs as
HCC invasion suppressors. This screen revealed novel
microRNAs potentially involved in HCC pathogenesis and
also validated findings from previous studies. Specifically,
microRNAs such as miR-21, miR-29a/b, miR-26a, miR101, miR-122a, miR-124a, miR-375 and let-7a/b have been
correlated with HCC pathogenesis through regulation of
essential signaling pathways [9, 24–30]. More recently, we
have identified that miR-24 is part of a feedback loop circuit involved in HCC pathogenesis [7]. On the other hand
the role of miR-9, miR-148b, miR-203 and miR-507 in
HCC pathobiology is not well understood. Recently, high
miR-9 expression levels were found to be correlated with
poor prognosis in HCC patients [31]. Furthermore, miR148b expression was found to be decreased in HCC patients [32], however it is not known which signaling pathways are mediators of miR-148b activity in HCC. In
addition, it has been shown that miR-203 is suppressed in
HCC tissues due to DNA methylation on its regulatory
area [33]. Finally, nothing is known regarding the role of
miR-507 in HCC pathogenesis.
Here, we provide evidence that miR-9 affects different
liver cancer cell properties, including liver tumor sphere
formation. When liver cancer cells are placed in low attachment plates or in suspension, they have the ability to form
liver tumor spheres, which potentially represent the cellular
population harboring tumor-initiating properties [34, 35].
Here, we evaluated for the first time the role of miR-9 to
affect the growth of these liver tumor spheres and identified
that miR-9 overexpression induced the formation of liver
spheres derived from SNU-449 cells, suggesting its potential involvement in early stages during HCC oncogenesis.
On the other hand, inhibition of miR-9 by an anti-sense
microRNA-9 molecule, suppressed the growth of SNU449-derived tumor spheres.
Bioinformatics and molecular analyses revealed that
miR-9 is involved in HCC pathogenesis through direct
regulation of CDH1 and PPARA genes, by binding on
their 3′UTR regions. Previous studies have shown that
reduced expression of CDH1 correlate with poor outcomes in HCC patients [36]. Consistent with our findings, Tan HX et al. showed that miR-9 was significantly
up-regulated in primary HCC tumors with metastases in
comparison with those without metastases [37]. In the
same study, CDH1 levels were found to be up-regulated
after miR-9 inhibition. Other studies have shown that
high levels of CDH1 have been correlated with suppression of liver carcinogenesis [38]. In addition, we found
that miR-9 overexpression resulted in increased vimentin levels, which is a well-known mesenchymal marker
correlated with CDH1 loss of expression in HCC [39].
More importantly, the role of PPARA in HCC pathogenesis
has not been previously described. PPARA is a transcription
Page 9 of 11
factor that has been implicated in hepatic steatosis [40] and
hepatic metabolic homeostasis through regulation of the
hepatocyte nuclear factor-4 alpha (HNF4A) gene [41].
Interestingly, we have recently found that HNF4A is a
tumor suppressor gene in HCC pathogenesis [7]. Furthermore, it has been described that there is a positive correlation between CDH1 and the PPARA signaling pathways
[17, 18]. Our analysis revealed that there is not only a positive correlation between PPARA and CDH1 mRNA levels
in HCC, but also that PPARA regulates CDH1 mRNA expression levels in HCC. This observation is very interesting
and novel, since miR-9 is using two discrete molecular
pathways to suppress CDH1 expression in HCC. First,
miR-9 directly suppresses CDH1 mRNA levels through
binding on its 3′UTR and in the second indirect mechanism miR-9 suppresses PPARA mRNA levels directly, resulting in decreased CDH1 levels. Overall, these data suggest
that microRNAs could use complementary mechanisms to
regulate a specific downstream signaling target.
Recent studies have shown that manipulation in the
expression levels of microRNAs could have therapeutic
potential in vitro and in vivo. Specifically, administration
of miR-26a or miR-124a has resulted in suppression of
liver cancer tumor growth in vivo [7, 42]. On the other
hand, miR-21 inhibition suppresses HCC growth [43].
Here, we have found that miR-9 inhibition of expression
by an antisense-miR-9 suppressed the ability of liver
cancer cells to form colonies in soft agar, tumor spheres
and decreased their invasiveness, suggesting that targeting miR-9 could be a promising strategy to be further
evaluated for the treatment of HCC.
Conclusions
Integration of high throughput microRNA library screening
and microRNA profiling in HCC tissues revealed that miR9 has both functional and clinical significance in HCC. Furthermore, we found that miR-9 exerts its oncogenic activities through direct regulation of PPARA and CDH1 genes.
In addition, we provided evidence that inhibition of miR-9
suppresses HCC cell growth and invasiveness. Taken together, our study identified a novel microRNA signaling
pathway, consisting of miR-9, PPARA and CDH1 that is
deregulated in HCC patients affecting liver cancer cellular
invasiveness.
Additional file
Additional file 1: Figure S1. Relative (A) miR-21 and (B) miR-224
expression levels in HCC tumors in different stages (I,II,III,IV) assessed
by real-time RT-PCR analysis and normalized to control liver tissues.
Data are represented as mean ± SE. ***P < 0.001, in comparison to
control. Figure S2. Effects of miR-9 overexpression on HepG2 cancer
properties. (A) Relative miR-9 expression levels in HepG2 cells after
transfection with miR control or miR-9, 48 h post-transfection. (B) Cell
growth of HepG2 liver cancer cells transfected with miR negative
Drakaki et al. BMC Cancer (2015) 15:542
control (miR-Ctrl) or miR-9, 48 h and 72 h post-transfection. (C) Invasion of
HepG2 after transfection with miR negative control (miR-Ctrl) or miR-9, 48 h
post-transfection. (D) Soft agar colony assay in HepG2 cells overexpressing
miR negative control (miR-Ctrl) or miR-9. All data are represented as mean ±
SE. ***P < 0.001, **P < 0.01. Figure S3. PPARA relative mRNA levels after CDH1
inhibition in SNU-449 cells. PPARA mRNA levels were measured by qPCR
analysis in SNU-449 cells transfected with an siRNA negative control (si-NC)
and an siRNA against CDH1 (si-CDH1), 48 h post-transfection. (PPTX 293 kb)
Competing interests
The authors declare that they have no competing interests.
Authors’ contributions
Conception and design of study: AD, DI, VG; Data acquisition, analysis and
interpretation: AD, MH, CV, CP, GAP; Writing and revising the manuscript: AD,
JS, VG; Study supervision: DI, MH. All authors have read and approved the
final manuscript.
Acknowledgements
This study was supported by the CURE: DDRC P30 DK 41301 Pilot and Feasibility
grant (AD) and start-up funds provided from the Division of Digestive Diseases at
David Geffen School of Medicine at UCLA (DI).
Author details
1
Division of Hematology/Oncology, David Geffen School of Medicine,
University of California, Los Angeles, Los Angeles, CA, USA. 2Laboratory of
Tumor Biology, Department of Medical Oncology, University Hospital of
Heraklion, Heraklion, Crete, Greece. 3Center for Systems Biomedicine, Division
of Digestive Diseases, David Geffen School of Medicine, University of
California, Los Angeles, 650 Charles E. Young Dr., CHS 44-133, Los Angeles,
CA 90095-7278, USA. 4Department of Surgery, Stanford School of Medicine,
Stanford University, Palo Alto, CA, USA.
Received: 9 February 2015 Accepted: 16 July 2015
References
1. El-Serag HB. Hepatocellular carcinoma. N Engl J Med. 2011;365(12):1118–27.
2. Jemal A, Bray F, Center MM, Ferlay J, Ward E, Forman D. Global cancer
statistics. CA Cancer J Clin. 2011;61(2):69–90.
3. Bosch FX, Ribes J, Borras J. Epidemiology of primary liver cancer. Semin
Liver Dis. 1999;19(3):271–85.
4. Villanueva A, Newell P, Chiang DY, Friedman SL, Llovet JM. Genomics and
signaling pathways in hepatocellular carcinoma. Semin Liver Dis.
2007;27(1):55–76.
5. Bartel DP. MicroRNAs: target recognition and regulatory functions. Cell.
2009;136(2):215–33.
6. Drakaki A, Hatziapostolou M, Iliopoulos D. Therapeutically targeting
microRNAs in liver cancer. Curr Pharm Des. 2013;19(7):1180–91.
7. Hatziapostolou M, Polytarchou C, Aggelidou E, Drakaki A, Poultsides GA,
Jaeger SA, et al. An HNF4alpha-miRNA inflammatory feedback circuit
regulates hepatocellular oncogenesis. Cell. 2011;147(6):1233–47.
8. Gramantieri L, Ferracin M, Fornari F, Veronese A, Sabbioni S, Liu CG, et al.
Cyclin G1 is a target of miR-122a, a microRNA frequently down-regulated in
human hepatocellular carcinoma. Cancer Res. 2007;67(13):6092–9.
9. Meng F, Henson R, Wehbe-Janek H, Ghoshal K, Jacob ST, Patel T. MicroRNA-21
regulates expression of the PTEN tumor suppressor gene in human
hepatocellular cancer. Gastroenterology. 2007;133(2):647–58.
10. Budhu A, Jia HL, Forgues M, Liu CG, Goldstein D, Lam A, et al. Identification
of metastasis-related microRNAs in hepatocellular carcinoma. Hepatology.
2008;47(3):897–907.
11. Xu Y, Liu L, Liu J, Zhang Y, Zhu J, Chen J, et al. A potentially functional
polymorphism in the promoter region of miR-34b/c is associated with
an increased risk for primary hepatocellular carcinoma. Int J Canc.
2011;128(2):412–7.
12. Li LM, Hu ZB, Zhou ZX, Chen X, Liu FY, Zhang JF, et al. Serum microRNA
profiles serve as novel biomarkers for HBV infection and diagnosis of
HBV-positive hepatocarcinoma. Cancer Res. 2010;70(23):9798–807.
Page 10 of 11
13. Overduin M, Harvey TS, Bagby S, Tong KI, Yau P, Takeichi M, et al. Solution
structure of the epithelial cadherin domain responsible for selective cell
adhesion. Science. 1995;267(5196):386–9.
14. Geisler N, Plessmann U, Weber K. Amino acid sequence
characterization of mammalian vimentin, the mesenchymal
intermediate filament protein. FEBS Lett. 1983;163(1):22–4.
15. Kim S, Kiyosawa N, Burgoon LD, Chang CC, Zacharewski TR.
PPARalpha-mediated responses in human adult liver stem cells: In
vivo/in vitro and cross-species comparisons. J Steroid Biochem Mol
Biol. 2013;138:236–47.
16. Schafer HL, Linz W, Falk E, Glien M, Glombik H, Korn M, et al. AVE8134, a
novel potent PPARalpha agonist, improves lipid profile and glucose
metabolism in dyslipidemic mice and type 2 diabetic rats. Acta Pharmacol
Sin. 2012;33(1):82–90.
17. Lee HJ, Su Y, Yin PH, Lee HC, Chi CW. PPAR(gamma)/PGC-1(alpha) pathway
in E-cadherin expression and motility of HepG2 cells. Anticancer Res.
2009;29(12):5057–63.
18. Tsang H, Cheung TY, Kodithuwakku SP, Chai J, Yeung WS, Wong CK, et al.
Perfluorooctanoate suppresses spheroid attachment on endometrial
epithelial cells through peroxisome proliferator-activated receptor alpha
and down-regulation of Wnt signaling. Reprod Toxicol. 2013;42:164–71.
19. Moeini A, Cornella H, Villanueva A. Emerging signaling pathways in
hepatocellular carcinoma. Liver Cancer. 2012;1(2):83–93.
20. He G, Dhar D, Nakagawa H, Font-Burgada J, Ogata H, Jiang Y, et al.
Identification of liver cancer progenitors whose malignant progression
depends on autocrine IL-6 signaling. Cell. 2013;155(2):384–96.
21. Cao C, Sun J, Zhang D, Guo X, Xie L, Li X, et al. The Long Intergenic
Noncoding RNA UFC1, A Target of MicroRNA 34a, Interacts With the mRNA
Stabilizing Protein HuR to Increase Levels of beta-Catenin in HCC Cells.
Gastroenterology. 2015;148:415–26.
22. Toffanin S, Hoshida Y, Lachenmayer A, Villanueva A, Cabellos L, Minguez B,
et al. MicroRNA-based classification of hepatocellular carcinoma and
oncogenic role of miR-517a. Gastroenterology. 2011;140(5):1618–28. e1616.
23. Jiang J, Gusev Y, Aderca I, Mettler TA, Nagorney DM, Brackett DJ, et al.
Association of MicroRNA expression in hepatocellular carcinomas with hepatitis
infection, cirrhosis, and patient survival. Clinical Canc Res. 2008;14(2):419–27.
24. Xiong Y, Fang JH, Yun JP, Yang J, Zhang Y, Jia WH, et al. Effects of
microRNA-29 on apoptosis, tumorigenicity, and prognosis of hepatocellular
carcinoma. Hepatology. 2010;51(3):836–45.
25. Zhu Y, Lu Y, Zhang Q, Liu JJ, Li TJ, Yang JR, et al. MicroRNA-26a/b and their
host genes cooperate to inhibit the G1/S transition by activating the pRb
protein. Nucleic Acids Res. 2012;40(10):4615–25.
26. Su H, Yang JR, Xu T, Huang J, Xu L, Yuan Y, et al. MicroRNA-101, down-regulated
in hepatocellular carcinoma, promotes apoptosis and suppresses tumorigenicity.
Cancer Res. 2009;69(3):1135–42.
27. Tsai WC, Hsu SD, Hsu CS, Lai TC, Chen SJ, Shen R, et al. MicroRNA-122 plays
a critical role in liver homeostasis and hepatocarcinogenesis. J Clin Invest.
2012;122(8):2884–97.
28. Zheng F, Liao YJ, Cai MY, Liu YH, Liu TH, Chen SP, et al. The putative
tumour suppressor microRNA-124 modulates hepatocellular carcinoma cell
aggressiveness by repressing ROCK2 and EZH2. Gut. 2012;61(2):278–89.
29. He XX, Chang Y, Meng FY, Wang MY, Xie QH, Tang F, et al. MicroRNA-375
targets AEG-1 in hepatocellular carcinoma and suppresses liver cancer
cell growth in vitro and in vivo. Oncogene. 2012;31(28):3357–69.
30. Wang YC, Chen YL, Yuan RH, Pan HW, Yang WC, Hsu HC, et al. Lin-28B
expression promotes transformation and invasion in human
hepatocellular carcinoma. Carcinogenesis. 2010;31(9):1516–22.
31. Cai L, Cai X. Up-regulation of miR-9 expression predicate advanced
clinicopathological features and poor prognosis in patients with
hepatocellular carcinoma. Diagn Pathol. 2014;9(1):1000.
32. Zhang Z, Zheng W, Hai J. MicroRNA-148b expression is decreased in
hepatocellular carcinoma and associated with prognosis. Med Oncol.
2014;31(6):984.
33. Furuta M, Kozaki KI, Tanaka S, Arii S, Imoto I, Inazawa J. miR-124 and
miR-203 are epigenetically silenced tumor-suppressive microRNAs in
hepatocellular carcinoma. Carcinogenesis. 2010;31(5):766–76.
34. Kamohara Y, Haraguchi N, Mimori K, Tanaka F, Inoue H, Mori M, et al. The search
for cancer stem cells in hepatocellular carcinoma. Surgery. 2008;144(2):119–24.
35. Cao L, Zhou Y, Zhai B, Liao J, Xu W, Zhang R, et al. Sphere-forming cell
subpopulations with cancer stem cell properties in human hepatoma cell
lines. BMC Gastroenterol. 2011;11:71.
Drakaki et al. BMC Cancer (2015) 15:542
Page 11 of 11
36. Liu YA, Liang BY, Guan Y, You J, Zhu L, Chen XP, et al. Loss of N-cadherin is
associated with loss of E-cadherin expression and poor outcomes of liver
resection in hepatocellular carcinoma. J Surg Res. 2015;194:167–76.
37. Tan HX, Wang Q, Chen LZ, Huang XH, Chen JS, Fu XH, et al. MicroRNA-9
reduces cell invasion and E-cadherin secretion in SK-Hep-1 cell. Med Oncol.
2010;27(3):654–60.
38. Schneider MR, Hiltwein F, Grill J, Blum H, Krebs S, Klanner A, et al. Evidence
for a role of E-cadherin in suppressing liver carcinogenesis in mice and
men. Carcinogenesis. 2014;35(8):1855–62.
39. Zhai X, Zhu H, Wang W, Zhang S, Zhang Y, Mao G. Abnormal expression of
EMT-related proteins, S100A4, vimentin and E-cadherin, is correlated with
clinicopathological features and prognosis in HCC. Med Oncol.
2014;31(6):970.
40. Li B, Zhang Z, Zhang H, Quan K, Lu Y, Cai D, et al. Aberrant miR199a-5p/
caveolin1/PPARalpha axis in hepatic steatosis. J Mol Endocrinol.
2014;53(3):393–403.
41. Contreras AV, Rangel-Escareno C, Torres N, Aleman-Escondrillas G, Ortiz V,
Noriega LG, et al. PPARalpha via HNF4alpha regulates the expression of
genes encoding hepatic amino acid catabolizing enzymes to maintain
metabolic homeostasis. Genes and Nutrition. 2015;10(2):452.
42. Kota J, Chivukula RR, O’Donnell KA, Wentzel EA, Montgomery CL, Hwang
HW, et al. Therapeutic microRNA delivery suppresses tumorigenesis in a
murine liver cancer model. Cell. 2009;137(6):1005–17.
43. Xu G, Zhang Y, Wei J, Jia W, Ge Z, Zhang Z, et al. MicroRNA-21 promotes
hepatocellular carcinoma HepG2 cell proliferation through repression of
mitogen-activated protein kinase-kinase 3. BMC Cancer. 2013;13:469.
Submit your next manuscript to BioMed Central
and take full advantage of:
• Convenient online submission
• Thorough peer review
• No space constraints or color figure charges
• Immediate publication on acceptance
• Inclusion in PubMed, CAS, Scopus and Google Scholar
• Research which is freely available for redistribution
Submit your manuscript at
www.biomedcentral.com/submit