Pentaho Reporting 3.5 for Java Developers- P3
Bạn đang xem bản rút gọn của tài liệu. Xem và tải ngay bản đầy đủ của tài liệu tại đây (912.58 KB, 50 trang )
Chapter 3
[
83
]
Dening the Details band
The Details band of the invoice report should contain the columns ITEMNAME,
QUANTITY, and SALEPRICE. It should also contain a report function of the type
Open Formula
titled TotalItemPrice, with the formula:
=[QUANTITY] * [SALEPRICE]
In addition to the data elds, you'll also include a rectangular background that
lls the entire height of the Details band. You'll do some row banding with this
rectangle, so make sure to give it a name such as
detailsRect.
Now, set the visible style formula of the rectangle to the following:
=IF(ISEVEN(ROWCOUNT()); TRUE(); FALSE())
For every other row, the rectangle will hide itself, allowing the rows of your
invoice items to be clearly banded together.
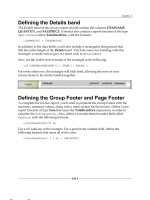
Dening the Group Footer and Page Footer
To complete the invoice report, you'll need to populate the Group Footer with the
necessary summary values, along with a notes section for the invoice. Dene a new
report function of type Sum that sums the TotalItemPrice expression, in order to
calculate the
PurchaseTotal
. Also, dene a formula-based number eld called
TaxTotal
with the following formula:
=[PurchaseTotal]*0.06
Use a 6% sales tax in the example. For a grand total number eld, dene the
following formula that sums all of the costs:
=[PurchaseTotal] * 1.06 + [SHIPCOST]
This material is copyright and is licensed for the sole use by David Martone on 16th September 2009
710 South Avenue West, , Westfield, , 07090Please purchase PDF Split-Merge on www.verypdf.com to remove this watermark.
Pentaho Reporting Examples in the Real World
[
84
]
In addition to displaying the summarized invoice costs, also add the NOTES eld
to your report. Text elds have the ability to wrap multiple lines, if necessary.
Resize the eld to ll in the left portion of the Group Footer as shown in the
following screenshot:
As a nal touch to the Group Footer, add a friendly message such as Thank you
for shopping at ElectroBarn!, which will encourage your customers to continue
shopping at ElectroBarn. The very last step in completing the report is to add a page
count in the Page Footer band, as well as to force page breaks after each Group
Footer. To make this report burstable, you'll want to reset the page counter at the
end of every invoice and begin each invoice at the top of a page. You can do this by
selecting the pagebreak-after style property in the group footer, which forces a new
page below the group footer. Also, you need to set the group property of the
Page
Of Pages Function
to the invoice group. You've now completed the design of the
report. Save the report as
chapter3\data\invoices.prpt
.
Incorporating the invoice report into your
J2EE environment
You're now ready to update your J2EE environment, in order to render the invoices
report. There are no changes required to the servlet, but you will need to update the
home page of the web application. Add a link to the report, in the HTML of your
chapter3 home page,
index.html
.
<a href="report?outputFormat=pdf&reportName=invoices">Invoice Burst
Report</a>
This material is copyright and is licensed for the sole use by David Martone on 16th September 2009
710 South Avenue West, , Westfield, , 07090Please purchase PDF Split-Merge on www.verypdf.com to remove this watermark.
Chapter 3
[
85
]
You're now ready to run the Ant script and deploy the modied web
application. Type the
ant restart_tomca
t command to build the new war.
Visit
http://localhost:8080/chapter3
and click the Burst Report link.
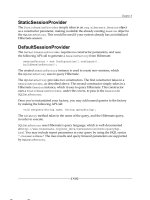
The nal result should look something like this:
This report could be sent directly to a printer to generate all the invoices for a day.
Or you could parameterize the report down to an individual invoice, allowing
customers to access their invoices online. Another option for bursting might include
generating individual PDFs per invoice, and either mailing them out or sending
them to another system to process.
In this example, you learned how to add a sub-report to a main report, along with
learning additional functions and styles, including row banding, URL display, and
page breaking.
This material is copyright and is licensed for the sole use by David Martone on 16th September 2009
710 South Avenue West, , Westfield, , 07090Please purchase PDF Split-Merge on www.verypdf.com to remove this watermark.
Pentaho Reporting Examples in the Real World
[
86
]
Summary
In this chapter, you built three real world reports, learning the breadth of
functionality provided by Pentaho Reporting. In the rst example, you learned how
to work with SQL data sources, dene charts, and how to use formulas and functions
in an inventory report. In the second example, you dened a parameterized cashier
balance report with dynamically driven styles, including adding trafc lighting to
the report. In the third example, you incorporated inline sub-reports into an invoice
report, along with adding hyperlinks and row banding to the report. You embedded
these reports in a J2EE environment, which involved adding JAR dependencies for
charting and updating your servlet to support parameterization.
Now that you've experienced Pentaho Reporting in the real world, it's time to dive
deeper into each subject area, allowing you to gain the expertise to build advanced
reports with Pentaho Reporting.
This material is copyright and is licensed for the sole use by David Martone on 16th September 2009
710 South Avenue West, , Westfield, , 07090Please purchase PDF Split-Merge on www.verypdf.com to remove this watermark.
Design and Layout in
Pentaho's Report Designer
In this chapter, you'll dive deep into the concepts and functionality of Pentaho's
Report Designer, related to the design and layout of a report. The Report Designer
is designed for business users who want to design reports in a what-you-see-is-what
-you-get (WYSIWYG) drag-and-drop client environment.
You'll rst learn about the Report Designer's user interface, highlighting the
different components that work together to build a report. You'll then learn more
about the core layout bands presented in the Report Designer, including detail and
group bands. From there, you'll explore in detail the various elements available to
designers, how they are used, and what they might be used for.
You'll also learn the ins and outs of visual layout within the reporting canvas,
including advanced concepts such as grids and guides. You'll close the chapter
with more details when working with fonts, along with considerations for dealing
with the various output formats supported by Pentaho Reporting.
Report Designer user interface
components
After launching the Report Designer, you'll notice the following six main user
interface components that work together to create a report, from the top left to
the bottom right of the main Report Designer window:
• The menu and toolbar
• The report element palette, where you can select report elements
for your report
• The report canvas tab panel, which displays your reports
This material is copyright and is licensed for the sole use by David Martone on 16th September 2009
710 South Avenue West, , Westfield, , 07090Please purchase PDF Split-Merge on www.verypdf.com to remove this watermark.
Design and Layout in Pentaho’s Report Designer
[
88
]
• The Report Explorer panel with Structure and Data tabs, which displays
the entire report in object tree form
• The Element Properties panel, which displays all the Styles and Attributes
associated with the currently selected report element
• The Messages panel, which displays warnings and errors related to the
currently opened report
Menu and toolbar
The menu and toolbar contain useful functionality to make building a report easier,
along with basic functionality such as saving, opening, and publishing of reports.
Many of the options in the menu and toolbar are available as shortcut keys.
This material is copyright and is licensed for the sole use by David Martone on 16th September 2009
710 South Avenue West, , Westfield, , 07090Please purchase PDF Split-Merge on www.verypdf.com to remove this watermark.
Chapter 4
[
89
]
Report element palette
The report element palette panel is located on the left side of the Report Designer
and contains an icon list of the types of elements that can be placed on the report,
including labels, shapes, elds, charts, and more. To add an element to your report,
drag-and-drop an element from the palette into the report canvas.
Report canvas tab panel
The report canvas tab panel is located in the center of the Report Designer.
Once you've created a new report or opened an existing one, this is where you
drag-and-drop report elements to build your report. In design mode, the canvas
displays the currently visible report bands. The canvas offers many visual features
that allow you to manage the alignment and sizing of your report elements.
In addition to the design canvas, you can also preview the current report. You
can quickly toggle between live data and the report template in this fashion.
Report Explorer
The Report Explorer, located on the right side of the Report Designer, includes
a Structure tab panel. The Structure tab panel contains the tree structure of a
report, including all the report bands. The Data tab panel contains all the data
sources, functions, and parameters of a report. Right-clicking on various portions
of the structure and data trees presents options such as adding new data sources
and sub-groups. The Report Explorer may be hidden through the Window
application menu.
Element Properties
The Element Properties panel is located below the report explorer panel, on the right
side of the Report Designer, and displays the details of the currently selected item in
the report explorer or canvas. All styles and attributes, which are editable, appear in
this panel. Many editable properties provide additional dialogs for advanced editing
capabilities. The Element Properties panel may be hidden through the Window
application menu.
This material is copyright and is licensed for the sole use by David Martone on 16th September 2009
710 South Avenue West, , Westfield, , 07090Please purchase PDF Split-Merge on www.verypdf.com to remove this watermark.
Design and Layout in Pentaho’s Report Designer
[
90
]
Messages
The Messages panel is located at the bottom of the Report Designer and displays
any active warnings or errors that are present in the report. Selecting a message will
automatically select the element and property in question, making it easy to track
down issues in your report. The Message panel is hidden by default, and can be
made viewable through the Window application menu.
Report bands
When rst creating a report in your canvas and report explorer structure tree, you
will see a Page Header, Report Header, Details band, Report Footer, and a Page
Footer band appear as part of the report. These bands, along with other bands,
including Group, Watermark, and No Data bands that you may dene, make up
the entire visual report. All bands may contain elements from the palette, and act as
containers for rendering these elements. Each band has a different life cycle, and is
rendered based on their context. In this section, you'll go over each band's properties,
along with the context in which each band renders itself.
Common properties
All bands share a common set of properties, which are explained using tables in the
forthcoming sub-sections. Certain properties may offer a dialog for editing, which is
displayed in the list as well.
Size and position properties
These properties dene the size and position for the band. These properties may be
edited together by selecting the band in the structure tree and then clicking on the
Format | Size & Border… menu item, or individually within the Report Element
Styles tab.
This material is copyright and is licensed for the sole use by David Martone on 16th September 2009
710 South Avenue West, , Westfield, , 07090Please purchase PDF Split-Merge on www.verypdf.com to remove this watermark.
Chapter 4
[
91
]
The following table lists the size and position properties:
Property name Description
layout
Denes how elements within the band are rendered.
• The default layout is canvas, which allows you to
specify exactly where each report element in the band
should render.
• The block layout stacks all the items in a band from
top to bottom.
• The inline layout stacks all the items left to right, with
wrapping.
• The row layout displays all the report elements in a
single row.
height
The height of this element. A number between -100 and 0
represents a percentage of the parent container's height.
width
The width of this element. A number between -100 and 0
represents a percentage of the parent container's width.
x
The x location of this element within its parent container.
y
The y location of this element within its parent container.
visible
If set to false, the element is not rendered.
invisible-cosumes-space
If set to true, children of this band that are invisible will still
consume space in the report.
dynamic-height
If set to true, informs the reporting engine that this element has
a dynamic height.
This material is copyright and is licensed for the sole use by David Martone on 16th September 2009
710 South Avenue West, , Westfield, , 07090Please purchase PDF Split-Merge on www.verypdf.com to remove this watermark.
Design and Layout in Pentaho’s Report Designer
[
92
]
Property name Description
preferred-height
The preferred height of this element.
preferred -width
The preferred width of this element.
max-height
The maximum height of this element.
max-width
The maximum width of this element.
x-overow
If set to true, text may overow horizontally outside of the
element.
y-overow
If set to true, text may overow vertically outside of this
element.
xed-position
If specied, sets the xed vertical position of this band within
a report.
box-sizing
This is either set to content-box or border-box. If set to
content-box, the sizing styles do not include the border, and
if set to border-box, the sizing styles do include the border box.
The default value of this style is content-box.
Padding and border properties
These properties dene the padding and border denition for the band. Border
information includes thickness, line type, and color. These properties may be edited
together by selecting the band and then clicking on the Format | Size & Border…
menu item, or individually within the Report Element Styles tab.
This material is copyright and is licensed for the sole use by David Martone on 16th September 2009
710 South Avenue West, , Westfield, , 07090Please purchase PDF Split-Merge on www.verypdf.com to remove this watermark.
Chapter 4
[
93
]
Padding Styles
Property name Description
top
The height of the padding on the top of an element.
bottom
The height of the padding on the bottom of an element.
left
The width of the padding on the left of an element.
right
The width of the padding on the right of an element.
Border Styles
Property name Description
top-style
The style of the top border.
top-size
The width of the top border.
top-color
The color of the top border
top-left-height
The height of the top left corner's radius.
top-left-width
The width of the top left corner's radius.
top-right-height
The height of the top right corner's radius.
top-right-width
The width of the top right corner's radius.
bottom-size
The width of the bottom border.
bottom-style
The style of the bottom border. Style values include none,
hidden, dotted, dashed, solid, double dot-dash, dot-dot-dash,
wave, groove, ridge, inset, and outset.
bottom-color
The color of the bottom border. Colors can be represented
as strings using the same syntax as HTML colors, #RRGGBB
hex values.
bottom-left-height
The height of the bottom left corner's radius.
bottom-left-width
The width of the bottom left corner's radius.
bottom-right-height
The height of the bottom right corner's radius.
bottom-right-width
The width of the bottom right corner's radius.
left-color
The color of the left border.
left-size
The width of the left border.
right-size
The width of the right border.
right-style
The style of the right border.
break-color
If the element is split, this is the color of the border where
the break occurred.
break-size
If the element is split, this is the width of the border where
the break occurred.
break-style
If the element is split, this is the style of the border where
the break occurred.
This material is copyright and is licensed for the sole use by David Martone on 16th September 2009
710 South Avenue West, , Westfield, , 07090Please purchase PDF Split-Merge on www.verypdf.com to remove this watermark.
Design and Layout in Pentaho’s Report Designer
[
94
]
Page behavior properties
Page behavior properties impact how bands are rendered relative to individual pages.
Property name Description
pagebreak-before
Places a page break before rendering the band.
pagebreak-after
Places a page break after rendering the band.
avoid-page-break
Forces the band to skip to the next page instead of a split
rendering.
orphans
The number of contiguous bands to group before a page break
occurs.
widows
The number of contiguous bands to group after a page break
occurs.
Foreground and background color properties
Bands have default foreground and background colors. These colors appear within
the Styles tab as text-color and bg-color.
Excel properties
Report bands dene specic properties related to Excel.
Property name Description
sheet name
The name of the sheet to render the band.
format-override
The Excel cell data format string.
formula-override
The Excel cell data formula string.
wrap-text-override
If true, wraps a text-based report element text within an Excel
Cell. This value is inherited by text-based report elements
within the band.
This material is copyright and is licensed for the sole use by David Martone on 16th September 2009
710 South Avenue West, , Westfield, , 07090Please purchase PDF Split-Merge on www.verypdf.com to remove this watermark.
Chapter 4
[
95
]
Attribute properties
The following common attribute property is shared by all bands:
Property name Description
hide-on-canvas
If checked, the band will not appear in the canvas, otherwise it
will appear. This property does not impact whether a band is
rendered or not during report generation. It is strictly a design
time property.
Style inheritance
Additional styles are available for each band, which are inherited by the report
elements within the band. Report elements inherit the style properties of their
parent band.
Page Header and Page Footer
The Page Header and Page Footer bands appear at the beginning and end of each
page, determined by the specic output format.
These bands differ slightly from the common properties dened earlier. The
pagebreak-before and pagebreak-after properties do not apply to these bands.
Also, the following properties are available in addition to the defaults:
Property name Description
display-on-rstpage
The default value is true for this property. If set to false, the rst
page will not contain this band.
display-on-lastpage
The default value is true for this property. If set to false, the last
page will not contain this band.
sticky
If the Page Header or Footer is dened as sticky, they will
be printed on each page as if they were part of a sub-report
denition being rendered.
Report Header and Report Footer
The Report Header and Report Footer appear at the beginning and end of a
report, and are often used to display the title and summary information. The Report
Header and Footer do not dene any additional properties beyond the common set
of properties.
This material is copyright and is licensed for the sole use by David Martone on 16th September 2009
710 South Avenue West, , Westfield, , 07090Please purchase PDF Split-Merge on www.verypdf.com to remove this watermark.
Design and Layout in Pentaho’s Report Designer
[
96
]
Group Header and Group Footer
The Group Header and Group Footer bands may appear for each dened group
congured as part of the report. A grouping dened in a report is a set of identical
values in one or more selected data columns. A new group is triggered when the
values change in the dened group column(s). It's critical that columns dened as
groupings are sorted appropriately before being passed into Pentaho Reporting,
otherwise, duplicate groups may appear in the rendered report.
The Group Header and Footer differ slightly from the common properties
dened earlier.
Property name Description
sticky
If the group header or footer is dened as sticky, they will
be printed on each page as if they were part of a sub-report
denition being rendered.
repeat-header
The band will be displayed at the beginning of new pages,
in addition to its default rendering.
Details Body
The Details Body consists of four distinct bands. The Details Header and Details
Footer band are rendered before and after a grouping of detail rows. A Details
band is rendered for every row of data, and a No Data band is rendered when no
data is available for the report. The Details Header, Details Footer, and No Data
bands are hidden in the Report Designer by default. The Detail Header and Footer
bands share the same additional properties, sticky and repeat-header, as the group
bands. The rest of the detail bands dene no additional properties beyond the
common set of properties.
Watermark
The Watermark band appears behind all the other bands, and is used for background
images and styling of the report. The Watermark band denes no additional
properties beyond the common set of properties.
Report elements
All available report elements appear in the palette, and may be dragged and dropped
into the report canvas. Report elements make up the content of your report. They
range from the label and text elements to graphic, chart, and sub-report elements.
This material is copyright and is licensed for the sole use by David Martone on 16th September 2009
710 South Avenue West, , Westfield, , 07090Please purchase PDF Split-Merge on www.verypdf.com to remove this watermark.
Chapter 4
[
97
]
Common properties
Most report elements inherit from a common set of properties, which are listed in the
following table:
Property name Description
name
The unique name of the element within the report. This
property is not commonly edited.
Size and Position
Properties
The X and Y location of the element, in relation to its parent
band. These properties appear in the style attributes list as x
and y.
Padding and Border
Properties
The padding and border denition of an element. Border
information includes thickness, line type, and color. These
properties may be edited together by selecting the band and
then clicking on the Format | Size & Border… menu item,
or individually within the Report Element Styles tab. Report
Elements share the same individual padding and border
properties as report bands dened above.
Additional properties shared by report elements, including HTML and Event
properties, are dened in Chapter 9.
Common text properties
These are the list of common text properties shared by text elements, including
the label, text-eld, message, number-eld, date-eld, resource-eld, and
resource-message. One special consideration is that it is possible to morph one type
of text eld into another by using the menu option Format | Morph. For example,
you could convert a text-eld into a number-eld by simply morphing the eld.
This material is copyright and is licensed for the sole use by David Martone on 16th September 2009
710 South Avenue West, , Westfield, , 07090Please purchase PDF Split-Merge on www.verypdf.com to remove this watermark.
Design and Layout in Pentaho’s Report Designer
[
98
]
Font style properties
Font properties of a report element may be edited as a group by selecting Format |
Font…, or edited individually within the Element Properties Style tab. They may
also be edited using the canvas toolbar.
Individual font styles are dened later in the Working with fonts section.
Text style properties
The following properties impact the appearance of text within report elements:
Property name Description
h-align
The horizontal alignment of the text within the element. This
property is also editable in the main toolbar.
v-align
The vertical alignment of the text within the element. This
property is also editable in the main toolbar.
v-align-in-band
Species the vertical alignment of text. Appropriate values
include use-script, baseline, sub, super, top, text-top, central,
middle, bottom, and text-bottom.
text-wrap
Species if the text should wrap. Appropriate values include
none and wrap.
text-color
The foreground font color. This property is also editable in the
main toolbar.
bg-color
The background color of the text element.
line-height
The value of the font's line height within the text element.
This material is copyright and is licensed for the sole use by David Martone on 16th September 2009
710 South Avenue West, , Westfield, , 07090Please purchase PDF Split-Merge on www.verypdf.com to remove this watermark.
Chapter 4
[
99
]
Property name Description
overow-text
This is normally set to "..", and is the text that is appended to
the string if it appears longer than the available space to render.
This appears as overow-text in the styles list.
trim
If trim is set to true, any leading or trailing whitespace is
removed.
trim-whitespace
trim-whitespace denes the following different trim modes:
• The preserve option makes no changes
to whitespace.
• The preserve-breaks option trims all whitespace
between words, and at the beginning and ending of
new lines, but does not remove any new lines.
• The collapse option trims all whitespaces down to
single spaces, including new lines.
• The discard option removes all whitespaces from the
text element.
encoding
If set, this overrides the default PDF Font character encoding.
rich-text-type
The type of text to render in the report. This attribute defaults
to text/plain, but also may be set to text/html and text/rtf. If
text/html is specied, html formatting elements are rendered
within the text report element, the same concept applies for the
text/rtf format. This attribute is located in the common group
within the Attributes tab.
Text spacing properties
Text spacing properties dene how characters are rendered in text elements.
Property name Description
character
Species the minimum character spacing when rendering
justied text.
word
Species additional padding between words when rendering.
preferred-character
Species the preferred character spacing when rendering
justied text.
character-spacing
Species the maximum character spacing when rendering
justied text.
This material is copyright and is licensed for the sole use by David Martone on 16th September 2009
710 South Avenue West, , Westfield, , 07090Please purchase PDF Split-Merge on www.verypdf.com to remove this watermark.
Design and Layout in Pentaho’s Report Designer
[
100
]
Link properties
Report elements may specify link properties, allowing links to appear in a report.
Property name Description
html-anchor
The name of the anchor tag in HTML.
url
The url of the link.
url-tooltip
The tooltip of the link.
url-window-title
The window title of the link.
Excel properties
Report elements may customize specic style properties related to Excel. Report
elements share the properties format-override, formula-override, and wrap-text-
override, dened earlier in the common properties section of report bands.
label
The label element allows you to specify static text within your report. Label
utilizes the following property:
Property name Description
value
The text to render the report.
text-eld
The text-eld element allows you to render a eld as text within your report.
The text-eld utilizes the following properties.
Property name Description
eld
The source eld to render within the text eld.
if-null
The string to display if the source eld value is null.
message
The message element enables eld values to be included in larger messages,
along with combining multiple elds into a single text element. The message element
references the data source within the format string, by specifying "$(Field Name)" for
the elds to render. The message element utilizes the following properties:
This material is copyright and is licensed for the sole use by David Martone on 16th September 2009
710 South Avenue West, , Westfield, , 07090Please purchase PDF Split-Merge on www.verypdf.com to remove this watermark.
Chapter 4
[
101
]
Property name Description
value
The value attribute represents the format of the string.
An example might be "Field: $(Field)".
if-null
The string to display if the message eld value is null.
number-eld
The number-eld element is similar to the text-eld, with an additional
ability to format a number based on a format string. The number-eld utilizes
the following properties:
Property name Description
format
This eld represents the format of the number, using
Java's DecimalFormat denition. An example might
be "#,##0.###".
eld
The source eld to render within the number eld.
if-null
The string to display if the source eld value is null.
date-eld
The date-eld element is similar to the text-eld, with the additional ability to
format a date based on a format string. The date-eld utilizes the following properties:
Property name Description
format
This eld represents the format of the date. An example might
be mm-dd-yyyy.
eld
The source eld to render within the date eld.
if-null
The string to display if the source eld value is null.
This material is copyright and is licensed for the sole use by David Martone on 16th September 2009
710 South Avenue West, , Westfield, , 07090Please purchase PDF Split-Merge on www.verypdf.com to remove this watermark.
Design and Layout in Pentaho’s Report Designer
[
102
]
resource-label
The resource-label element is similar to the label element, except that it
loads its text from an internationalized resource le. The resource-label utilizes
the following properties:
Property name Description
resource-identier
The primary name of the resource le. For example, if
the default localized resource le is named myreport.
properties, this value should be set to myreport. Also note,
the report's resources path must be congured to point to the
directory where the localized resource les exist.
value
The key name (located in the resource le) of the resource to
render.
resource-message
The resource-message element is similar to the message eld, except that
it loads its format key from a resource le. The resource-message element utilizes
the following properties:
Property name Description
resource-identier
The primary name of the resource le.
resource-value
The key name of the resource message to render.
if-null
The string to display if the resource format key message eld's
value is null.
resource-eld
The resource-eld element is similar to the resource-label, except that it
determines the resource key using the eld name provided by the data source.
The resource-eld utilizes the following properties:
Property name Description
resource-identier
The primary name of the resource le.
eld
The name of the eld to render as text within the resource le.
if-null
The string to display if the resource eld value is null.
The following elements do not include the common text properties, and are not
considered text elements.
This material is copyright and is licensed for the sole use by David Martone on 16th September 2009
710 South Avenue West, , Westfield, , 07090Please purchase PDF Split-Merge on www.verypdf.com to remove this watermark.