Wilms’ tumor gene 1 regulates p63 and promotes cell proliferation in squamous cell carcinoma of the head and neck
Bạn đang xem bản rút gọn của tài liệu. Xem và tải ngay bản đầy đủ của tài liệu tại đây (1.31 MB, 12 trang )
Li et al. BMC Cancer (2015) 15:342
DOI 10.1186/s12885-015-1356-0
RESEARCH ARTICLE
Open Access
Wilms’ tumor gene 1 regulates p63 and promotes
cell proliferation in squamous cell carcinoma of
the head and neck
Xingru Li1, Sofia Ottosson1, Sihan Wang1, Emma Jernberg2, Linda Boldrup2, Xiaolian Gu2, Karin Nylander2
and Aihong Li1*
Abstract
Background: Wilms’ tumor gene 1 (WT1) can act as a suppressor or activator of tumourigenesis in different types
of human malignancies. The role of WT1 in squamous cell carcinoma of the head and neck (SCCHN) is not clear.
Overexpression of WT1 has been reported in SCCHN, suggesting a possible oncogenic role for WT1. In the present
study we aimed at investigating the function of WT1 and its previously identified protein partners p63 and p53 in
the SCCHN cell line FaDu.
Methods: Silencing RNA (siRNA) technology was applied to knockdown of WT1, p63 and p53 in FaDu cells. Cell
proliferation was detected using MTT assay. Chromatin immunoprecipitation (ChIP)/PCR analysis was performed to confirm
the effect of WT1 on the p63 promoter. Protein co-immunoprecipitation (co-IP) was used to find protein interaction
between WT1 and p53/p63. Microarray analysis was used to identify changes of gene expression in response to knockdown
of either WT1 or p63. WT1 RNA level was detected using real-time quantitative PCR (RT-qPCR) in patients with SCCHN.
Results: We found that WT1 and p63 promoted cell proliferation, while mutant p53 (R248L) possessed the ability to
suppress cell proliferation. We reported a novel positive correlation between WT1 and p63 expression. Subsequently, p63
was identified as a WT1 target gene. Furthermore, expression of 18 genes involved in cell proliferation, cell cycle regulation
and DNA replication was significantly altered by downregulation of WT1 and p63 expression. Several known WT1 and p63
target genes were affected by WT1 knockdown. Protein interaction was demonstrated between WT1 and p53 but not
between WT1 and p63. Additionally, high WT1 mRNA levels were detected in SCCHN patient samples.
Conclusions: Our findings suggest that WT1 and p63 act as oncogenes in SCCHN, affecting multiple genes involved in
cancer cell growth.
Keywords: WT1, p63, p53, Cell proliferation, Squamous cell carcinoma of the head and neck (SCCHN)
Background
Squamous cell carcinoma of the head and neck (SCCHN)
is the sixth most common cancer and also the most common tumor type in the head and neck region. The 5-year
survival is approximately 50% and has increased only marginally during the last decades. The molecular pathogenesis of SCCHN is not yet completely understood, a fact
that complicates development of new therapeutic approaches [1]. Mutations in the p53 gene have been
* Correspondence:
1
Department of Medical Biosciences, Clinical Chemistry, Umeå University, By
6 M, 2nd floor, Umeå 90185, Sweden
Full list of author information is available at the end of the article
reported in one to two thirds of SCCHN [2]. The p53related transcription factor, p63, is reported to be overexpressed in the majority of primary SCCHN tumors [3,4].
p63 expression is regulated through two distinct promoters, giving rise to two main isoforms, TAp63 and
ΔNp63. TAp63 is transcribed from the external promoter
which contains the transactivating domain homologous to
p53, enabling it to regulate transcription of p53 target
genes. ΔNp63 is transcribed from an internal promoter
and acts in a dominant negative fashion with the ability to
overcome the cell cycle arrest and apoptosis normally
driven by p53 [5]. The main isoform overexpressed in
SCCHN is ΔNp63α, a critical pro-survival protein [6,7].
© 2015 Li et al.; licensee BioMed Central. This is an Open Access article distributed under the terms of the Creative Commons
Attribution License ( which permits unrestricted use, distribution, and
reproduction in any medium, provided the original work is properly credited. The Creative Commons Public Domain
Dedication waiver ( applies to the data made available in this article,
unless otherwise stated.
Li et al. BMC Cancer (2015) 15:342
Wilms’ tumor gene 1 (WT1) was first identified as a
tumor suppressor gene in Wilms’ tumor, a childhood kidney neoplasm [8]; later findings demonstrated oncogenic
properties in other malignancies including breast [9], lung
[10,11], ovarian [12,13] and brain tissue [14]. WT1 was
previously found to interact with p53 and p63 at protein
level in baby rat kidney cells and in Saos-2, an osteosarcoma cell line [15,16]. However, the interaction has not
been studied in any other cell types yet.
In SCCHN, WT1 overexpression has been reported by
Oji et al. [17] suggesting an oncogenic property. However, no functional study has been performed to investigate the role of WT1 in SCCHN tumorigenesis.
In the present study, our aims were to investigate the
function of WT1 in SCCHN and to examine possible interactions between WT1 and p63/p53. A positive correlation between WT1 and p63 was found in FaDu cells,
an SCCHN cell line. ChIP analysis verified WT1 binding
to the p63 promoters, designating p63 a target gene of
WT1. The functional link between WT1 and p63 was
further demonstrated by altered expression of several
known p63 target genes in WT1 knockdown cells. By silencing WT1 and p63 RNA, SCCHN cell proliferation
was decreased. WT1 and p63 were found to generate effects on cell proliferation through multiple genes involved in cell proliferation, cell cycle regulation and
DNA replication.
Methods
Cell culture
The FaDu cell line (ATCC HTB-43), derived from hypopharyngeal squamous cell carcinoma, was used for transfection experiments. The cells were maintained in Dulbecco’s
modified Eagle’s medium (Gibco, Stockholm, Sweden) containing 10% fetal bovine serum (Gibco) in 5% CO2 at 37°C.
siRNA and WT1D plasmid transfection
Pooled siGENOME SMART pool of WT1, p63 and p53
siRNA (Dhamacon, Chicago, USA) was used for transfection. To suppress expression of WT1, p63 and p53, FaDu
cells were transiently transfected with siRNA of WT1 (12.5
nM/well), p63 (5 nM/well) and p53 (5 nM/well) in six well
plates (3 × 10⁵ cells/well) and 96-well plates (8 × 10³ cells/
well). Lipofectamine RNAiMAX reagent (Invitrogen,
Carlsbad, CA, USA) was used for suppression of gene
expression. Cells were harvested at 24, 48 or 72 hours
after transfection for further analysis. To induce WT1D
overexpression, pcDNA 3.1 (+) vectors (Invitrogen,
Carlsbad, CA, USA) ligated with WT1 variant D were
constructed as previously described [18]. FaDu cells
were transiently transfected with 3 μg WT1D pcDNA
3.1 (+) vectors per well in six-well plates (5 × 10⁵ cells/
well) using lipofectamine 2000 (Invitrogen).
Page 2 of 12
MTT assay
Vybrant MTT Cell Proliferation Assay Kit (Invitrogen)
was applied to measure cell proliferation. FaDu cells
were collected at 0, 24 and 48 hours after transfection
and labeled with MTT solution (3-(4.5-dimethyldiazol2yl)-2.5-diphenyltetrazolium bromide) mixed with SDSHCL. Absorbance was measured on spectrometer at
570 nm wavelength.
Western blot
Total protein was extracted using lysis buffer (0.5% NP40, 0.5% NA-DOC, 0.1% SDS, 150nM NaCl, 50 mM Tris
pH 7.5, 1 mM EDTA, 1 mM NaF) supplemented with
protease inhibitor (Sigma-Aldrich, St. Louis, MO, USA).
Protein concentration was measured using BCA reagent
(Thermo Scientific, Rockford, IL, USA). Twenty μg of
each sample was separated using 10% SDS polyacrylamide gel electrophoresis (BIO-Rad, Hercules, CA,
USA) and then transferred to a PVDF membrane
(Millipore, Billerica, MA, USA). The membrane was
blocked using TBST containing 5% non-fat dry milk, then
incubated with mouse-monoclonal antibodies against WT1
(1:250, catalog no. M3561, DAKO, Glostrup, Denmark),
p63 (1:2000, catalog no. M7247, DAKO), p53 (1:1000, catalog no. PAb 1801, Abcam, Cambridge, UK) and β-actin
(1:10000, catalog no. MAB1501R, Millipore) followed by a
second incubation with peroxidase conjugated anti-mouse
polyclonal antibodies (1:5000, DAKO). The antibody (antip63) used in this study is able to detect bands corresponding to the expected molecular weights and according to
expression patterns of the various isoforms (TAp63α,
TAp63γ, ΔNp63α, and ΔNp63γ). Proteins were visualized
using a chemiluminescent detection system (ECL-advanced,
GE healthcare UK) in ChemiDoc XRS (Bio-Rad, Italy).
RNA extraction and cDNA preparation
Total RNA was extracted using TRIzol reagent (Invitrogen,
Stockholm, Sweden). cDNA was prepared using superscript
II reverse transcriptase kit according to the manufacturer’s
instructions (Invitrogen).
Chromatin immunoprecipitation (ChIP)/PCR analysis
ChIP analysis was performed using the Chromatin Immunoprecipitation Kit (Upstate Millipore, Billerica, MA, USA).
SKOV-3 cell line, derived from the ascitic fluid of a female
with an ovarian tumor (ATCC HTB-77) with no endogenous WT1 expression and null p53 expression (p53 mutation
at codon 89 and 179) was used as an extra negative control
[19,20]. Approximately 1 × 10⁶ FaDu cells with or without
WT1D transfection and SKOV-3 cells were crosslinked with
1% formaldehyde, followed by glycine to quench unreacted
formaldehyde. Chromatin was sonicated on ice to shear
crosslinked DNA to about 200–1000 bp in length using a
sonifier ultrasonic cell disrupter (Branson, Danbury, CT,
Li et al. BMC Cancer (2015) 15:342
USA) with 12 × 10s pulses. The sheared chromatin was resuspended in dilution buffer and 1% of the chromatin was
removed as input, followed by immunoprecipitation using
protein G magnetic beads with 2 μg of either anti-WT1 (C19) antibody (catalog no. sc-192, Santa Cruz Biotechnology
Inc, Santa Cruz, CA, USA) or normal rabbit IgG (catalog
no. 2729S, Cell Signalling technology Inc, Danvers, MA,
USA) at 4°C overnight with rotation. After the reversal of
crosslinks by incubation in ChIP elution buffer containing
proteinase K at 62°C for 2 h, DNA was purified using spin
columns. PCR reactions containing 2 μl of the immunoprecipitated DNA or input chromatin, primers and AmpliTaq
Gold (Applied Biosystem) in a 25 μl volume were performed
with initial denaturation at 95°C for 10 min, followed by
35 cycles (95°C for 30 s, 60°C for 30s and 72°C for 45 s) and
a final extension at 72°C for 10 min. Primer sequences for
p63 promoters are shown in Additional file 1: Table S1. PCR
products were fractioned on 1% agarose gel and ethidium
bromide stained DNA was visualized on Ultraviolet Transilluminator (Spectroline, Westbury, NY, USA). For quantitative real-time PCR, SYBR green master mix (Bio-Rad) was
used in a 25 μl volume of reaction. For PCR amplification of
cDNA, IQ Sybr Green supermix (Bio-Rad) was used, and
samples were analyzed on Iq5 (Bio-Rad). The primer sequences are the same as the sequences listed in Additional
file 1: Table S1.
Genome-wide gene expression array
From each sample, 200 ng RNA was used to produce
biotinylated cRNA using TargetAmp-Nano labeling kit
(Illumina, San Diego, CA, USA). A total of 750 ng biotinylated cRNA was hybridized to an Illumina HumanHT12 v4 Expression BeadChip according to the manufacturers’ protocol (Illumina). Arrays were scanned using
Illumina iScan Reader. The GenomeStudio (Illumina) software was used for data processing. For normalization,
background correction and variance stabilization transformation Lumi package was used [21]. Differentially
expressed genes were identified based on a moderated t test
using MEV software package from TIGR [22]. Network
analysis was carried out with the Metacore software (GeneGo Inc, St Joseph, MI, USA). Pathway analysis was carried
out using the Database for Annotation, Visualization, and
Integrated Discovery (DAVID) tool [23].
Page 3 of 12
2729S, Millipore, Billerica, U.S.A.) antibodies at 4°C overnight, then incubated with Protein G Sepharose 4 Fast Flow
(GE Healthcare, Uppsala, Sweden) at 4°C for 1 hr. Immunoprecipitates were washed with lysis buffer three times.
Immunoprecipitated proteins were eluted with SDS-sample
buffer and analyzed by SDS-PAGE and Western blotting.
Immuno-blotting was conducted using anti-WT1 (1:250,
catalog no. M3561, DAKO, Glostrup, Denmark), p53
(1:2000, catalog no. PAb 1801, Abcam, Cambridge, UK)
and p63 (1:2000, catalog no. M7247, DAKO, Glostrup,
Denmark).
Patient samples and real-time quantitative PCR
After obtaining informed written consent, tumor biopsies were taken from 15 patients with SCCHN, clinically
adjacent tumor-free tissue was available from 7 of the
patients. Punch biopsies were taken from 14 healthy
non-smoking volunteers. The tissue specimen collection
had been approved by the Ethics Committee at Umeå
University (Dnr 01–057). WT1 mRNA level was quantified by real-time quantitative PCR (RT-qPCR) using TaqMan technology in 7900HT system (Applied Biosystems,
Foster City, CA, USA). RT-qPCR reactions were carried
out in a 25 μL volume containing 12.5 μL universal PCR
master mix, each primer at a concentration of 0.5 mM,
probe at 0.1 mM, and 50 ng of cDNA. Triplicate assays
were run in parallel for each sample. WT1 transcription
values were normalized against the expression of β-actin,
to adjust for variations in RNA and cDNA synthesis.
The mean of triplicates of the WT1 gene copy numbers
was divided by the mean of duplicates of copy numbers
of the β-actin. Primers and probes for the WT1 and βactin gene and the amplification conditions have been
described previously [24].
Statistical analysis
Statistical analysis was performed using SPSS (version 19,
SPSS Inc., Chicago, IL, USA). Mann–Whitney U-test was
used to compare differences in the expression of two different variables. Fisher’s exact tests (when sample size was
<5) were used for comparison of proportions. A p-value <
0.05 was considered to be significant.
Results
Protein co-immunoprecipitation (co-IP)
FaDu cells were lysed in cold lysis buffer (0.5% NP-40,
0.5% NA-DOC, 0.1% SDS, 150nM NaCl, 50 mM Tris
pH 7.5, 1 mM EDTA, 1 mM NaF) supplemented with
protease inhibitor (Sigma-Aldrich, St. Louis, USA) for
30 min at 4°C; lysates were clarified by centrifugation at
14,000 rpm for 30 min at 4°C. Equivalent amounts of protein lysate were incubated with the anti-WT1 (catalog no.
M3561, DAKO, Glostrup, Denmark), anti-IgG (catalog no.
Altered cell proliferation through knockdown of WT1,
p63 and p53
To determine the effect of WT1, p63 and p53 on cell
proliferation in FaDu cells in vitro, MTT assays were
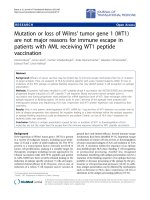
performed. Knockdown of WT1 resulted in a significant
decrease in cell proliferation at 24 and 48 hours after
transfection (p < 0.05, Figure 1A). Similarly, silencing
p63 RNA induced a considerable decrease in cell proliferation at both time points (p < 0.05, Figure 1B). These
Li et al. BMC Cancer (2015) 15:342
Page 4 of 12
Correlation between WT1 expression and p63/p53 in
FaDu cells
Previous studies have demonstrated a protein-protein interaction between WT1 and p63/p53 [16,27]. Furthermore,
WT1 has been reported to exert protein stabilization on
p53 in some cellular settings [15]. In order to study the relationship between WT1 and p63/p53 in SCCHN, transfection experiments in FaDu cells were performed. Suppressed
expression of WT1, p63 and p53 were induced using
siRNA technologies.
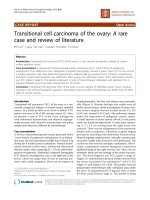
Successful silencing of WT1 RNA resulted in downregulated expression of WT1 protein as seen on western
blot (Figure 2A). Distinctly decreased expression of
ΔNp63 (68 kDa) was observed in cells with suppressed
WT1 expression compared to control cells. However, we
found that expression of the TAp63α (75 kDa) was much
weaker than ΔNp63α (68 kDa). TAp63α showed no
changes in expression in our experiments. γ-isoforms
(TAp63γ or ΔNp63γ) were not detectable in FaDu cells
(data not shown). A slight decrease in protein expression
of p53 in WT1 knockdown cells was observed only at
72 hours after transfection.
Knockdown of p63 induced a slight decrease in protein
expression of WT1 at 48 and 72 hours after transfection
(Figure 2B). Decreased expression of p53 was observed
only at 72 hours after transfection.
No alterations of WT1 or p63 protein expression were
observed in p53 knockdown cells (Figure 2C).
An additional experiment was performed to confirm
the positive correlation between WT1 and ΔNp63 using
a plasmid carrying WT1D variant into FaDu cells. Upregulation of ΔNp63 protein levels was observed in cells
with forced overexpression of WT1D (Figure 2D). Again,
altered expression of TAp63α was not found (data not
shown).
These results indicate a possible functional link between WT1 and p63 in FaDu cells, but not a strong association between WT1 and p53 expression.
p63 is a WT1 target gene
Figure 1 Alterations in cell proliferation by knockdown of WT1, p63 or
p53 in FaDu cells. MTT analysis of FaDu cells transiently transfected with
siRNA targeting WT1 (A), p63 (B) and p53 (C). *p < 0.05.
results indicate that both WT1 and p63 have a positive
effect on cell proliferation in FaDu cells.
p53 function is inactivated in up to 80% of HNSCC [25].
In the FaDu cell line, p53 has a point mutation at codon
248 (Arg → Leu) [26]. The R248L mutation of p53 does
not completely abolish its inhibitory effect on cell proliferation in this cell line. As shown in Figure 1C, a significant
increase in cell proliferation in p53 knockdown cells was
demonstrated at 48 hours after transfection compared to
control cells (p < 0.05).
A positive correlation between WT1 and p63 gene expression was found as described above. To assess whether p63
is a target gene of WT1, the binding properties of WT1 to
the p63 promoters were examined using ChIP/PCR. Two
putative GNGNGGGNG WT1-binding sites in the TAp63
promoter and one putative WT1-binding site in the
ΔNp63 promoter were identified by sequencing analysis
(Additional file 1: Table S1). ChIP was performed with
WT1D transfected and non-transfected FaDu cells and
chromatin precipitated with WT1 antibodies. PCR amplification products could be demonstrated in the region of
the second WT1-binding site of the TAp63 promoter and
at the ΔNp63 WT1-binding site (Figure 3A). Results were
also confirmed with quantitative real-time PCR (Figure 3B
Li et al. BMC Cancer (2015) 15:342
Page 5 of 12
Figure 2 Alterations of protein expression of WT1 and p63/p53 using in vitro experiments in FaDu cells, demonstrated by western blot. Cells were harvested
at 24, 48 or 72 hours after transient transfection with siRNA targeting WT1 (A) p63 (B) p53 (C) and after WT1D plasmid transfection at 24 hours (D).
for the TAp63 second binding site and Figure 3C for the
ΔNp63 WT1-binding site). Consequently, using ChIP/
PCR assay we could demonstrate direct binding of WT1
to the p63 promoters.
WT1 can regulate p63 transcription through multiple
genes involved in cell growth
Genes with altered expression in response to knockdown
of WT1 or p63 were detected with microarray analysis. Silencing WT1 RNA induced significant fold changes of 848
genes compared to control (Figure 4A). Significantly altered expression of 925 genes was found in cells with suppressed p63 expression. Interestingly, by combining the
two profiles we found that 124 genes had significantly altered fold changes (p < 0.05, Figure 4A). Eighteen of these
genes were found to be involved in cell proliferation, cell
cycle regulation and DNA replication (Table 1). Ten genes
involved in cell proliferation, five genes involved in cell
cycle regulation and three genes associated with DNA replication were significantly altered in WT1 and p63 knockdown cells (p < 0.005, Table 1).
Five negative regulators of cell proliferation IGFBP3,
RARRES1, TIMP2, CDKN1B, LDOC1 and one positive
regulator, MMP7, demonstrated increased expression. Two
suppressors, TOB2 and SFN and one activator, NGFR,
showed decreased expression. TGM2, a positive regulator
of cell cycle progression and C13orf15, which has been described as both activator and suppressor of cell cycle progression, demonstrated increased expression. Skp2, another
activator of cell cycle progression showed decreased expression. All three positive regulators of DNA replication,
MCM3, MCM5 and RFC3 demonstrated decreased expression. Interestingly, IL8, an activator of cell proliferation,
demonstrated decreased expression in WT1 knockdown
cells, but increased expression in p63 knockdown cells. No
genes associated with apoptosis were found to be altered in
the combined profiles. However, knockdown of p63 was
found to induce alterations in the transcription of 24 genes
involved in apoptosis.
In addition, by using Metacore GeneGo analysis, 6
known WT1 target genes and 27 known p63 downstream
target genes were found to be affected in WT1 knockdown
cells (Figure 4B). In p63 knockdown cells, 44 known p63
target genes were affected (Additional file 2: Figure S1).
Among those p63 target genes, ten demonstrated altered
expression in both WT1 knockdown and p63 knockdown
cells (Table 2). Expression of four genes was significantly
decreased by p63 and WT1 siRNA transfection. SFN is
known to be repressed by p63 while Skp2 and CAD can be
activated by p63. In contrast, significantly increased expression of six genes was shown (Table 2). CITED2 and GDF2
are known to be activated by p63 whereas PLAC8 and
IGFBP3 are repressed by p63. The effects of p63 on Fjx1,
INPP4B and TGM2 are unspecified. Taken together, these
genes are known to be involved in cell cycle, cell growth,
cell migration, cell proliferation, inositol phosphate metabolism and pyrimidine metabolism.
WT1 protein interacts with p53 but not p63
In order to study the protein interaction between WT1
and p53/p63, co-IP analysis was performed. As shown in
Figure 5, p53 was detected in WT1 immune-complexes
Li et al. BMC Cancer (2015) 15:342
Page 6 of 12
Figure 3 WT1 binds to the promoters of the p63 gene. ChIP/PCR analysis of WT1D transfected and non-transfected FaDu cells. A. PCR analysis of
the precipitate using p1, p2 and p3 primer pairs. Size and location of the amplified products are depicted on the right. B and C. RT-qPCR analysis
of the precipitate using the p2 (B) and p3 (C) primer pairs.
but not p63, indicating protein interaction occurred between WT1 and p53 in FaDu cells.
High WT1 RNA expression in clinical samples
WT1 RNA expression levels were analyzed by real-time
quantitative PCR (RT-qPCR) in 15 SCCHN tumor specimens, 7 adjacent tumor-free tissue samples and 14 normal
control tissues of the tongue. Significantly higher WT1
mRNA levels were detected in tumor specimens compared to adjacent tumor-free tissue samples (Additional
file 3: Figure S2, p < 0.001) and normal control tongue tissues (Additional file 3: Figure S2, p=0.001), indicating
overexpression of WT1 in SCCHN. No significant correlation was found between WT1 mRNA levels and clinical
features including age, sex, tumor stage, overall survival
and disease specific survival (data not shown). Using immunohistochemistry, we performed WT1 protein staining
in 90 formalin-fixed tumour samples and found that only
5 out of 90 samples showed positive staining in cytoplasm.
Discussion
In the present study we found a novel positive correlation between WT1 and p63 gene expression and further
confirmed that WT1 regulates p63 expression through
direct binding to the p63 promoters. Both WT1 and p63
were found to promote cell proliferation in SCCHN
cells. Further, in vitro experiments showed altered expression of 18 genes involved in cell proliferation, cell
cycle regulation and DNA replication shared by silencing
of WT1 and p63 RNA. Several known WT1 and p63
Li et al. BMC Cancer (2015) 15:342
Page 7 of 12
Figure 4 WT1 regulates p63 transcription through multiple genes with microarray analysis. A. Venn diagram of the number of differentially expressed
genes with a fold change greater than two and a p value less than 0.05 following WT1 or p63 gene knockdown in FaDu cells. WT1 and p63 regulated
genes displayed an overlap of 124 genes. B. Altered gene expression of known WT1 and p63 target genes by WT1 siRNA transfection in FaDu cells.
Network analysis was performed based on array data using GeneGo software. Increased gene expression is indicated by a red circle on the upper right
corner of each network object, whereas a blue dot indicates downregulation. Different shapes and colors represent various gene/protein function.
target genes were affected by knockdown of WT1. Additionally, WT1 mRNA levels were overexpressed in
SCCHN samples.
Using in vitro experiments, we found decreased cell
proliferation due to loss of WT1 in FaDu cells. WT1 isoform D was recently found to induce cell proliferation in
oral squamous cell carcinoma cells, a subtype of SCCHN
[28]. Furthermore, increased cell proliferation induced
by WT1 has been shown in several other types of cancer
cells including non-small cell lung cancer [11] and several solid cancer cells [29]. The collected data suggest
that WT1 functions as an oncogene in these neoplasms.
Overexpression of p63 has been found in a majority of
patients with squamous cell carcinomas and SCCHN
[30]. In FaDu cells, ΔNp63 has been found to be the
main isoform [6,31]. One previous study has shown that
knockdown of the ΔNp63 isoform, but not the TAp63
isoform inhibits cell proliferation in some SCCHN cell
lines [32]. However, another study has shown that the silencing of ΔNp63 in FaDu cells does not alter the proliferation state, as judged by Ki-67 expression and FACS
analysis regarding cell cycle phase DNA content [4]. In
the present study decreased cell proliferation was observed in p63 knockdown cells, showing that p63 can
promote cell proliferation in FaDu cells and overexpression of ΔNp63 isoform was detected by western blot.
Our results support the expected oncogenic role of the
p63 gene in this cell line.
The FaDu cell line contains a point mutation of p53 at
codon 248 (Arg → Leu) [26], one of the most frequent mutation sites of the gene [25]. Codon 248 is located in the
DNA binding domain and mutations in this specific location has suggested generating a protein incapable of binding to target DNA, thereby losing its regulatory function on
Li et al. BMC Cancer (2015) 15:342
Page 8 of 12
Table 1 Significant fold changes of expression of genes involved in cell proliferation, cell cycle regulation and DNA
replication by knockdown of WT1 or p63 in FaDu cells
Term
Gene name
Cell proliferation
MMP7
Cell cycle
DNA replication
Expected effect*
Fold change (vs control)
Activator
siWT1 RNA
sip63 RNA
2.11
4.11
NGFR
Activator
0.47
0.36
IL8
Activator
0.46
2.22
IGFBP3
Suppressor
2.63
2.85
RARRES1
Suppressor
2.48
8.36
TIMP2
Suppressor
2.12
2.07
CDKN1B
Suppressor
2.09
2.45
LDOC1
Suppressor
2.01
2.69
TOB2
Suppressor
0.48
0.36
SFN
Suppressor
0.41
0.38
TGM2
Activator
4.14
4.22
Skp2
Activator
0.49
0.46
C13orf15
Activator/Suppressor
4.07
15.17
SMAD6
Unspecified
3.19
3.06
CITED2
Unspecified
2.30
3.18
MCM3
Activator
0.48
0.49
MCM5
Activator
0.40
0.48
RFC3
Activator
0.37
0.44
*Expected effect of the listed genes was based on previous studies.
transcription [33]. Failure of induction of p53-dependent
apoptosis has previously been demonstrated in FaDu cells
[34]. However, we observed that p53 had an inhibitory effect on cell proliferation. The same mutation in H322a, a
non-small cell lung cancer cell line, showed that mutant
p53R248L still possesses a tumor suppressor function, as
demonstrated by expansion of cell proliferation due to reduction in gene expression [35].
WT1 is known to regulate transcription of an extensive number of genes [36]. In this study we found a
strong positive correlation between WT1 and p63 and
confirmed that the WT1 protein binds to the p63 promoters, assessed by ChIP/PCR analysis which showed
that p63 is a target gene of WT1. A direct binding of
WT1 protein to the promoters of the two main p63 isoforms, TAp63 and ΔNp63 was demonstrated. However,
Table 2 Fold changes in expression of known p63 target genes in response to WT1 and p63 gene knockdown in FaDu
cells
Gene name
Expected effect by p63*
siWT1
sip63
SFN
Repressed
0.41
0.38
Cell proliferation
Skp2
Activated
0.49
0.46
Cell cycle
CAD
Activated
0.50
0.47
Pyrimidine metabolism
Fjx1
Unspecified
0.44
0.47
Cell growth
INPP4B
Unspecified
1.10
1.27
Inositol phosphate metabolism
CITED2
Activated
1.20
1.67
Cell cycle
TGM2
Unspecified
2.05
2.08
Cell cycle
PLAC8
Repressed
2.51
2.43
Cell migration
GDF15
Activated
1.18
2.66
Cell migration
IGFBP3
Repressed
2.63
2.85
Cell proliferation
*Expected effect of the listed genes was based on previous studies.
Fold change (vs control)
Gene function
Li et al. BMC Cancer (2015) 15:342
Page 9 of 12
Figure 5 Protein interactions between WT1 and p53 but not p63 by co-IP. Equivalent amounts of protein lysate from FaDu cells were incubated
with the anti-WT1, anti-IgG antibodies, followed by incubation with Protein G Sepharose 4 Fast Flow. Immunoprecipitated proteins were analyzed
by Western blotting. Immuno-blotting was conducted using anti-WT1, p53 and p63.
the WT1 binding site (P1,-502 to –493), far from the
major transcription start site in the TAp63 promoter,
was not involved. We did not find any altered TAp63 expression in our experiment. Low efficiency may be explained by very low expression of TAp63 in FaDu cells
by western blot and only one binding site on TAp63
promoter by WT1 protein by ChIP/PCR. As mentioned
previously, ΔNp63 is the only major isoform expressed
and the isoform that plays a major functional role in
FaDu cells.
Previous studies have presented evidence for a
protein-protein interaction between WT1 and p53 in
baby rat kidney [37] cells, as well as in Wilms’ tumors
[27]. A p53 mutation at position homologues to human
codon 248 in BRK cells did not abolish this interaction.
Furthermore, WT1-induced p53 protein stabilization has
been reported in Saos-2 cells [15]. In this study, we also
showed that WT1 interact with p53 in FaDu cell by
using Co-IP analysis and observed decreased protein
levels of p53 in cells with suppressed WT1 expression at
72 hours. Results may be explained by previous findings
regarding p53 protein stabilization. In contrast to previous study [16], protein interaction between WT1 and
p63 was not detected in FaDu cells.
Microarray analysis showed that 18 genes involved in
cell proliferation, cell cycle regulation and DNA replication were significantly altered in both WT1 and p63
knockdown cells. Five of these genes were previously described as p63 target genes. ΔNp63 has been reported to
directly repress the expression of the p53-target genes
IGFBP-3 [38] and SFN (14-3-3σ) [39], supporting the
known dominant negative effect of ΔNp63 regarding
p53 function [5]. CITED2 and Skp2 were also previously
identified target genes of p63 [40,41]. CDKN1B (p27kip1)
expression has been shown to be inversely correlated to
ΔNp63 expression, suggesting a possible direct negative
regulation of ΔNp63 on CDKN1B transcription [32].
The fold changes of 11 of these 18 genes were almost
identical. An indirect regulation of p63 target genes as
major mechanism for WT1 regulation of listed genes is
therefore not likely. According to immunoblot results,
WT1-knockdown cells express p63 at a reduced level,
still enabling transcriptional regulation as opposed to
p63-knockdown cells. MMP7, RARRES1, C13orf15 and
CITED2 are genes showing a distinct difference between
WT1 and p63 knockdown cells. These genes were all
shown to be repressed by both p63 and WT1, but to a
greater extent by p63. Indirect regulation by WT1 might
serve as regulation of those genes. CITED2, as mentioned previously is the only known p63 target gene of
the above listed genes [40].
MMP-7 is a matrix degrading protein usually associated with tumor invasion and angiogenesis in cancer
progression [42], but has also been linked to induction
of proliferation [43] and apoptosis [44]. In contrast to
these findings, we showed increased fold changes of
MMP7 expression in both WT1 and p63 knockdown
cells. MMP-7 has been reported to be overexpressed in
SCCHN [45].
Previous studies have shown contradictory functions for
the RGC-32 gene (C13orf15). RGC-32 has been reported
to promote cell cycle progression and thereby cell proliferation [46]. However, tumor suppressor properties of the
RGC-32 gene have also been reported. RGC-32 has been
identified as a p53 target gene with an ability to inhibit cell
proliferation by the induction of G2/M arrest [47]. RGC32 was found in the present study to be extensively upregulated in p63 knockdown cells. Our results suggest that
RCG-32 may act as a tumor suppressor in FaDu cells.
Interestingly, IL8 demonstrated decreased expression
when silencing WT1, but an increased fold change when
knocking down p63. IL8 is known to be a pro-inflammatory
chemokine that responds to the activation of NF-κβ. IL8 induces angiogenesis through activation of endothelial cells
and has been reported to act as an autocrine growth factor
inducing cell proliferation [48]. A recent study showed that
ΔNp63 can bind to the IL8 promoter and alter gene expression when interacting with RelA or cRel, members of the
NF-κβ family [49]. Contrary to the observations in our
in vitro experiment, ΔNp63 has previously shown to have
Li et al. BMC Cancer (2015) 15:342
an activating effect on IL8 transcription in SCCHN cells
[50]. Association between WT1 and IL8 expression has not
previously been reported. Further studies are therefore
needed to investigate whether WT1 regulates IL8 expression
directly or indirectly.
The effects of WT1 and p63 on cell proliferation observed in this study can be explained by their regulation of
many genes involved in proliferation, cell cycle processes
and DNA replication. Additionally, WT1 was found to
regulate genes involved in the p53, Wnt and PI3K/AKT-1
signaling pathways, giving further ground for the proliferative effect of WT1 in FaDu cells. In the present study we
suggested that WT1 could inhibit the p53-signaling pathway through transcriptional regulation of activators and repressors of the pathway. No alterations of apoptosisregulating genes were found in WT1-depleted cells, suggesting a possible alteration of this signaling pathway
through cell cycle arrest and transcriptional activation of
DNA repair genes. Furthermore, in this study we could not
detect any pattern of up- or downregulation of the Wnt or
PI3K/AKT-1 pathways. However, earlier studies have identified nine genes in the Wnt signaling pathway to be direct
targets of WT1 [51]. The PI3K/AKT-1 pathway has been
implicated in WT1 signaling in lung cancer [52].
Using Metacore GeneGo software we found that expressions of ten known p63 target genes were altered in both
WT1 and p63 knockdown cells. These genes were involved
in the cell cycle, cell growth, cell migration, cell proliferation, inositol phosphate metabolism and pyrimidine metabolism. SFN was previously found to be negatively regulated
by ΔNp63 in primary human epidermal keratinocytes
(HEKs) as described above [39]. Skp2 expression has been
found positively regulated by p63 in HEKs [41]. Using
ChIP-on-chip array analysis, Huang et al. found that the
ΔNp63 protein could bind to the CAD promoter in squamous cell carcinoma cells when cells were exposed to cisplatin [53]. A previous study showed that p63 could
activate the CITED2 promoter in keratinocytes [54]. In human keratinocytes, HaCaT, TAp63 was found to activate
GDF15 by directly binding to the promoter [55]. The proapoptotic protein IGFBP-3 has been shown to be negatively
regulated by ΔNp63α in the squamous epithelial cell lines
HaCaT and SCC-1 [38]. However, these known p63 target
genes have not been reported correlated with WT1. Further
studies are needed to find out whether WT1 can directly
regulate these genes.
In agreement with a study by Oji et al. [17], overexpression of WT1 was detected in SCCHN tissue samples in
our patient cohort. In a study by Mikami et al., WT1
mRNA was found to be overexpressed in one of six cell
lines from oral squamous cell carcinoma. Immunohistochemical analysis of tissue sections showed overexpression
of WT1 protein in two of 29 patients with oral squamous
cell carcinoma, suggesting that WT1 plays an important
Page 10 of 12
role in the pathogenesis of some types of oral squamous
cell carcinoma [56]. No correlation between WT1 mRNA
levels and clinical parameters such as age, sex, tumor stage
and overall survival was observed in our limited patient
cohort. The potential prognostic impact should, however,
be studied in larger patient cohorts.
Conclusions
Our experimental results in FaDu cells indicate oncogenic roles for WT1 and p63 in SCCHN cells. We reported for the first time that WT1 can directly regulate
p63 expression and induce an effect on several known
p63 target genes. Therefore, therapeutic approaches targeting the WT1 and p63 proteins might serve as alternative treatment in SCCHN. These findings may warrant
further investigation regarding the effects of WT1 and
p63 inhibitors in vitro and in vivo.
Additional files
Additional file 1: Table S1. Primers used for amplification of p63
promoters regions.
Additional file 2: Figure S1. Altered gene expression of known p63
target genes was found by p63 siRNA transfection in FaDu cells. Network
analysis was performed based on array data using GeneGo software.
Increased gene expression is indicated by a red circle on the upper right
corner of each network object, whereas a blue dot indicates
downregulation. Different shapes and colors represent various gene/
protein functions.
Additional file 3: Figure S2. WT1 mRNA levels in tongue tumor tissue
samples compared to adjacent tumor-free tissues or normal control
tongue tissue.
Abbreviations
WT1: Wilms’ tumor gene 1; SCCHN: Squamous cell carcinoma of the head
and neck; siRNA: Silencing RNA; ChIP: Chromatin immunoprecipitation;
Co-IP: Co-immunoprecipitation; DAVID: Database for annotation, visualization,
and integrated discovery; RT-qPCR: Real-time quantitative PCR; BRK: Baby rat
kidney; HEKs: Human epidermal keratinocytes.
Competing interests
The authors declare that they have no competing interests.
Authors’ contributions
XL, AL conceived and designed the study. XL, SO, SW, EJ and LB performed
different experiments. The data was analyzed by XL, SO, SW, EJ, LB and XG.
KN contributed the materials, reagents and analysis tools. The manuscript
was written by XL, SO, SW and AL. All authors were involved in revising the
manuscript. All authors read and approved the final manuscript.
Acknowledgement
This study was supported by grants from the Children’s Cancer Foundation
in Sweden (PROJ 05/084), the Lion’s Cancer Research Foundation, Umeå,
Sweden and the County Council of Västerbotten, Umeå, Sweden
(ALF 7000468 and 218401).
Author details
1
Department of Medical Biosciences, Clinical Chemistry, Umeå University, By
6 M, 2nd floor, Umeå 90185, Sweden. 2Department of Medical Biosciences,
Pathology, Umeå University, By 6 M, 2nd floor, Umeå 90185, Sweden.
Received: 7 January 2015 Accepted: 23 April 2015
Li et al. BMC Cancer (2015) 15:342
References
1. Rothenberg SM, Ellisen LW. The molecular pathogenesis of head and neck
squamous cell carcinoma. J Clin Invest. 2012;122(6):1951–7.
2. Gasco M, Crook T. The p53 network in head and neck cancer. Oral Oncol.
2003;39(3):222–31.
3. Ramsey MR, Wilson C, Ory B, Rothenberg SM, Faquin W, Mills AA, et al.
FGFR2 signaling underlies p63 oncogenic function in squamous cell
carcinoma. J Clin Invest. 2013;123(8):3525–38.
4. Thurfjell N, Coates PJ, Vojtesek B, Benham-Motlagh P, Eisold M, Nylander K.
Endogenous p63 acts as a survival factor for tumour cells of SCCHN origin.
Int J Mol Med. 2005;16(6):1065–70.
5. Yang A, Kaghad M, Wang Y, Gillett E, Fleming MD, Dotsch V, et al. p63, a p53
homolog at 3q27-29, encodes multiple products with transactivating,
death-inducing, and dominant-negative activities. Mol Cell. 1998;2(3):305–16.
6. Hibi K, Trink B, Patturajan M, Westra WH, Caballero OL, Hill DE, et al. AIS is
an oncogene amplified in squamous cell carcinoma. Proc Natl Acad Sci
U S A. 2000;97(10):5462–7.
7. Chung J, Lau J, Cheng LS, Grant RI, Robinson F, Ketela T, et al. SATB2
augments Delta Np63 alpha in head and neck squamous cell carcinoma.
Embo Rep. 2010;11(10):777–83.
8. Call KGC, Ito A, Buckler J, Pelletier D, Haber E, Rose A, et al. Isolation and
characterization of a zinc finger polypeptide gene at the human
chromosome 11 Wilm’s tumor locus. Cell. 1990;60:509–20.
9. Loeb DM, Evron E, Patel CB, Sharma PM, Niranjan B, Buluwela L, et al. Wilms’
tumor suppressor gene 1 is expressed in primary breast tumors despite
tumor-specific promoter methylation. Cancer Res. 2001;61(3):921–5.
10. Oji Y, Miyoshi S, Maeda H, Hayashi S, Tamaki H, Nakatsuka S, et al.
Overexpression of the Wilms’ tumor gene WT1 in de novo lung cancers. Int
J Cancer. 2002;100(3):297–303.
11. Xu CH, Wu C, Xia Y, Zhong ZP, Liu X, Xu J, et al. WT1 Promotes Cell
Proliferation in Non-Small Cell Lung Cancer Cell Lines Through UpRegulating Cyclin D1 and p-pRb In Vitro and In Vivo. PLoS One.
2013;8(8):e68837. doi: 10.1371/journal.pone.0068837.
12. Shimizu M, Toki T, Takagi Y, Konishi I, Fujii S. Immunohistochemical
detection of the Wilms’ tumor gene 1 in epithelial ovarian tumors. Int J
Gynecol Pathol. 2000;19(2):158–63.
13. Andersson C, Oji Y, Ohlson N, Wang S, Li X, Ottander U, et al. Prognostic
significance of specific anti-WT1 IgG antibody level in plasma in patients
with ovarian carcinoma. Cancer Med. 2014;3(4):909–18.
14. Oji Y, Suzuki T, Nakano Y, Maruno M, Nakatsuka S, Jomgeow T, et al.
Overexpression of the Wilms’ tumor gene W T1 in primary astrocytic
tumors. Cancer Sci. 2004;95(10):822–7.
15. Maheswaran S, Englert C, Bennett P, Heinrich G, Haber DA. The WT1 gene
product stabilizes p53 and inhibits p53-mediated apoptosis. Genes Dev.
1995;9(17):2143–56.
16. Scharnhorst V, Dekker P, van der Eb AJ, Jochemsen AG. Physical interaction
between Wilms tumor 1 and p73 proteins modulates their functions. J Biol
Chem. 2000;275(14):10202–11.
17. Oji Y, Inohara H, Nakazawa M, Nakano Y, Akahani S, Nakatsuka S, et al.
Overexpression of the Wilms’ tumor gene WT1 in head and neck squamous
cell carcinoma. Cancer Sci. 2003;94(6):523–9.
18. Jomgeow T, Oji Y, Tsuji N, Ikeda Y, Ito K, Tsuda A, et al. Wilms’ tumor gene
WT1 17AA(-)/KTS(-) isoform induces morphological changes and promotes
cell migration and invasion in vitro. Cancer Sci. 2006;97(4):259–70.
19. Yaginuma Y, Westphal H. Abnormal structure and expression of the p53
gene in human ovarian-carcinoma cell-lines. Cancer Res. 1992;52(15):4196–9.
20. Kaneuchi M, Sasaki M, Tanaka Y, Shiina H, Yamada H, Yamamoto R, et al.
WT1 and WT1-AS genes are inactivated by promoter methylation in ovarian
clear cell adenocarcinoma. Cancer. 2005;104(9):1924–30.
21. Du P, Kibbe WA, Lin SM. lumi: a pipeline for processing Illumina microarray.
Bioinformatics. 2008;24(13):1547–8.
22. Saeed AI, Sharov V, White J, Li J, Liang W, Bhagabati N, et al. TM4: a free,
open-source system for microarray data management and analysis.
Biotechniques. 2003;34(2):374.
23. Dennis G, Sherman BT, Hosack DA, Yang J, Gao W, Lane HC, et al. DAVID:
Database for annotation, visualization, and integrated discovery. Genome
Biol. 2003;4(5):P3. Epub 2003 Apr 3.
24. Sitaram RT, Degerman S, Ljungberg B, Andersson E, Oji Y, Sugiyama H, et al.
Wilms’ tumour 1 can suppress hTERT gene expression and telomerase
activity in clear cell renal cell carcinoma via multiple pathways. Br J Cancer.
2010;103(8):1255–62.
Page 11 of 12
25. Leemans CR, Braakhuis BJ, Brakenhoff RH. The molecular biology of head
and neck cancer. Nat Rev Cancer. 2011;11(1):9–22.
26. Kim MS, Li SL, Bertolami CN, Cherrick HM, Park NH. State of P53, Rb and Dcc
tumor-suppressor genes in human oral-cancer cell-lines. Anticancer Res.
1993;13(5A):1405–14.
27. Maheswaran S, Park S, Bernard A, Morris JF, Rauscher FJ, Hill DE, et al.
Physical and functional interaction between Wt1 and P53 proteins. Proc
Natl Acad Sci U S A. 1993;90(11):5100–4.
28. Rather MI, Swamy S, Gopinath KS, Kumar A. Transcriptional repression of
tumor suppressor CDC73, encoding an RNA polymerase II interactor, by
Wilms tumor 1 protein promotes cell proliferation: implication for cancer
therapeutics. J Biol Chem. 2014;289(2):968–76.
29. Oji Y, Ogawa H, Tamaki H, Oka Y, Tsuboi A, Kim EH, et al. Expression of the
Wilms’ tumor gene WT1 in solid tumors and its involvement in tumor cell
growth. Jpn J Cancer Res. 1999;90(2):194–204.
30. Sniezek JC, Matheny KE, Westfall MD, Pietenpol JA. Dominant negative p63
isoform expression in head and neck squamous cell carcinoma.
Laryngoscope. 2004;114(12):2063–72.
31. Nylander K, Vojtesek B, Nenutil R, Lindgren B, Roos G, Zhanxiang W, et al.
Differential expression of p63 isoforms in normal tissues and neoplastic
cells. J Pathol. 2002;198(4):417–27.
32. Chiang CT, Chu WK, Chow SE, Chen JK. Overexpression of delta Np63 in a
human nasopharyngeal carcinoma cell line downregulates CKIs and
enhances cell proliferation. J Cell Physiol. 2009;219(1):117–22.
33. Cho Y, Gorina S, Jeffrey PD, Pavletich NP. Crystal structure of a p53 tumor
suppressor-DNA complex: understanding tumorigenic mutations.
Science. 1994;265(5170):346–55.
34. Ndoye A, Merlin JL, Leroux A, Dolivet G, Erbacher P, Behr JP, et al. Enhanced
gene transfer and cell death following p53 gene transfer using
photochemical internalisation of glucosylated PEI-DNA complexes. J Gene
Med. 2004;6(8):884–94.
35. Mukhopadhyay T, Roth JA. A codon 248 p53 mutation retains tumor
suppressor function as shown by enhancement of tumor growth by
antisense p53. Cancer Res. 1993;53(18):4362–6.
36. Yang L, Han Y, Suarez Saiz F, Minden MD. A tumor suppressor and
oncogene: the WT1 story. Leukemia. 2007;21(5):868–76.
37. Nellissery MJ, Padalecki SS, Brkanac Z, Singer FR, Roodman GD, Unni KK,
et al. Evidence for a novel osteosarcoma tumor-suppressor gene in the
chromosome 18 region genetically linked with Paget disease of bone. Am J
Hum Genet. 1998;63(3):817–24.
38. Barbieri CE, Perez CA, Johnson KN, Ely KA, Billheimer D, Pietenpol JA.
IGFBP-3 is a direct target of transcriptional regulation by DeltaNp63alpha in
squamous epithelium. Cancer Res. 2005;65(6):2314–20.
39. Westfall MD, Mays DJ, Sniezek JC, Pietenpol JA. The Delta Np63 alpha
phosphoprotein binds the p21 and 14-3-3 sigma promoters in vivo and has
transcriptional repressor activity that is reduced by Hay-Wells syndromederived mutations. Mol Cell Biol. 2003;23(7):2264–76.
40. Pozzi S, Zambelli F, Merico D, Pavesi G, Robert A, Maltere P, et al. Transcriptional
network of p63 in human keratinocytes. PLoS One. 2009;4(3):e5008.
41. McDade SS, Patel D, McCance DJ. p63 maintains keratinocyte proliferative capacity
through regulation of Skp2-p130 levels. J Cell Sci. 2011;124(Pt 10):1635–43.
42. Ou L, Ma JB, Zheng XH, Chen X, Li GY, Wu HM. The expression and
refolding of isotopically labeled recombinant Matrilysin for NMR studies.
Protein Expres Purif. 2006;47(2):367–73.
43. Miyamoto S, Yano K, Sugimoto S, Ishii G, Hasebe T, Endoh Y, et al. Matrix
metalloproteinase-7 facilitates insulin-like growth factor bioavailability
through its proteinase activity on insulin-like growth factor binding protein
3. Cancer Res. 2004;64(2):665–71.
44. Powell WC, Fingleton B, Wilson CL, Boothby M, Matrisian LM. The
metalloproteinase matrilysin proteolytically generates active soluble Fas
ligand and potentiates epithelial cell apoptosis. Curr Biol. 1999;9(24):1441–7.
45. Pacheco MM, Kowalski LP, Nishimoto IN, Brentani MM. Differential
expression of c-jun and c-fos mRNAs in squamous cell carcinoma of the
head and neck: associations with uPA, gelatinase B, and matrilysin mRNAs.
Head Neck. 2002;24(1):24–32.
46. Badea T, Niculescu F, Soane L, Fosbrink M, Sorana H, Rus V, et al. RGC-32
increases p34CDC2 kinase activity and entry of aortic smooth muscle cells
into S-phase. J Biol Chem. 2002;277(1):502–8.
47. Saigusa K, Imoto I, Tanikawa C, Aoyagi M, Ohno K, Nakamura Y, et al. RGC32,
a novel p53-inducible gene, is located on centrosomes during mitosis and
results in G2/M arrest. Oncogene. 2007;26(8):1110–21.
Li et al. BMC Cancer (2015) 15:342
Page 12 of 12
48. Gales D, Clark C, Manne U, Samuel T. The Chemokine CXCL8 in
carcinogenesis and drug response. ISRN Oncol. 2013;2013:859154.
49. Yang X, Lu H, Yan B, Romano RA, Bian Y, Friedman J, et al. DeltaNp63
versatilely regulates a Broad NF-kappaB gene program and promotes
squamous epithelial proliferation, migration, and inflammation. Cancer Res.
2011;71(10):3688–700.
50. Yang CW, Hayashida T, Forster N, Li CQ, Shen DJ, Maheswaran S, et al. The
Integrin alpha (v) beta (3–5) Ligand MFG-E8 Is a p63/p73 target gene in
triple-negative breast cancers but exhibits suppressive functions in ER+ and
erbB2 (+) breast cancers. Cancer Res. 2011;71(3):937–45.
51. Kim MK, McGarry TJ POB, Flatow JM, Golden AA, Licht JD. An integrated
genome screen identifies the Wnt signaling pathway as a major target of
WT1. Proc Natl Acad Sci U S A. 2009;106(27):11154–9.
52. Wang X, Gao P, Lin F, Long M, Weng Y, Ouyang Y, et al. Wilms’ tumour
suppressor gene 1 is involved in the carcinogenesis of lung cancer through
interaction with PI3K/Akt pathway. Cancer Cell Int. 2013;13(1):114.
53. Huang Y, Bell LN, Okamura J, Kim MS, Mohney RP, Guerrero-Preston R, et al.
Phospho-DeltaNp63alpha/SREBF1 protein interactions: bridging cell
metabolism and cisplatin chemoresistance. Cell Cycle. 2012;11(20):3810–27.
54. Vigano MA, Lamartine J, Testoni B, Merico D, Alotto D, Castagnoli C, et al.
New p63 targets in keratinocytes identified by a genome-wide approach.
EMBO J. 2006;25(21):5105–16.
55. Ichikawa T, Suenaga Y, Koda T, Ozaki T, Nakagawara A. TAp63-dependent
induction of growth differentiation factor 15 (GDF15) plays a critical role in
the regulation of keratinocyte differentiation. Oncogene. 2008;27(4):409–20.
56. Mikami T, Hada T, Chosa N, Ishisaki A, Mizuki H, Takeda Y. Expression of
Wilms’ tumor 1 in oral squamous cell carcinoma. J Oral Pathol Med.
2013;42(2):133–9.
Submit your next manuscript to BioMed Central
and take full advantage of:
• Convenient online submission
• Thorough peer review
• No space constraints or color figure charges
• Immediate publication on acceptance
• Inclusion in PubMed, CAS, Scopus and Google Scholar
• Research which is freely available for redistribution
Submit your manuscript at
www.biomedcentral.com/submit